## 部署grafana組件
### 解壓grafana組件到指定目錄
```
# 解壓
tar xzvf grafana-7.4.0.linux-amd64.tar.gz -C /data/applications/prometheus
# 創建軟連接
ln -s grafana-7.4.0 grafana
```
### 創建文件夾
```
# 進入文件夾
cd /data/applications/prometheus/grafana
# 創建文件夾
mkdir data logs dashboards script
```
### 配置grafana.ini文件
```
#################################### Paths ####################################
[paths]
# Path to where grafana can store temp files, sessions, and the sqlite3 db (if that is used)
# use "cfg:default.paths.data" to specified via command line
data = /data/applications/prometheus/grafana/data
#
# Directory where grafana can store logs
# use "cfg:default.paths.logs" to specified via command line
logs = /data/applications/prometheus/grafana/logs
#
# Directory where grafana will automatically scan and look for plugins
# use "cfg:default.paths.plugins" to specified via command line
plugins = /data/applications/prometheus/grafana/plugins
#################################### Server ####################################
[server]
# Protocol (http or https)
;protocol = http
;The ip address to bind to, empty will bind to all interfaces
;http_addr = 192.168.70.133
# The http port to use, defaults to 3000
http_port = 3000
# The public facing domain name used to access grafana from a browser
domain = 192.168.70.133
# Redirect to correct domain if host header does not match domain
# Prevents DNS rebinding attacks
;enforce_domain = false
# The full public facing url
;root_url = http://localhost:3000/grafana/
root_url = %(protocol)s://%(domain)s/grafana/
# Serve Grafana from subpath specified in `root_url` setting. By default it is set to `false` for compatibility reasons.
serve_from_sub_path = true
```
### 創建run\_grafana.sh啟動文件
```
cd /data/applications/prometheus/grafana/script
vim run_grafana.sh
```
```
#!/bin/bash
set -e
DEPLOY_DIR=/data/applications/prometheus/grafana/
cd "${DEPLOY_DIR}" || exit 1
exec /data/applications/prometheus/grafana/bin/grafana-server --config=/data/applications/prometheus/grafana/conf/grafana.ini 2>&1 &
```
### 登錄grafana
```
http://192.167.70.133:3000/grafana
默認用戶名與密碼都是admin,首次登陸后,需要對admin的密碼進行修改
```
### 選擇您的配置選項
```
Grafana后端在其配置文件中定義了許多配置選項(通常在Linux系統上位于/etc/grafana/grafana.ini中)。
在此配置文件中,您可以更改默認管理員密碼,http端口,grafana數據庫(sqlite3,mysql,postgres),身份驗證選項(google,github,ldap,auth proxy)以及許多其他選項。
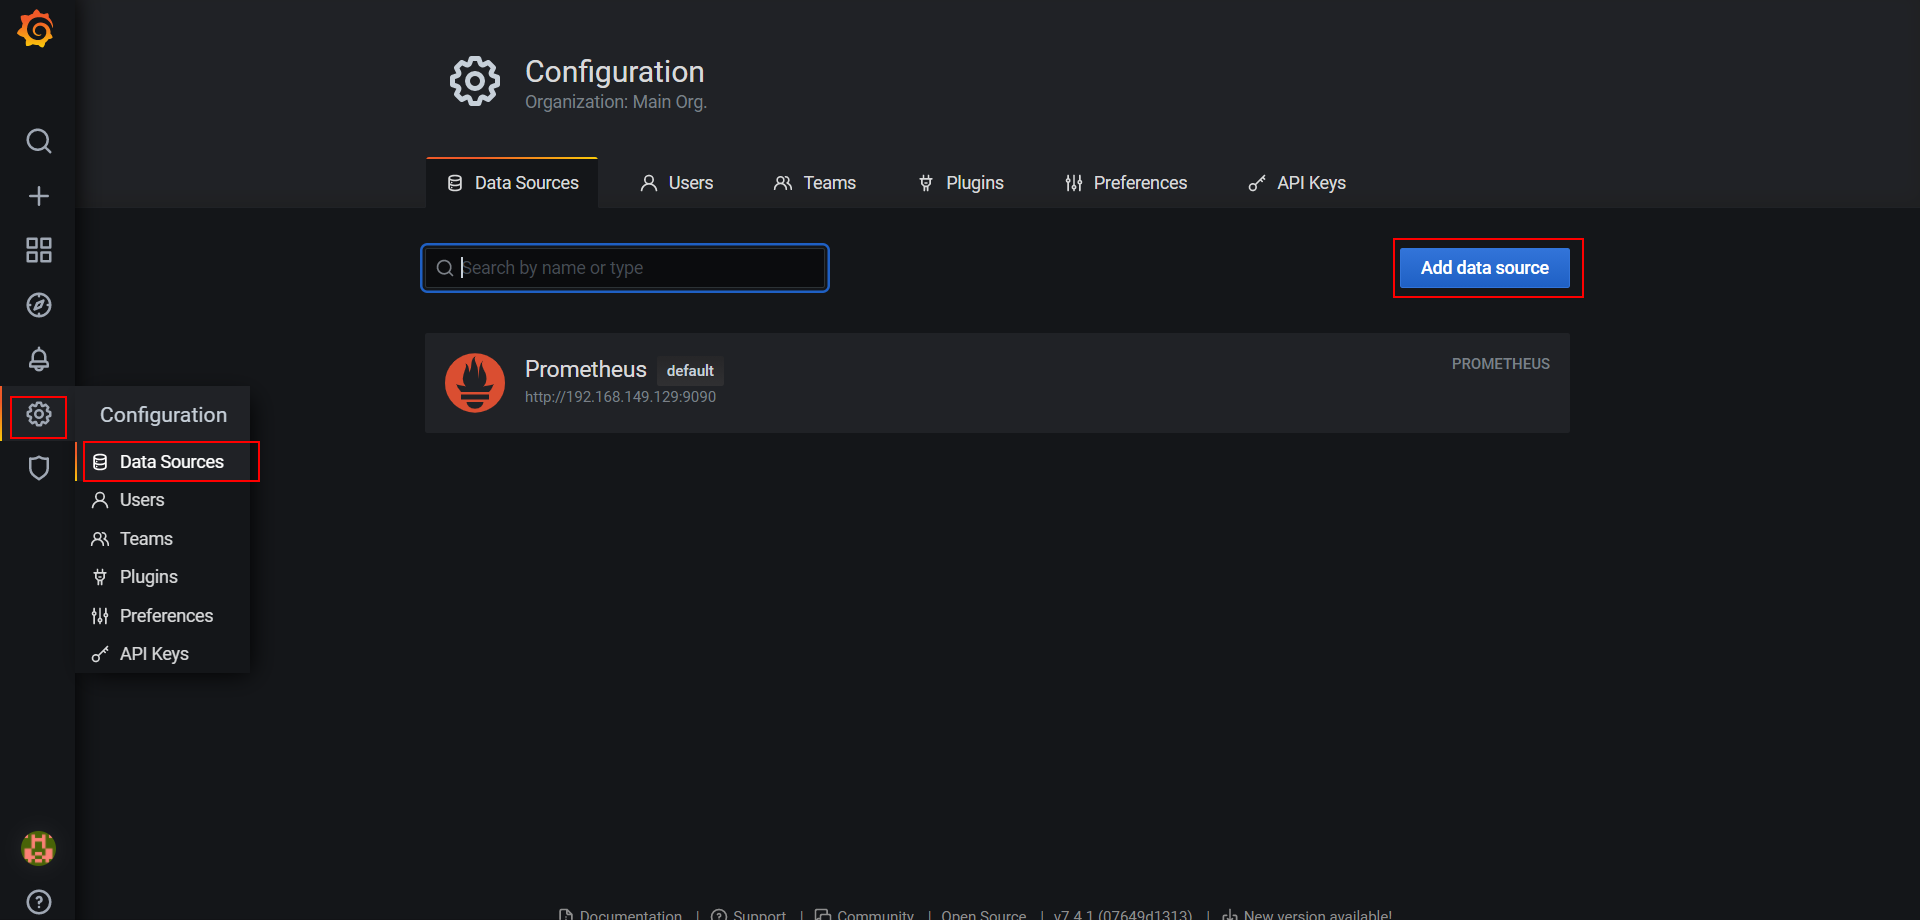
啟動您的grafana服務器。用您的管理員用戶登錄(默認為admin / admin)。打開側面菜單(單擊頂部菜單中的Grafana圖標),轉到數據源,然后添加數據源。
```
### 添加Prometheus的數據源。
第一步:添加數據源
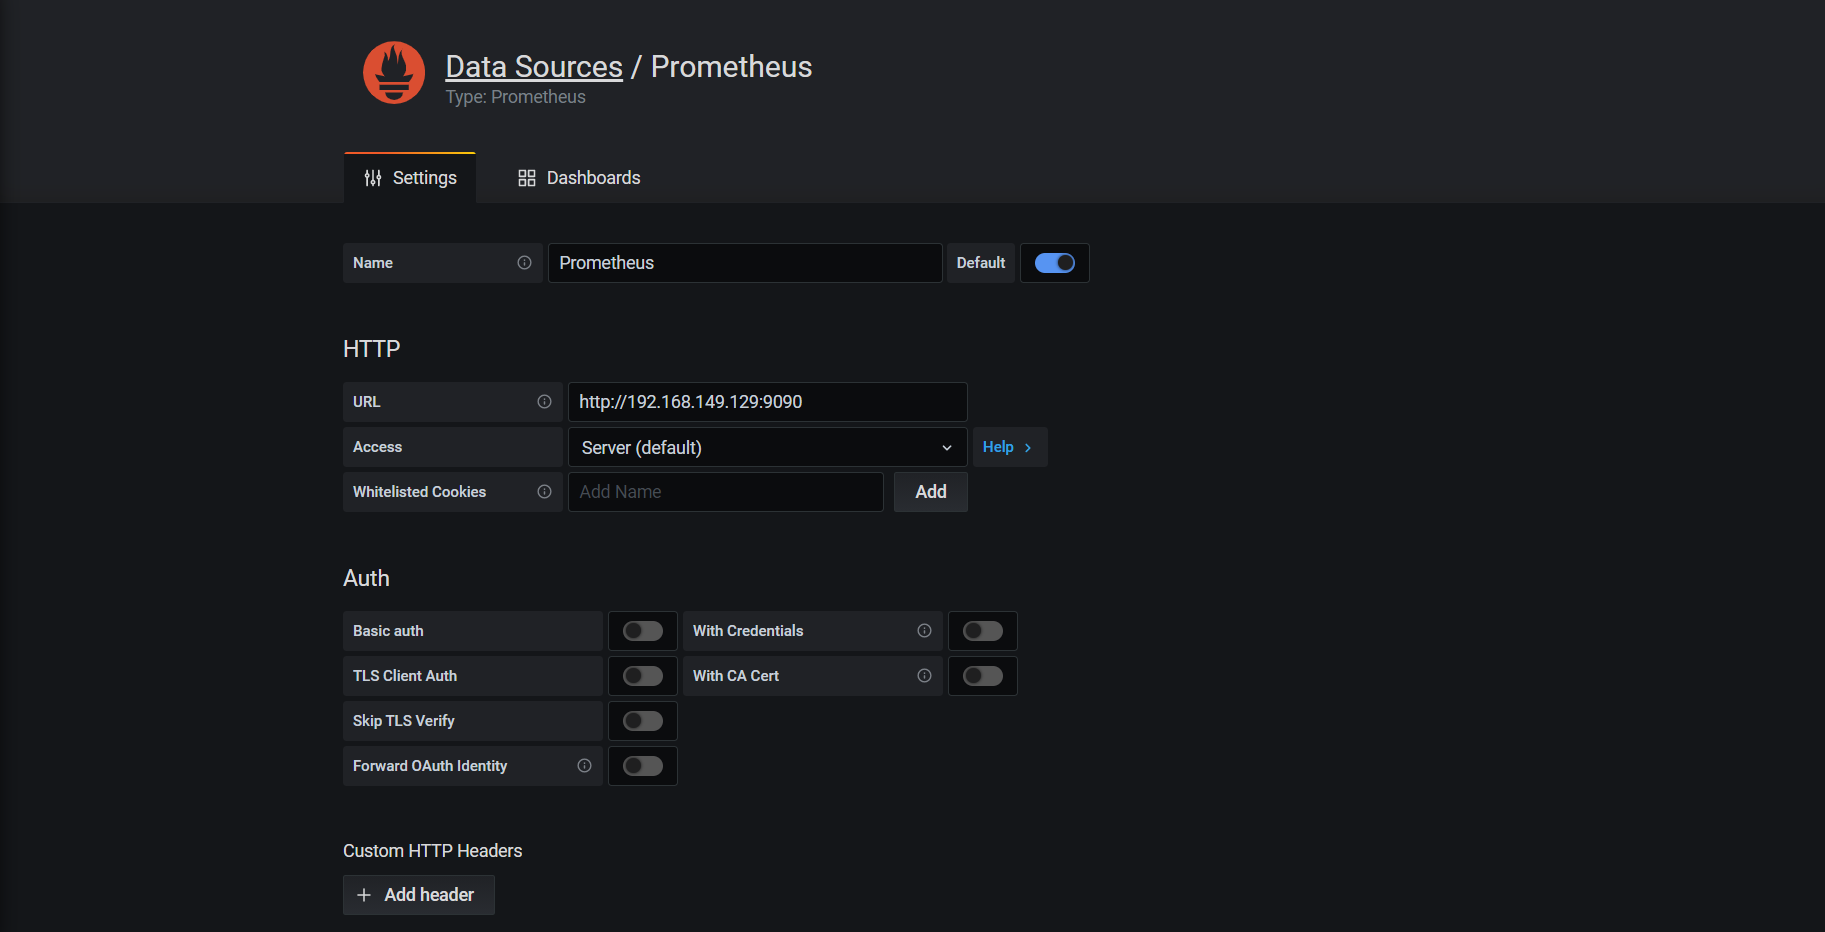
第二步:設置數據源、數據源名稱、類型、IP地址、端口號…
在grafana中導入相關json文件
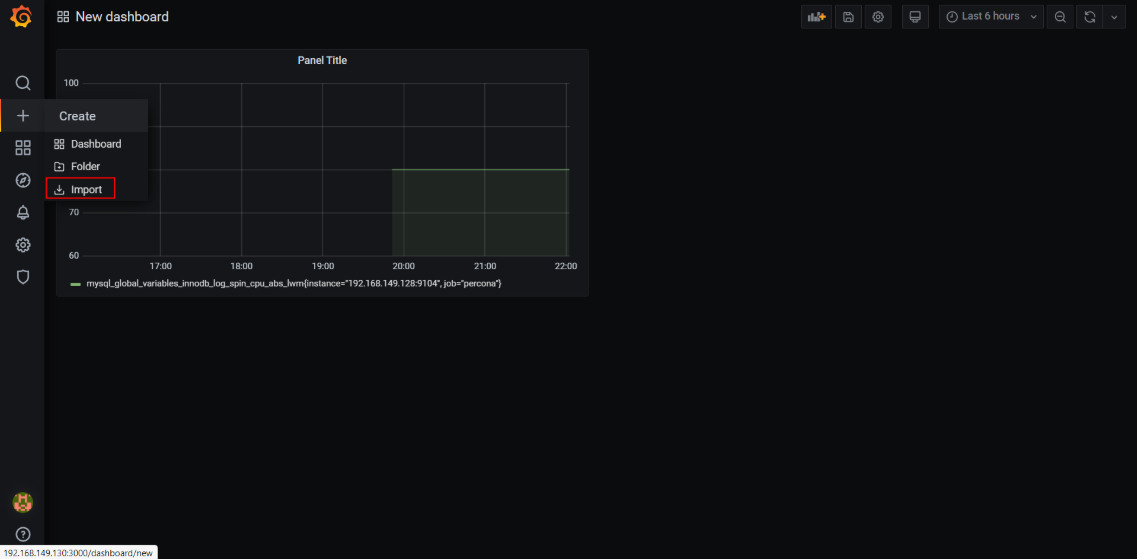
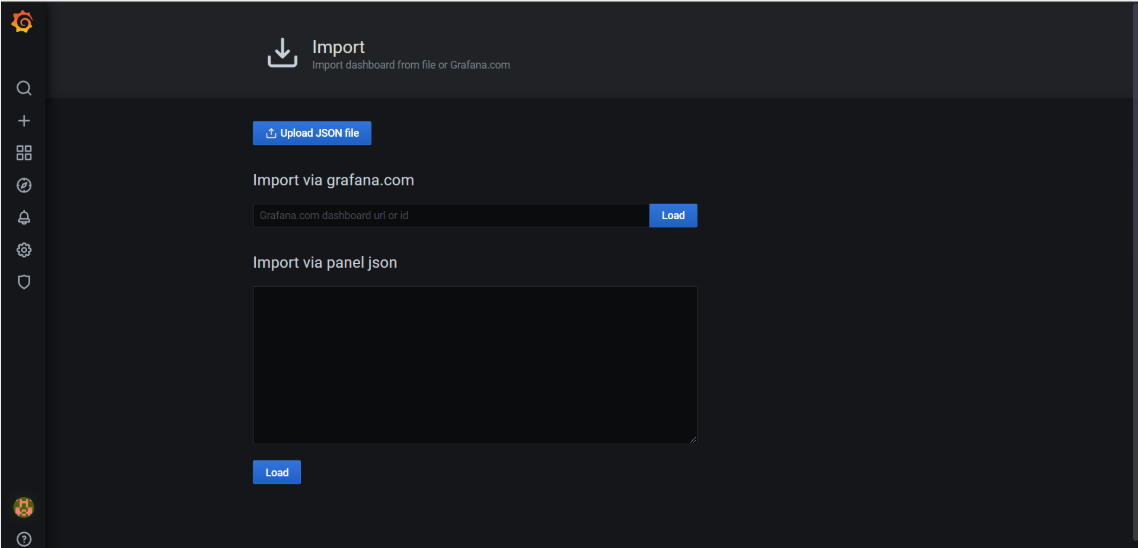
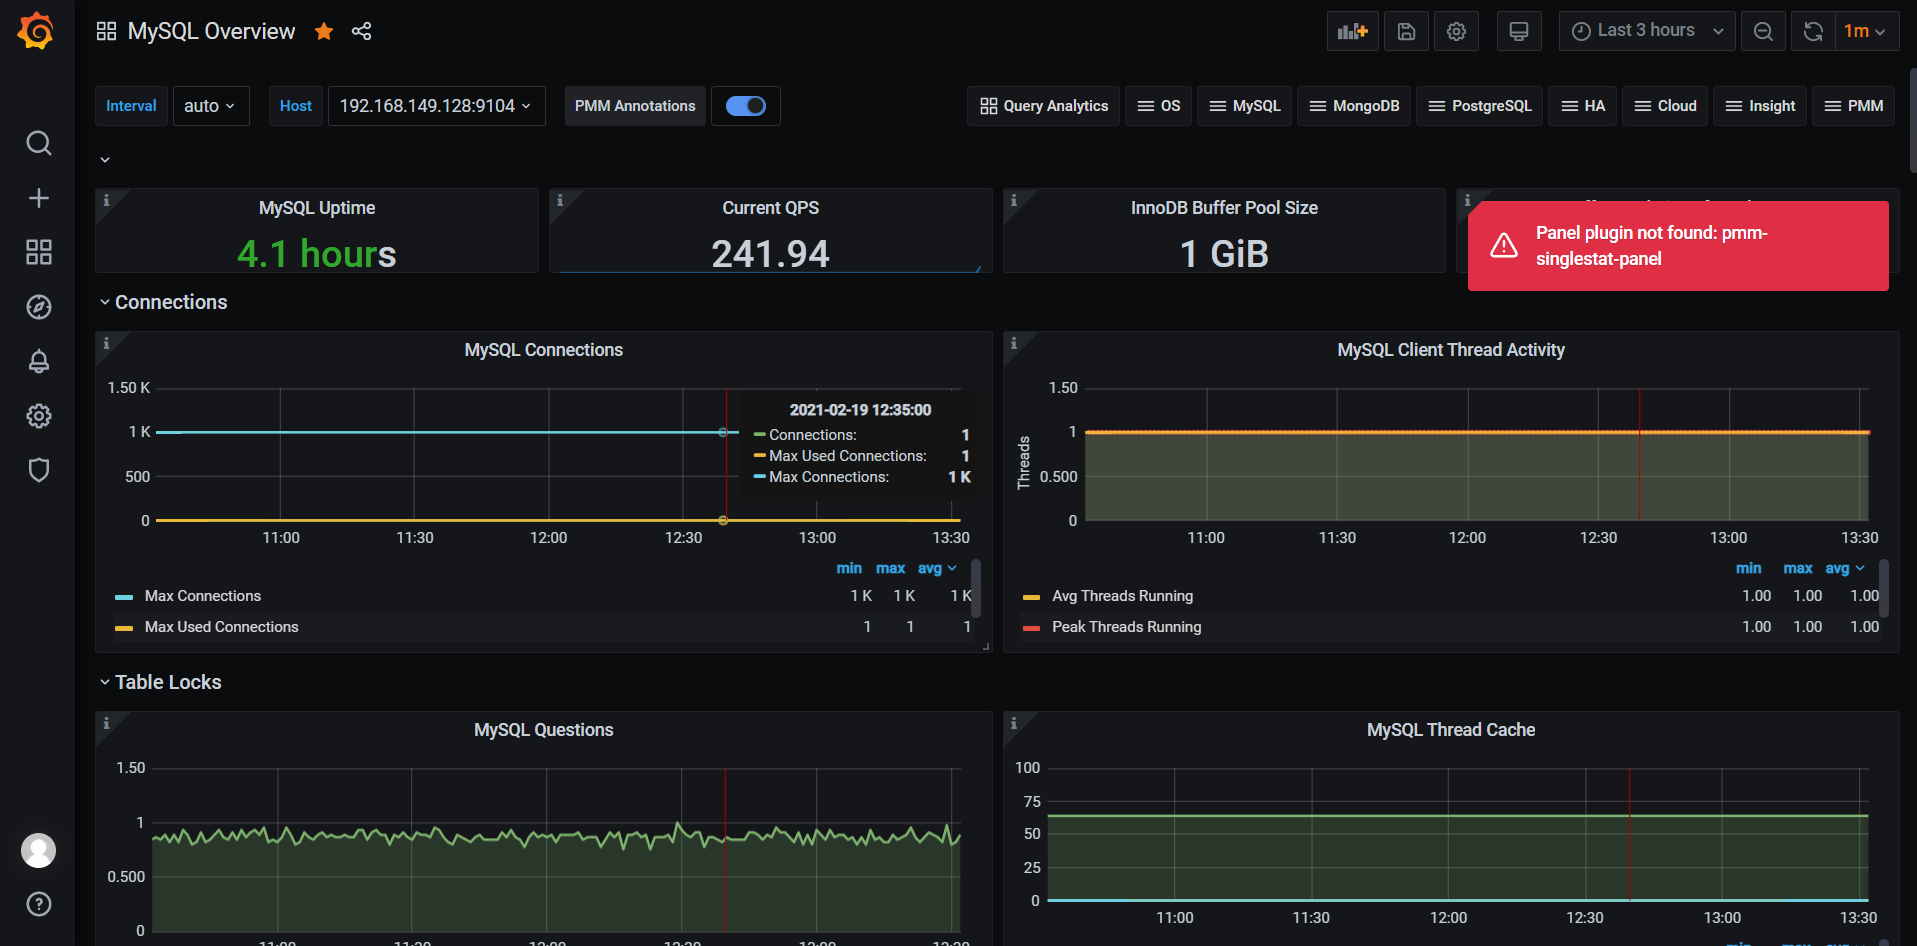
導入的是MySQL\_Overview.json
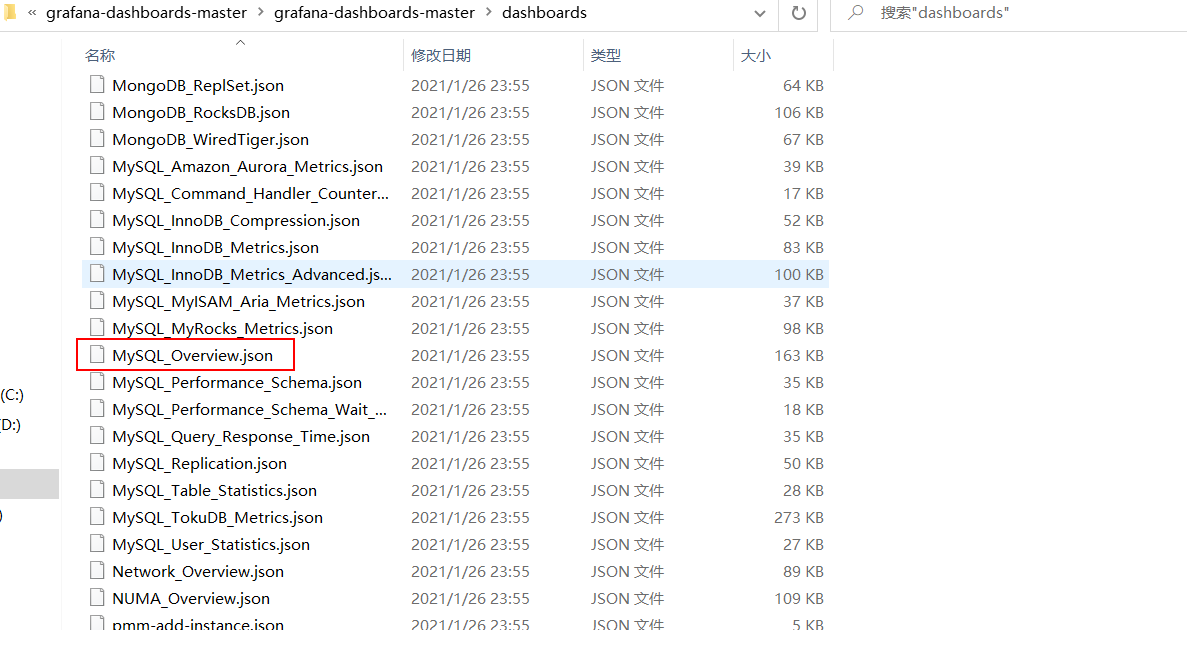
其他的json文件導入也是類似的。
**界面展示:**