
[TOC]
### 通過Logstash解析日志
上面的示例中你已經創建了一個最基本的Logstash管道來測試你的Logstash,在實際的情形中,Logstash通常面臨著更加復雜的場景:一個或多個input、filter和output插件。
本段,你將創建一個Logstash管道,使用Filebeat采集的Apache日志作為input,從日志中解析特殊字段,然后將解析后的數據寫入一個Elasticsearch集群。這次你將定義一個配置文件,而不是在命令行中設定。
在[這里](https://download.elastic.co/demos/logstash/gettingstarted/logstash-tutorial.log.gz)下載示例數據,以便我們可以開始。
#### 配置Filebeat來發送日志到Logstash
在創建Logstash管道之前,你需要配置Filebeat來將日志發送到Logstash。Filebeat是一個輕量的、友好的日志收集客戶端,它從你服務器上的文件中收集日志,并轉發到Logstash以進行實時處理。Filebeat是為可靠性和低延遲設計的。Filebeat可以在你的主機上占用更少的資源,使用`Beats input`插件將讓你的Logstash實例的資源使用降到最低。
> <font color=#DC143C size=4>NOTE</font>:在一個典型的使用場景中,Filebeat運行在和Logstash不同的單獨的主機上,在這個演示的實例中我們將Logstash和Filebeat運行在同一臺主機上。
默認情況下Logstash會安裝`Beats input`插件。Beats input插件允許Logstash接收來自Elastic Beats框架的事件,這意味著任何基于Beats框架的Beat written如Packetbeat和Metricbeta都可以給Logstash發送事件。
要在你的數據源主機上安裝適合的Filebeat,可以在[這里](https://www.elastic.co/downloads/beats/filebeat)下載。你也可以在[這里](https://www.elastic.co/guide/en/beats/filebeat/6.4/filebeat-getting-started.html)查看Beats的安裝文檔。
安裝完成之后你需要進行一些配置。在你的安裝目錄中找到并打開`filebeat.yml`文件,然后使用下面的內容替換其中的內容。確保`paths`指向下載的測試用的Apache日志文件`logstash-tutorial.log`。
```yaml
filebeat.prospectors:
- type: log
paths:
- /path/to/file/logstash-tutorial.log ①
output.logstash:
hosts: ["localhost:5044"]
```
① 文件或目錄的絕對路徑。(原文:Absolute path to the file or files that Filebeat processes.)
保存更改。
為了更加簡單,這里不用配置TLS/SSL。在生產中,通常需要配置這些。
在數據源的主機上執行下面的命令來運行Filebeat:
```shell
sudo ./filebeat -e -c filebeat.yml -d "publish"
```
> <font color=#DC143C size=4>NOTE</font>:如果你以root的身份運行Filebeat,你需要更改配置文件的所有權.(參考:[Config File OwnerShip and Permissions](https://www.elastic.co/guide/en/beats/libbeat/6.4/config-file-permissions.html))。
Filebeat使用5044進行連接,在Logstash啟動Beats插件之前,Filebeat不會收到任何響應,所以此時你看到的任何連接此端口失敗的消息都是正常的。
#### 配置Logstash使用Filebeat作為輸入
接下來,你將創建一個Logstash管道使用Beats input插件接收來自Beats的事件。
下面是一個配置文件的框架:
```json
# The # character at the beginning of a line indicates a comment. Use
# comments to describe your configuration.
input {
}
# The filter part of this file is commented out to indicate that it is
# optional.
# filter {
#
# }
output {
}
```
這個框架沒有任何功能,因為在input 和 output 沒有定義任何選項。
在Logstash的home目錄下創建一個文件,名為`first-pipeline.conf`,將上述內容復制進去。(Logstash的home目錄應該是指Logstash安裝目錄。)
接下來,在`first-pipeline.conf`文件中的`input`配置段添加以下內容來使用Beats input 插件:
```json
beats {
port => "5044"
}
```
你可以稍后配置Elasticsearch。現在,將下面的內容填入到配置文件中的`output`配置段。其作用是在你運行Logstash的時候將輸出結果輸出到stdout。
```json
stdout { codec => rubydebug }
```
完成之后`first-pipeline.conf`的內容應該如下:
```json
input {
beats {
port => "5044"
}
}
# The filter part of this file is commented out to indicate that it is
# optional.
# filter {
#
# }
output {
stdout { codec => rubydebug }
}
```
你可以使用下面的命令來檢查你的配置文件:
```shell
bin/logstash -f first-pipeline.conf --config.test_and_exit
```
`--config.test_and_exit`選項會分析你的配置文件并將其中的錯誤輸出。
如果配置文件通過了檢查,你可以使用下面的命令來啟動Logstash:
```shell
bin/logstash -f first-pipeline.conf --config.reload.automatic
```
`--config.reload.automatic`選項可以讓Logstash在你修改配置文件之后重載而不必重新啟動。
當Logstash啟動之后,你可能會看到一到多條關于忽略`pipelines.yml`文件的警告信息。你可以忽略這些警告。`pipelines.yml`文件是用來在一個Logstash示例中運行[多個管道](https://www.elastic.co/guide/en/logstash/current/multiple-pipelines.html)使用的。在這個演示的示例中,你只運行一個管道。
如果運行正確你應該能在屏幕上看到如下的輸出信息:
```json
{
"@timestamp" => 2017-11-09T01:44:20.071Z,
"offset" => 325,
"@version" => "1",
"beat" => {
"name" => "My-MacBook-Pro.local",
"hostname" => "My-MacBook-Pro.local",
"version" => "6.0.0"
},
"host" => "My-MacBook-Pro.local",
"prospector" => {
"type" => "log"
},
"source" => "/path/to/file/logstash-tutorial.log",
"message" => "83.149.9.216 - - [04/Jan/2015:05:13:42 +0000] \"GET /presentations/logstash-monitorama-2013/images/kibana-search.png HTTP/1.1\" 200 203023 \"http://semicomplete.com/presentations/logstash-monitorama-2013/\" \"Mozilla/5.0 (Macintosh; Intel Mac OS X 10_9_1) AppleWebKit/537.36 (KHTML, like Gecko) Chrome/32.0.1700.77 Safari/537.36\"",
"tags" => [
[0] "beats_input_codec_plain_applied"
]
}
...
```
#### 使用Grok Filter插件解析Web Logs
現在你已經有了一個正常工作的從Filebeat讀取日志的管道。但是,你知道日志的格式并不理想。你希望解析這些日志文件中的特殊字段。為了實現這個,你需要用到`grok` filter插件。
[Grok](http://www.elastic.co/guide/en/logstash/6.4/plugins-filters-grok.html) filter插件是少數Logstash默認可以使用的插件之一。更多關于管理Logstash插件的信息,參考[reference documentation](https://www.elastic.co/guide/en/logstash/current/working-with-plugins.html)。
`Grok`插件可以將非結構化的數據轉換為高質量的結構化數據。
由于`grok`插件從傳入的日志中進行匹配查找,所以需要你根據自己感興趣的數據來配置插件。如典型的Web服務日志如下:
```text
83.149.9.216 - - [04/Jan/2015:05:13:42 +0000] "GET /presentations/logstash-monitorama-2013/images/kibana-search.png
HTTP/1.1" 200 203023 "http://semicomplete.com/presentations/logstash-monitorama-2013/" "Mozilla/5.0 (Macintosh; Intel
Mac OS X 10_9_1) AppleWebKit/537.36 (KHTML, like Gecko) Chrome/32.0.1700.77 Safari/537.36"
```
很容易辨認出最開始的是IP地址,方括號中的是時間標簽。對于Apache日志你可以使用`%{COMBINEDAPACHELOG}`來將數據解析成如下結構。
| Information | Field Name |
| :------------------ | ------------- |
| IP Address | `clientip` |
| User ID | `ident` |
| User Authentication | `auth` |
| timestamp | `timestamp` |
| HTTP Verb | `verb` |
| Request body | `request` |
| HTTP Version | `httpversion` |
| HTTP Status Code | `response` |
| Bytes served | `bytes` |
| Referrer URL | `referrer` |
| User agent | `agent` |
> <font color=#1E90FF size=4>TIP</font>:如果在構建Grok匹配模式上需要幫助,你可以使用[Grok Debugger](https://www.elastic.co/guide/en/kibana/6.4/xpack-grokdebugger.html)。Grok Debugger是基本許可下的X-Pack的一個附加特性,可以免費使用。
編輯`first-pipeline.conf`文件并使用下面的內容替換其中的`filter`字段:
```json
filter {
grok {
match => { "message" => "%{COMBINEDAPACHELOG}"}
}
}
```
完成之后`first-pipeline.conf`中的內容應該如下:
```json
input {
beats {
port => "5044"
}
}
filter {
grok {
match => { "message" => "%{COMBINEDAPACHELOG}"}
}
}
output {
stdout { codec => rubydebug }
}
```
保存更改,由于已經開啟了自動重載配置文件,因此你不必重新啟動Logstash來使配置生效。但是你需要讓Filebeat強制從頭開始讀取日志文件。在對應的終端上使用Ctrl+C組合鍵來關閉Filebeat。然后刪除Filebeat的registry文件,命令如下:
```shell
sudo rm data/registry
```
Filebeat的registry文件保存了它讀取的文件的狀態,刪除之后可以強制讓Filebeat重新從頭讀取這些文件。
然后使用下面的命令重啟Filebeat:
```shell
sudo ./filebeat -e -c filebeat.yml -d "publish"
```
你可能需要等待一小會兒如果Filebeat等待Logstash重讀配置文件的話。
在Logstash完成重讀并匹配完成之后,事件將用JSON的格式表示如下:
```json
{
"request" => "/presentations/logstash-monitorama-2013/images/kibana-search.png",
"agent" => "\"Mozilla/5.0 (Macintosh; Intel Mac OS X 10_9_1) AppleWebKit/537.36 (KHTML, like Gecko) Chrome/32.0.1700.77 Safari/537.36\"",
"offset" => 325,
"auth" => "-",
"ident" => "-",
"verb" => "GET",
"prospector" => {
"type" => "log"
},
"source" => "/path/to/file/logstash-tutorial.log",
"message" => "83.149.9.216 - - [04/Jan/2015:05:13:42 +0000] \"GET /presentations/logstash-monitorama-2013/images/kibana-search.png HTTP/1.1\" 200 203023 \"http://semicomplete.com/presentations/logstash-monitorama-2013/\" \"Mozilla/5.0 (Macintosh; Intel Mac OS X 10_9_1) AppleWebKit/537.36 (KHTML, like Gecko) Chrome/32.0.1700.77 Safari/537.36\"",
"tags" => [
[0] "beats_input_codec_plain_applied"
],
"referrer" => "\"http://semicomplete.com/presentations/logstash-monitorama-2013/\"",
"@timestamp" => 2017-11-09T02:51:12.416Z,
"response" => "200",
"bytes" => "203023",
"clientip" => "83.149.9.216",
"@version" => "1",
"beat" => {
"name" => "My-MacBook-Pro.local",
"hostname" => "My-MacBook-Pro.local",
"version" => "6.0.0"
},
"host" => "My-MacBook-Pro.local",
"httpversion" => "1.1",
"timestamp" => "04/Jan/2015:05:13:42 +0000"
}
```
需要注意的是原本的消息內容會被保留,但消息同時也會被分割成不同的字段。
#### 使用GeoIP插件豐富你的數據
除了解析日志以便于搜索,filter插件還可以從現有的數據中進行擴展。舉個例子,`geoip`插件可以從IP地址獲取物理位置信息并將其添加到日志中。
在`first-pipeline.conf`文件的`filter`字段中添加以下內容來使用`geoip`filter插件:
```json
geoip {
source => "clientip"
}
```
`geoip`插件的配置需要你指定包含要查找的IP地址的源字段的名稱。在示例中,`clientip`字段包含IP地址。
因為filter是按照順序進行解析,所以配置文件中的`geoip`字段要在`grok`字段之后且這兩個字段都要在`filter`字段中
當你做完之后,`first-pipeline.conf`文件中的內容應該如下:
```json
input {
beats {
port => "5044"
}
}
filter {
grok {
match => { "message" => "%{COMBINEDAPACHELOG}"}
}
geoip {
source => "clientip"
}
}
output {
stdout { codec => rubydebug }
}
```
保存設置,和之前一樣強制停止Filebeat然后刪除registry文件,然后使用下面的命令重啟Filebeat:
```shell
sudo ./filebeat -e -c filebeat.yml -d "publish"
```
注意事件中現在已經包含了物理位置信息:
```json
{
"request" => "/presentations/logstash-monitorama-2013/images/kibana-search.png",
"agent" => "\"Mozilla/5.0 (Macintosh; Intel Mac OS X 10_9_1) AppleWebKit/537.36 (KHTML, like Gecko) Chrome/32.0.1700.77 Safari/537.36\"",
"geoip" => {
"timezone" => "Europe/Moscow",
"ip" => "83.149.9.216",
"latitude" => 55.7485,
"continent_code" => "EU",
"city_name" => "Moscow",
"country_name" => "Russia",
"country_code2" => "RU",
"country_code3" => "RU",
"region_name" => "Moscow",
"location" => {
"lon" => 37.6184,
"lat" => 55.7485
},
"postal_code" => "101194",
"region_code" => "MOW",
"longitude" => 37.6184
},
...
```
#### 將你的數據索引到Elasticsearch
現在web日志已經按照字段進行分割,你已經準備好將數據寫入Elasticsearch。
> <font color=#1E90FF size=4>TIP</font>:你可以在你自己的硬件上運行Elasticsearch,也可以使用我們的Elastic云上的[Elasticsearch主機服務](https://www.elastic.co/cloud/elasticsearch-service)。AWS和GCP都提供了Elasticsearch服務。[免費試用一下](https://www.elastic.co/cloud/elasticsearch-service/signup)。
Logstash可以將數據索引到Elasticsearch集群。編輯`first-pipeline.conf`文件中的`output`字段,內容如下:
```json
output {
elasticsearch {
hosts => [ "localhost:9200" ]
}
}
```
這個配置中,Logstash使用HTTP協議連接Elasticsearch。上面的示例中Logstash和Elasticsearch運行在相同 的實例中。你也可以指定一個遠程Elasticsearch實例通過配置`hosts`如:`hosts => ["es-machine:9200"]`。
到這里,你的`first-pipeline.conf`包含input,filter,和output配置,沒問題的話,應該是下面這樣:
```json
input {
beats {
port => "5044"
}
}
filter {
grok {
match => { "message" => "%{COMBINEDAPACHELOG}"}
}
geoip {
source => "clientip"
}
}
output {
elasticsearch {
hosts => [ "localhost:9200" ]
}
}
```
保存配置,像之前一樣強制中止Filebeat,刪除registry文件,然后使用下面的命令重啟Filebeat:
```shell
sudo ./filebeat -e -c filebeat.yml -d "publish"
```
#### 測試你的管道
現在你的Logstash已經將數據存儲到Elasticsearch集群中,你可以在Elasticsearch集群中進行查詢。
嘗試在Elasticsearch中查詢`grok`filter插件創建的字段。用YYYY.MM.DD格式的當前時間替換下面的$DATE:
```shell
curl -XGET 'localhost:9200/logstash-$DATE/_search?pretty&q=response=200'
```
> <font color=#DC143C size=4>NOTE</font>:數據使用的索引名稱基于UTC時間,并非Logstash運行的當地時間。如果查詢返回`index_not_found_exception`,確保`logstash-$DATE`對應的名字是正確的索引名。可以使用這個查詢指令來查看所有可用的索引:`curl 'localhost:9200/_cat/indices?v'`
應該會返回多個命中結果。如下:
```json
{
"took": 50,
"timed_out": false,
"_shards": {
"total": 5,
"successful": 5,
"skipped": 0,
"failed": 0
},
"hits": {
"total": 98,
"max_score": 2.793642,
"hits": [
{
"_index": "logstash-2017.11.09",
"_type": "doc",
"_id": "3IzDnl8BW52sR0fx5wdV",
"_score": 2.793642,
"_source": {
"request": "/presentations/logstash-monitorama-2013/images/frontend-response-codes.png",
"agent": """"Mozilla/5.0 (Macintosh; Intel Mac OS X 10_9_1) AppleWebKit/537.36 (KHTML, like Gecko) Chrome/32.0.1700.77 Safari/537.36"""",
"geoip": {
"timezone": "Europe/Moscow",
"ip": "83.149.9.216",
"latitude": 55.7485,
"continent_code": "EU",
"city_name": "Moscow",
"country_name": "Russia",
"country_code2": "RU",
"country_code3": "RU",
"region_name": "Moscow",
"location": {
"lon": 37.6184,
"lat": 55.7485
},
"postal_code": "101194",
"region_code": "MOW",
"longitude": 37.6184
},
"offset": 2932,
"auth": "-",
"ident": "-",
"verb": "GET",
"prospector": {
"type": "log"
},
"source": "/path/to/file/logstash-tutorial.log",
"message": """83.149.9.216 - - [04/Jan/2015:05:13:45 +0000] "GET /presentations/logstash-monitorama-2013/images/frontend-response-codes.png HTTP/1.1" 200 52878 "http://semicomplete.com/presentations/logstash-monitorama-2013/" "Mozilla/5.0 (Macintosh; Intel Mac OS X 10_9_1) AppleWebKit/537.36 (KHTML, like Gecko) Chrome/32.0.1700.77 Safari/537.36"""",
"tags": [
"beats_input_codec_plain_applied"
],
"referrer": """"http://semicomplete.com/presentations/logstash-monitorama-2013/"""",
"@timestamp": "2017-11-09T03:11:35.304Z",
"response": "200",
"bytes": "52878",
"clientip": "83.149.9.216",
"@version": "1",
"beat": {
"name": "My-MacBook-Pro.local",
"hostname": "My-MacBook-Pro.local",
"version": "6.0.0"
},
"host": "My-MacBook-Pro.local",
"httpversion": "1.1",
"timestamp": "04/Jan/2015:05:13:45 +0000"
}
},
...
```
嘗試使用從IP地址派生出的地理信息來查詢。使用當前時間替換$DATE,用YYYY.MM.DD格式的時間:
```shell
curl -XGET 'localhost:9200/logstash-$DATE/_search?pretty&q=geoip.city_name=Buffalo'
```
有些日志來自Buffalo,所以應該會返回下面的結果:
```json
{
"took": 9,
"timed_out": false,
"_shards": {
"total": 5,
"successful": 5,
"skipped": 0,
"failed": 0
},
"hits": {
"total": 2,
"max_score": 2.6390574,
"hits": [
{
"_index": "logstash-2017.11.09",
"_type": "doc",
"_id": "L4zDnl8BW52sR0fx5whY",
"_score": 2.6390574,
"_source": {
"request": "/blog/geekery/disabling-battery-in-ubuntu-vms.html?utm_source=feedburner&utm_medium=feed&utm_campaign=Feed%3A+semicomplete%2Fmain+%28semicomplete.com+-+Jordan+Sissel%29",
"agent": """"Tiny Tiny RSS/1.11 (http://tt-rss.org/)"""",
"geoip": {
"timezone": "America/New_York",
"ip": "198.46.149.143",
"latitude": 42.8864,
"continent_code": "NA",
"city_name": "Buffalo",
"country_name": "United States",
"country_code2": "US",
"dma_code": 514,
"country_code3": "US",
"region_name": "New York",
"location": {
"lon": -78.8781,
"lat": 42.8864
},
"postal_code": "14202",
"region_code": "NY",
"longitude": -78.8781
},
"offset": 22795,
"auth": "-",
"ident": "-",
"verb": "GET",
"prospector": {
"type": "log"
},
"source": "/path/to/file/logstash-tutorial.log",
"message": """198.46.149.143 - - [04/Jan/2015:05:29:13 +0000] "GET /blog/geekery/disabling-battery-in-ubuntu-vms.html?utm_source=feedburner&utm_medium=feed&utm_campaign=Feed%3A+semicomplete%2Fmain+%28semicomplete.com+-+Jordan+Sissel%29 HTTP/1.1" 200 9316 "-" "Tiny Tiny RSS/1.11 (http://tt-rss.org/)"""",
"tags": [
"beats_input_codec_plain_applied"
],
"referrer": """"-"""",
"@timestamp": "2017-11-09T03:11:35.321Z",
"response": "200",
"bytes": "9316",
"clientip": "198.46.149.143",
"@version": "1",
"beat": {
"name": "My-MacBook-Pro.local",
"hostname": "My-MacBook-Pro.local",
"version": "6.0.0"
},
"host": "My-MacBook-Pro.local",
"httpversion": "1.1",
"timestamp": "04/Jan/2015:05:29:13 +0000"
}
},
...
```
如果你使用Kibana來可視化你的數據,你可以在Kibana中查看你通過Filebeat獲取的數據:
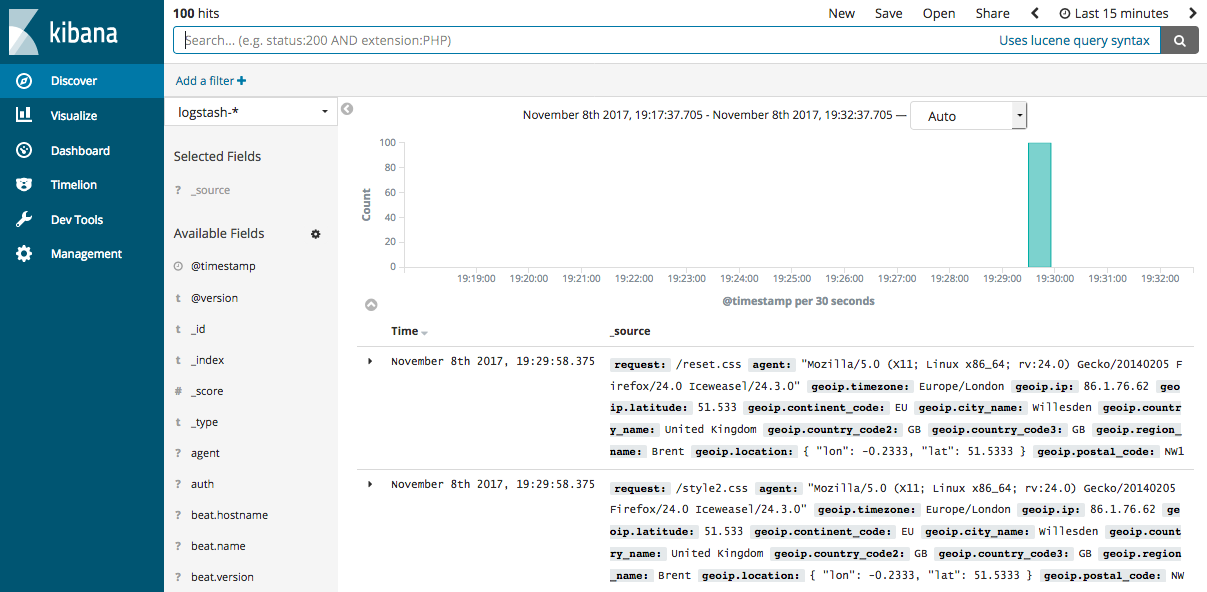
查看[Filebeat getting started docs](https://www.elastic.co/guide/en/beats/filebeat/6.4/filebeat-getting-started.html)獲取關于在Kibana中加載Filebeat索引的信息。
你已經成功的創建了一個Logstash管道,通過Filebeat采集Apache日志作為input,分析其中的特殊字段,然后將分析后的字段寫入到Elasticsearch集群中。接下來,即將學習如何創建一個管道同時使用多個input和output插件。
- Emmm
- Logstash簡介
- 開始使用Logstash
- 安裝Logstash
- 儲存你的第一個事件
- 通過Logstash解析日志
- 多個輸入和輸出插件的混合使用
- Logstash是如何工作的
- 執行模型Execution Model
- 設置并運行Logstash
- Logstash目錄布局
- Logstash配置文件
- logstash.yml
- Secrets keystore for secure settings
- 從命令行運行Logstash
- 以服務的方式運行Logstash
- 在Docker中運行Logstash
- 配置容器版Logstash
- Logging
- 關閉Logstash
- 安裝X-Pack
- 設置X-Pack
- 升級Logstash
- 使用包管理升級
- 直接下載進行升級
- 升級至6.0
- Upgrading with the Persistent Queue Enabled
- 配置Logstash
- 管道配置文件的結構
- 訪問配置中的事件數據和字段
- 在配置中使用環境變量
- Logstash配置示例
- 多管道
- 管道間通信(beta)
- 重載配置文件
- 管理多行事件
- Glob Pattern Support
- Converting Ingest Node Pipelines
- Logstash間通信
- 配置集中式管道管理
- X-Pack Monitoring
- X-Pack Security
- X-Pack Settings
- Field References Deep Dive(深入字段引用)
- 管理Logstash
- 集中式管道管理
- 使用Logstash模塊
- 使用Elastic Cloud
- Logstash ArcSight模塊