
# Kubernetes集群資源監控
## 概述
### 監控指標
一個好的系統,主要監控以下內容
- 集群監控
- 節點資源利用率
- 節點數
- 運行Pods
- Pod監控
- 容器指標
- 應用程序【程序占用多少CPU、內存】
### 監控平臺
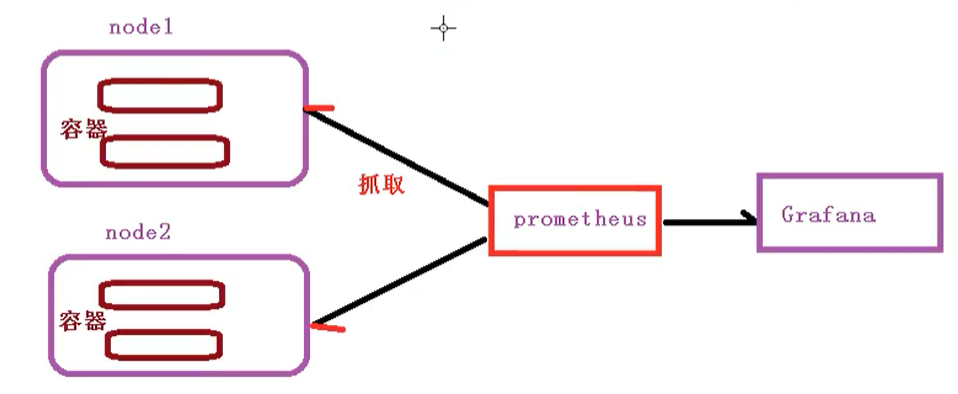
使用普羅米修斯【prometheus】 + Grafana 搭建監控平臺
- prometheus【定時搜索被監控服務的狀態】
- 開源的
- 監控、報警、數據庫
- 以HTTP協議周期性抓取被監控組件狀態
- 不需要復雜的集成過程,使用http接口接入即可
- Grafana
- 開源的數據分析和可視化工具
- 支持多種數據源
## 部署prometheus
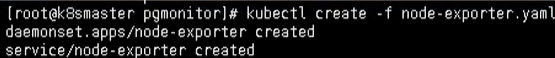
首先需要部署一個守護進程

```bash
---
apiVersion: apps/v1
kind: DaemonSet
metadata:
name: node-exporter
namespace: kube-system
labels:
k8s-app: node-exporter
spec:
selector:
matchLabels:
k8s-app: node-exporter
template:
metadata:
labels:
k8s-app: node-exporter
spec:
containers:
- image: prom/node-exporter
name: node-exporter
ports:
- containerPort: 9100
protocol: TCP
name: http
---
apiVersion: v1
kind: Service
metadata:
labels:
k8s-app: node-exporter
name: node-exporter
namespace: kube-system
spec:
ports:
- name: http
port: 9100
nodePort: 31672
protocol: TCP
type: NodePort
selector:
k8s-app: node-exporter
```
然后執行下面命令
```bash
kubectl create -f node-exporter.yaml
```
執行完,發現會報錯

這是因為版本不一致的問題,因為發布的正式版本,而這個屬于測試版本
所以我們找到第一行,然后把內容修改為如下所示
```bash
# 修改前
apiVersion: extensions/v1beta1
# 修改后 【正式版本發布后,測試版本不能使用】
apiVersion: apps/v1
```
創建完成后的效果
然后通過yaml的方式部署prometheus
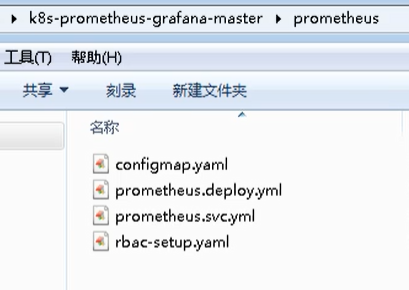
- configmap:定義一個configmap:存儲一些配置文件【不加密】
- prometheus.deploy.yaml:部署一個deployment【包括端口號,資源限制】
- prometheus.svc.yaml:對外暴露的端口
- rbac-setup.yaml:分配一些角色的權限
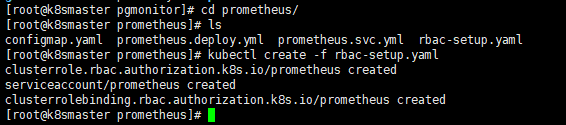
下面我們進入目錄下,首先部署 rbac-setup.yaml
```bash
kubectl create -f rbac-setup.yaml
```
然后分別部署
```bash
# 部署configmap
kubectl create -f configmap.yaml
# 部署deployment
kubectl create -f prometheus.deploy.yml
# 部署svc
kubectl create -f prometheus.svc.yml
```
部署完成后,我們使用下面命令查看
```bash
kubectl get pods -n kube-system
```
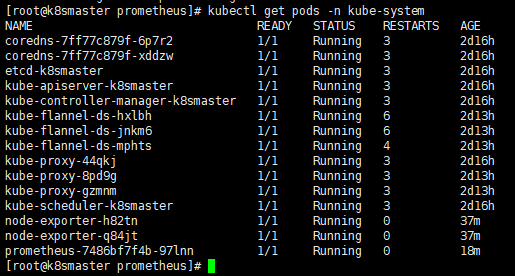
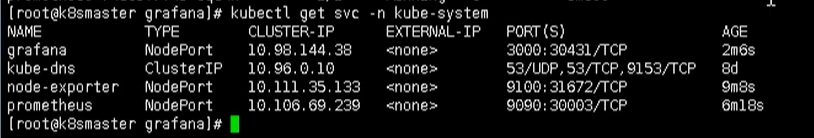
在我們部署完成后,即可看到 prometheus 的 pod了,然后通過下面命令,能夠看到對應的端口
```bash
kubectl get svc -n kube-system
```
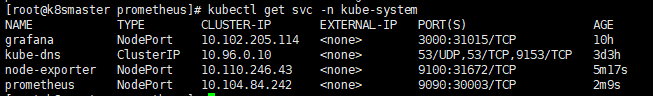
通過這個,我們可以看到 `prometheus` 對外暴露的端口為 30003,訪問頁面即可對應的圖形化界面
```bash
http://192.168.177.130:30003
```
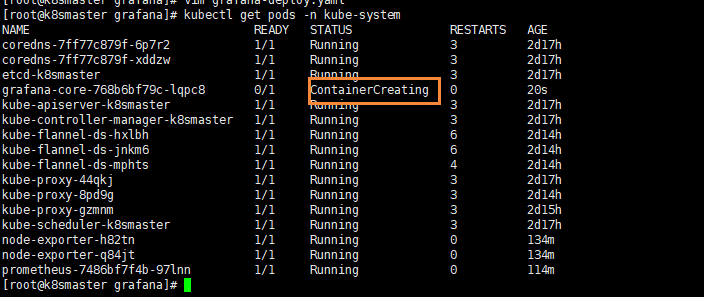
在上面我們部署完prometheus后,我們還需要來部署grafana
```bash
kubectl create -f grafana-deploy.yaml
```
然后執行完后,發現下面的問題
```bash
error: unable to recognize "grafana-deploy.yaml": no matches for kind "Deployment" in version "extensions/v1beta1"
```
我們需要修改如下內容
```bash
# 修改
apiVersion: apps/v1
# 添加selector
spec:
replicas: 1
selector:
matchLabels:
app: grafana
component: core
```
修改完成后,我們繼續執行上述代碼
```bash
# 創建deployment
kubectl create -f grafana-deploy.yaml
# 創建svc
kubectl create -f grafana-svc.yaml
# 創建 ing
kubectl create -f grafana-ing.yaml
```
我們能看到,我們的grafana正在
### 配置數據源
下面我們需要開始打開 Grafana,然后配置數據源,導入數據顯示模板
```bash
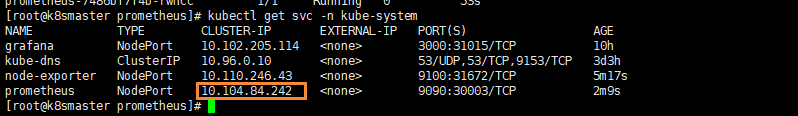
kubectl get svc -n kube-system
```
我們可以通過 ip + 30431 訪問我們的 grafana 圖形化頁面
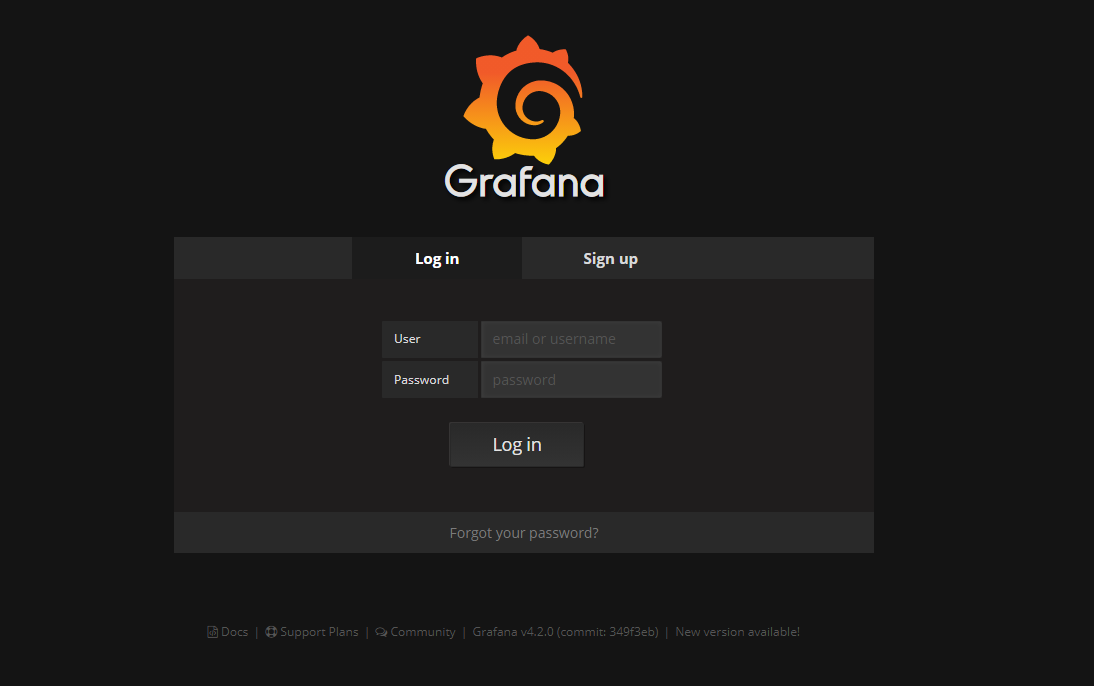
然后輸入賬號和密碼:admin admin
進入后,我們就需要配置 prometheus 的數據源
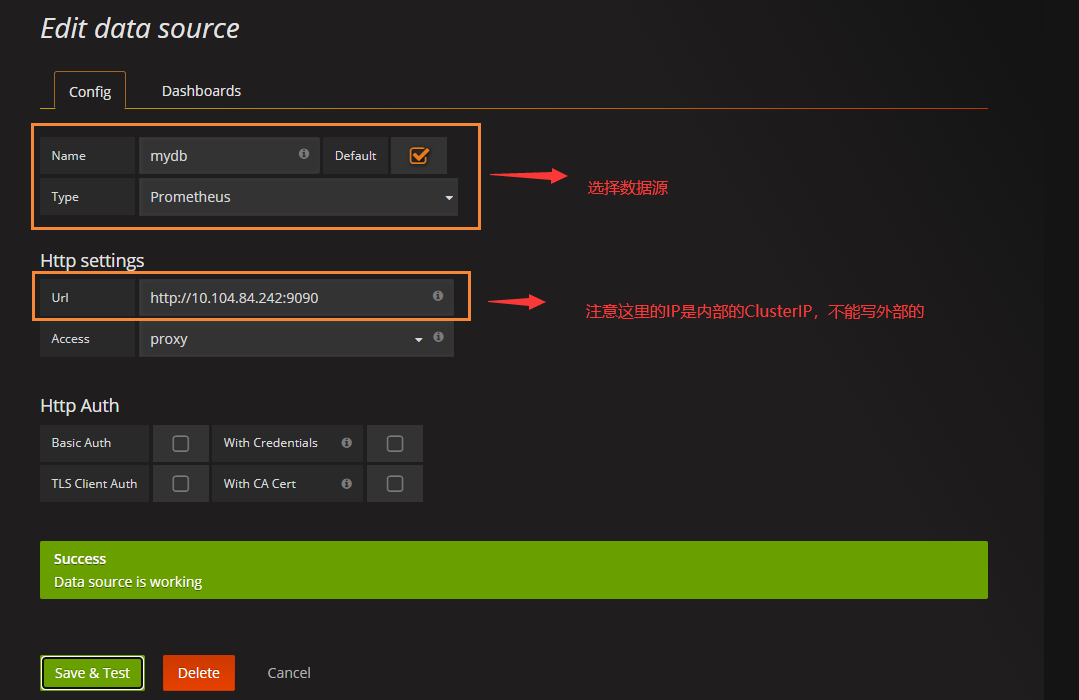
和 對應的IP【這里IP是我們的ClusterIP】
### 設置顯示數據的模板
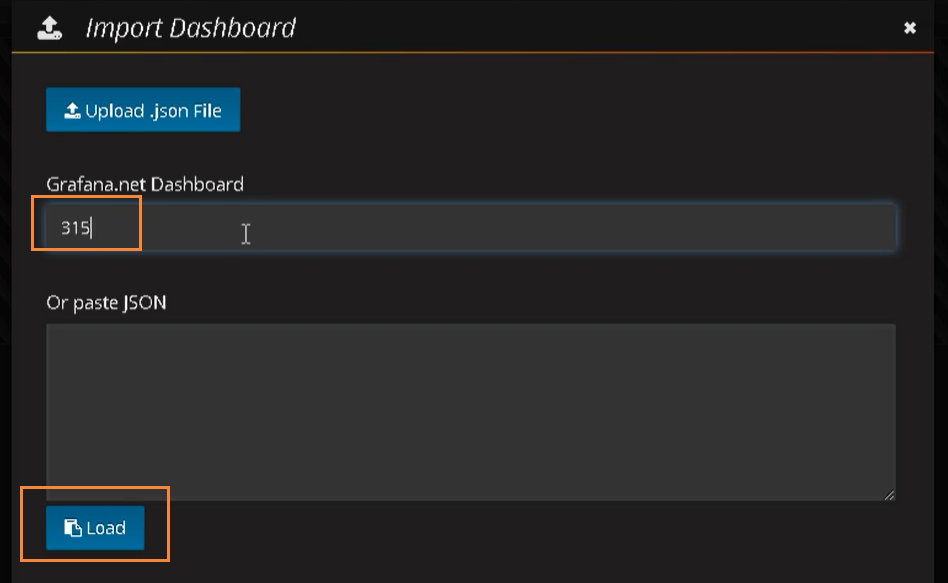
選擇Dashboard,導入我們的模板
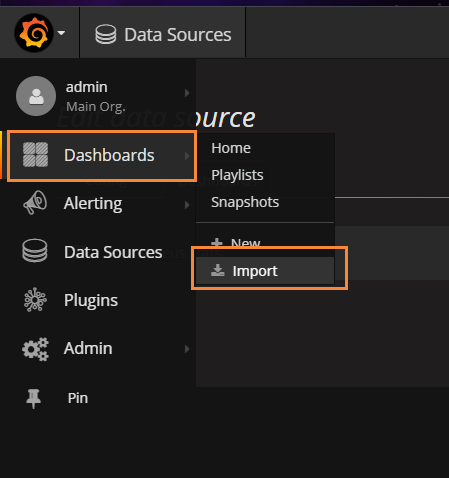
然后輸入 315 號模板
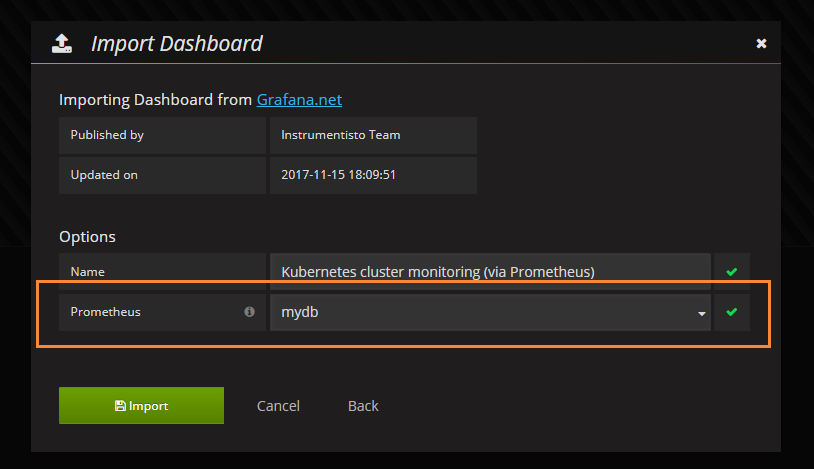
然后選擇 prometheus數據源 mydb,導入即可
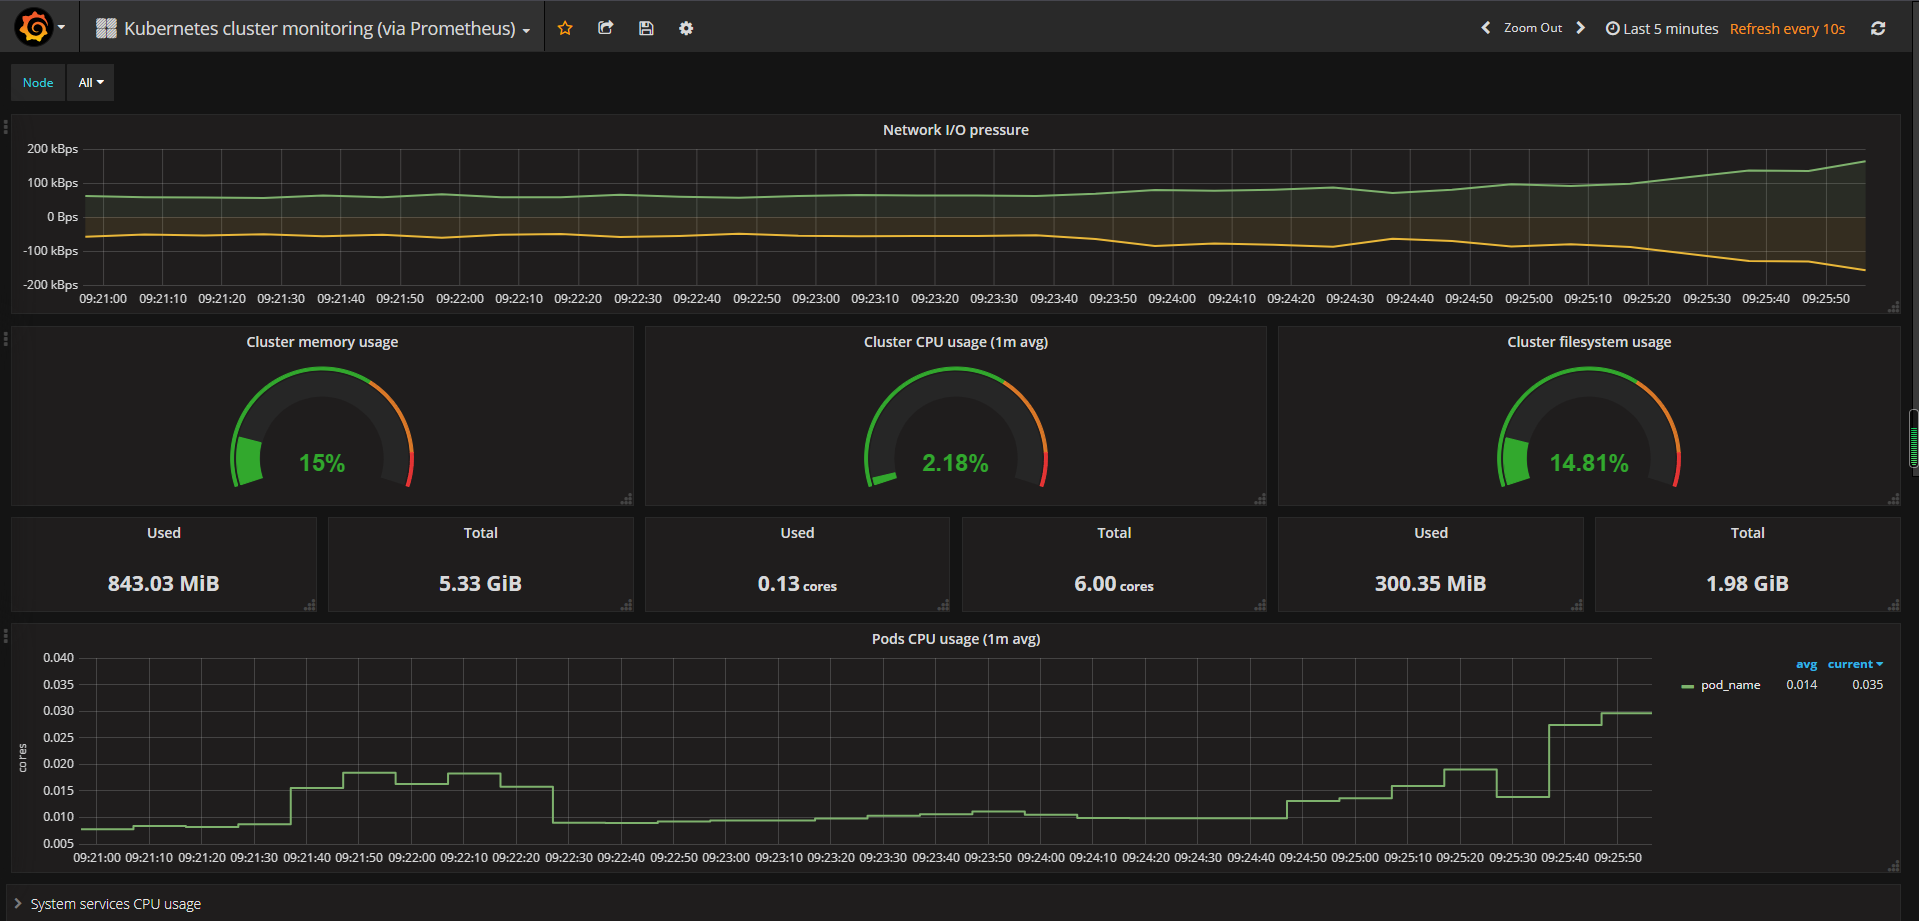
導入后的效果如下所示
- Kubernetes簡介
- 搭建K8S集群前置知識
- 使用kubeadm方式搭建K8S集群
- 使用二進制方式搭建K8S集群
- Kubeadm和二進制方式對比
- Kubernetes集群管理工具kubectl
- Kubernetes集群YAML文件詳解
- Kubernetes核心技術Pod
- Kubernetes核心技術Controller
- Kubernetes核心技術Service
- Kubernetes控制器Controller詳解
- Kubernetes配置管理
- Kubernetes集群安全機制
- Kubernetes核心技術Ingress
- Kubernetes核心技術Helm
- Kubernetes持久化存儲
- Kubernetes集群資源監控
- Kubernetes搭建高可用集群
- Kubernetes容器交付介紹
- 使用kubeadm-ha腳本一鍵安裝K8S
- Kubernetes可視化界面kubesphere
- Kubernetes配置默認存儲類
- 使用Rancher搭建Kubernetes集群
- Kubernetes中的CRI