
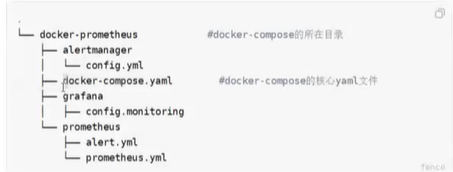
文件結構
<hr>
1.創建基本目錄結構
#切換到root用戶
mkdir /data/docker-prometheusp
mkdir /data/docker-prometheus/{grafana,prometheus,alertmanager} -p
cd /data/docker-prometheus/
<hr>
2.創建alertmanager的配置文件
vi alertmanager/config.yml
global:
#163
smtp_smarthost: 'smtp.163.com:465'
#fa you jian de you xiang
smtp_from: 'sanyii31@163.com'
smtp_auth_username: 'sanyii31@163.com'
smtp_auth_password: '123456'
smtp_require_tls: false
route:
group_by: ['alertname']
group_wait: 10s
group_interval: 10s
repeat_interval: 10m
receiver: email
receivers:
- name: 'email'
email_configs:
- to: 'sanyii31@163.com'
inhibit_rules:
- source_match:
severity: 'critical'
target_match:
severity: 'warning'
equal: ['alertname','dev','instance']
<hr>
3.創建grafana的配置文件
vi grafana/config.monitoring
# admin登錄密碼為password
GF_SECURITY_ADMIN_PASSWORD:password
GF USERS ALLOW SIGN UP=false
<hr/>
4.創建prometheus的配置文件
vi prometheus/prometheus.yml
global:
scrape_interval: "15s" # 將搜刮時間改為15秒,默認一分鐘
evaluation_interval: "15s" #每15秒評估一次規則,默認一分鐘
alerting:
alertmanagers:
- static_configs:
- targets: ["alertmanager:9093"]
rule_files: #報警配置(觸發器)
- "alert.yml"
scrape_configs: # 搜刮配置,一共創建5個Prometheus監控項
- job_name: "prometheus"
scrape_interval: "15s" #
static_configs:
- targets: ["localhost:9090"] # 修改為Prometheus自身的地址和端口
- job_name: "alertmanager"
scrape_interval: "15s"
static_configs:
- targets: ["alertmanager:9093"]
- job_name: "cadvisor"
scrape_interval: "15s"
static_configs:
- targets: ["cadvisor:8080"]
labels:
instance: "cadvisor-server" # 修改為更具體的實例名稱
- job_name: "node-exporter"
scrape_interval: "15s"
static_configs:
- targets: ["node-exporter:9100"]
labels:
instance: "Prometheus服務器" # 修改為更具體的實例名稱
<hr>
5 . 創建prometheus的告警文件
vi prometheus/alert.yml
groups:
- name:Prometheus alert
rules:
#對任何實例超過30秒無法聯系的情況發出警報
- alert:服務告警
expr:up0
for:30s
labels:
severity: critical
annotations:
summary:“服務異常,實例:{{$labels.instance }}
description:"{{slabels.job }}服務已關用”
<hr>
6 .創建docker-compose.yaml文件
vi docker-compose.yaml
# 存儲卷
volumes:
prometheus_data: {}
grafana_data: {}
networks:
monitoring:
driver: bridge
services:
prometheus:
image: registry.cn-hangzhou.aliyuncs.com/ldw520/prometheus:latest #鏡像源
container_name: prometheus
restart: always
volumes:
- /etc/localtime:/etc/localtime:ro #本地時區掛載在鏡像中
- ./prometheus/:/etc/prometheus/
- prometheus_data:/prometheus #數據存儲位置
command :
- '--config.file=/etc/prometheus/prometheus.yml'
- '--storage.tsdb.path=/prometheus'
- '--web.console.libraries=/usr/share/prometheus/console_libraries'
- '--web.console.templates=/usr/share/prometheus/consoles' #控制臺機
#熱加戟配置
- '--web.enable-lifecycle'
#歷史數據最大保窗時間,默認15天
- '--storage.tsdb.retention.time=30d'
networks:
- monitoring
links:
- alertmanager
- cadvisor
- node_exporter
expose:
- '9090'
ports:
- 9090:9090
depends_on:
- cadvisor #等待cadvisor日動完成后prometheu5再啟動
alertmanager:
image: registry.cn-hangzhou.aliyuncs.com/ldw520/alertmanager:latest #鏡像源
container_name: alertmanager
restart: always
volumes:
- /etc/localtime:/etc/localtime:ro
- ./alertmanager/:/etc/alertmanager/
command:
- '--config.file=/etc/alertmanager/config.yml'
- '--storage.path=/alertmanager'
networks:
- monitoring
expose:
- '9093'
ports:
- 9093:9093
# 監控容卻
cadvisor:
image: registry.cn-hangzhou.aliyuncs.com/ldw520/cadvisor:latest #鏡像源
container_name: cadvisor
restart: always
volumes:
- /etc/localtime:/etc/localtime:ro
- /:/rootfs:ro
- /var/run:/var/run:rw
- /sys:/sys:ro
- /var/lib/docker/:/var/lib/docker:ro
networks:
- monitoring
expose:
- '8080'
node_exporter:
image: registry.cn-hangzhou.aliyuncs.com/ldw520/node-exporter:v1.8.0 #鏡像源
container_name: node-exporter
restart: always
volumes:
- /etc/localtime:/etc/localtime:ro
- /proc:/host/proc:ro
- /sys:/host/sys:ro
- /:/rootfs:ro
command:
- '--path.procfs=/host/proc'
- '--path.sysfs=/host/sys'
- '--collector.filesystem.ignored-mount-points=^/(sys|proc|dev|host|etc)($$|/)'
networks:
- monitoring
ports:
- '9100:9100'
grafana:
image: registry.cn-hangzhou.aliyuncs.com/ldw520/grafana:9.3.16 #鏡像源
container_name: grafana
restart: always
volumes:
- /etc/localtime:/etc/localtime:ro
- grafana_data:/var/lib/grafana
- ./grafana/provisioning/:/etc/grafana/provisioning/
env_file:
- ./grafana/config.monitoring
networks:
- monitoring
links:
- prometheus
ports:
- 3000:3000
depends_on:
- prometheus
<hr>
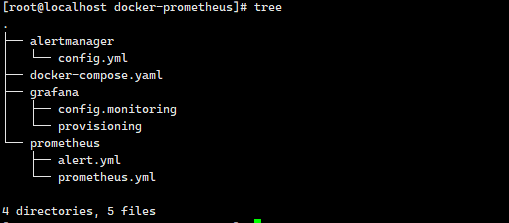
7.查看文件夾樹
yum intall -y tree
<hr>
8.運行docker-compose
cd /data/docker-compose
docker-compose up -d (-d后臺運行)
<hr>
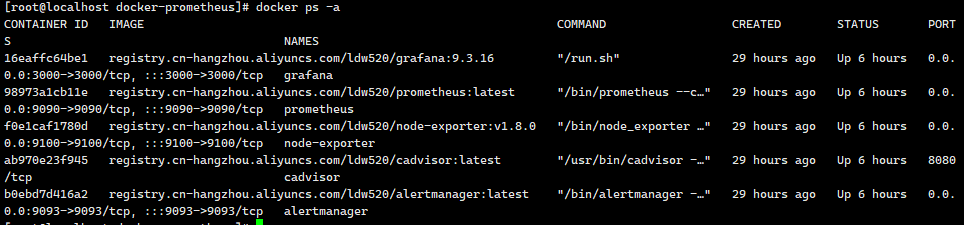
9.檢查運行狀態
docker images #查看鏡像是否已下載
docker ps -a #發現5個鏡像都處于 up運行狀態
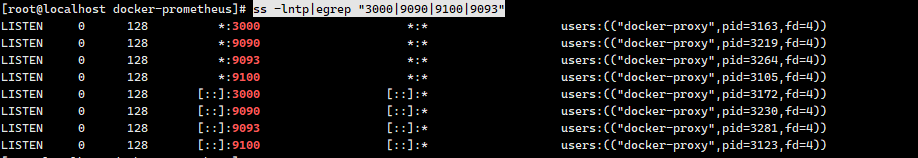
ss -lntp|egrep "3000|9090|9100|9093" #檢查端口
<hr>
10.web訪問地址
應用 | 訪向地址 | 賬號/密碼
prometheus | http://centosip:9090/ | 無
grafana | http://centosip:3000/ | admin/password
alertmanager | http://centosip:9093/ | 無
node_exporter | http://centosip:9100 | 無
- Prometheus教程
- 一. dokcer 安裝
- 二. 安裝docker-compose
- 三. docker-compose安裝Prometheus
- 四. 配置grafana的數據源
- 五. Prometheus的Exporter
- 六. Prometheus的基本術語
- 七. 監控Linux
- 八. 監控redis和mongodb
- 九. 監控mysql數據庫
- 十. 監控go程序
- 十一. 監控nginx
- 十二. 監控消息隊列
- 十三. 監控docker
- 十四. 監控進程
- 十五. 域名監控
- 十六. SNMP監控
- 十七. 黑盒監控
- 十八. 自定義監控
- 十九. go實現自定義監控
- 二十. 服務發現概述
- 二十一. 基于文件的服務發現
- 二十二. 基于Consul的服務發現
- 二十三. relabeling機制