
監控數據庫go程序
一、編寫一段go程序代碼
package main
import (
"github.com/prometheus/client_golang/prometheus/promhttp"
"log"
"net/http"
"runtime"
"sync"
"time"
"github.com/prometheus/client_golang/prometheus"
)
var (
goGoroutines = prometheus.NewGauge(prometheus.GaugeOpts{
Name: "go_goroutines",
Help: "Number of current goroutines.",
})
goGCDurationSeconds = prometheus.NewHistogram(prometheus.HistogramOpts{
Name: "go_gc_duration_seconds",
Help: "A histogram of the GC duration in seconds.",
Buckets: []float64{0.001, 0.005, 0.01, 0.05, 0.1, 0.5, 1, 5, 10},
})
goMemstatsAllocBytes = prometheus.NewGauge(prometheus.GaugeOpts{
Name: "go_memstats_alloc_bytes",
Help: "Number of bytes allocated and still in use.",
})
goMemstatsHeapAllocBytes = prometheus.NewGauge(prometheus.GaugeOpts{
Name: "go_memstats_heap_alloc_bytes",
Help: "Number of heap bytes allocated and still in use.",
})
goMemstatsAllocBytesTotal = prometheus.NewCounter(prometheus.CounterOpts{
Name: "go_memstats_alloc_bytes_total",
Help: "Total number of bytes allocated, even if freed.",
})
goMemstatsSysBytes = prometheus.NewGauge(prometheus.GaugeOpts{
Name: "go_memstats_sys_bytes",
Help: "Total number of bytes obtained by system. Sum of all system allocations.",
})
goMemstatsHeapSysBytes = prometheus.NewGauge(prometheus.GaugeOpts{
Name: "go_memstats_heap_sys_bytes",
Help: "Number of heap bytes obtained from system.",
})
goMemstatsHeapIdleBytes = prometheus.NewGauge(prometheus.GaugeOpts{
Name: "go_memstats_heap_idle_bytes",
Help: "Number of heap bytes waiting to be used.",
})
goMemstatsHeapInuseBytes = prometheus.NewGauge(prometheus.GaugeOpts{
Name: "go_memstats_heap_inuse_bytes",
Help: "Number of heap bytes that are in use.",
})
goMemstatsStackInuseBytes = prometheus.NewGauge(prometheus.GaugeOpts{
Name: "go_memstats_stack_inuse_bytes",
Help: "Number of bytes in use by the stack allocator.",
})
goMemstatsStackSysBytes = prometheus.NewGauge(prometheus.GaugeOpts{
Name: "go_memstats_stack_sys_bytes",
Help: "Total number of bytes obtained from system for stack allocator.",
})
goMemstatsMspanInuseBytes = prometheus.NewGauge(prometheus.GaugeOpts{
Name: "go_memstats_mspan_inuse_bytes",
Help: "Number of bytes in use by mspan structures.",
})
goMemstatsMspanSysBytes = prometheus.NewGauge(prometheus.GaugeOpts{
Name: "go_memstats_mspan_sys_bytes",
Help: "Number of bytes obtained from system for mspan structures.",
})
goMemstatsMcacheInuseBytes = prometheus.NewGauge(prometheus.GaugeOpts{
Name: "go_memstats_mcache_inuse_bytes",
Help: "Number of bytes in use by mcache structures.",
})
goMemstatsMcacheSysBytes = prometheus.NewGauge(prometheus.GaugeOpts{
Name: "go_memstats_mcache_sys_bytes",
Help: "Number of bytes obtained from system for mcache structures.",
})
goMemstatsBuckHashSysBytes = prometheus.NewGauge(prometheus.GaugeOpts{
Name: "go_memstats_buck_hash_sys_bytes",
Help: "Number of bytes used by the profiling bucket hash table.",
})
goMemstatsGCSysBytes = prometheus.NewGauge(prometheus.GaugeOpts{
Name: "go_memstats_gc_sys_bytes",
Help: "Number of bytes used for garbage collection system metadata.",
})
)
func updateMetrics() {
var stats runtime.MemStats
runtime.ReadMemStats(&stats)
goGoroutines.Set(float64(runtime.NumGoroutine()))
goMemstatsAllocBytes.Set(float64(stats.Alloc))
goMemstatsHeapAllocBytes.Set(float64(stats.HeapAlloc))
goMemstatsAllocBytesTotal.Add(float64(stats.TotalAlloc))
goMemstatsSysBytes.Set(float64(stats.Sys))
goMemstatsHeapSysBytes.Set(float64(stats.HeapSys))
goMemstatsHeapIdleBytes.Set(float64(stats.HeapIdle))
goMemstatsHeapInuseBytes.Set(float64(stats.HeapInuse))
goMemstatsStackInuseBytes.Set(float64(stats.StackInuse))
goMemstatsStackSysBytes.Set(float64(stats.StackSys))
goMemstatsMspanInuseBytes.Set(float64(stats.MSpanInuse))
goMemstatsMspanSysBytes.Set(float64(stats.MSpanSys))
goMemstatsMcacheInuseBytes.Set(float64(stats.MCacheInuse))
goMemstatsMcacheSysBytes.Set(float64(stats.MCacheSys))
goMemstatsBuckHashSysBytes.Set(float64(stats.BuckHashSys))
goMemstatsGCSysBytes.Set(float64(stats.GCSys))
// For GC duration, we'll need to track GC events separately
// and update the histogram accordingly.
// Here's a simplified example of how to do it.
// Note: This is not the most efficient way, but serves as an illustration.
var mu sync.Mutex
var lastGCTime time.Time
mu.Lock()
if lastGCTime.IsZero() {
lastGCTime = time.Now()
} else {
duration := time.Since(lastGCTime).Seconds()
mu.Unlock()
goGCDurationSeconds.Observe(duration)
// Update lastGCTime after unlocking to avoid race conditions
mu.Lock()
lastGCTime = time.Now()
}
}
func main() {
http.Handle("/metrics", promhttp.Handler())
// 定期更新指標
go func() {
for {
updateMetrics()
// 每秒更新一次指標
time.Sleep(1 \* time.Second)
}
}()
log.Fatal(http.ListenAndServe(":8182", nil))
}
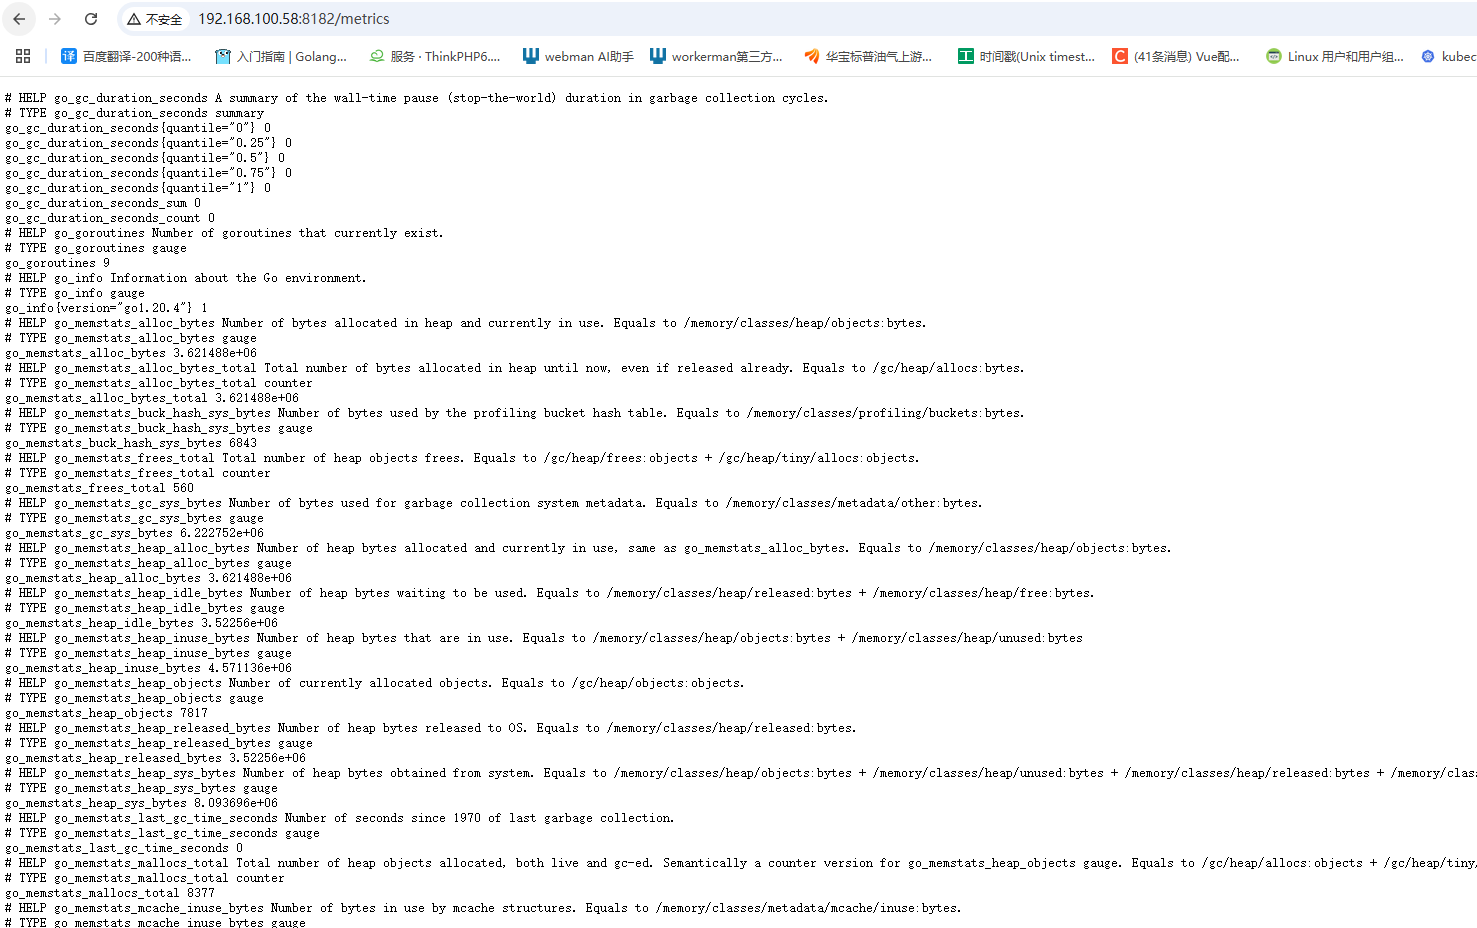
運行,訪問 http://192.168.100.58:8182/metrics
<hr>
二、 prometheus服務器添加go程序的地址
2.4
192.168.100.85的centos上,修改prometheus的配置文件
#進入docker-prometheus目錄
cd /data/docker-prometheus
#修改prometheus.yml
vi prometheus/prometheus.yml
添加monogodb_exporter配置如下圖:
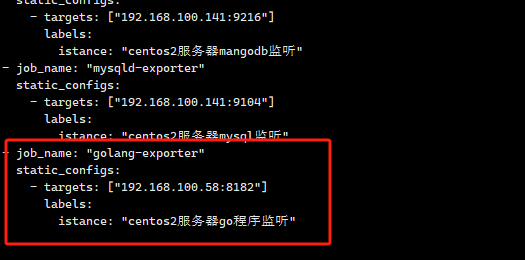
- job_name: "golang-exporter"
static_configs:
- targets: ["192.168.100.58:8182"]
labels:
istance: "centos2服務器go程序監聽"
保存后輸入命令更新:
curl -XPOST http://localhost:9090/-/reload
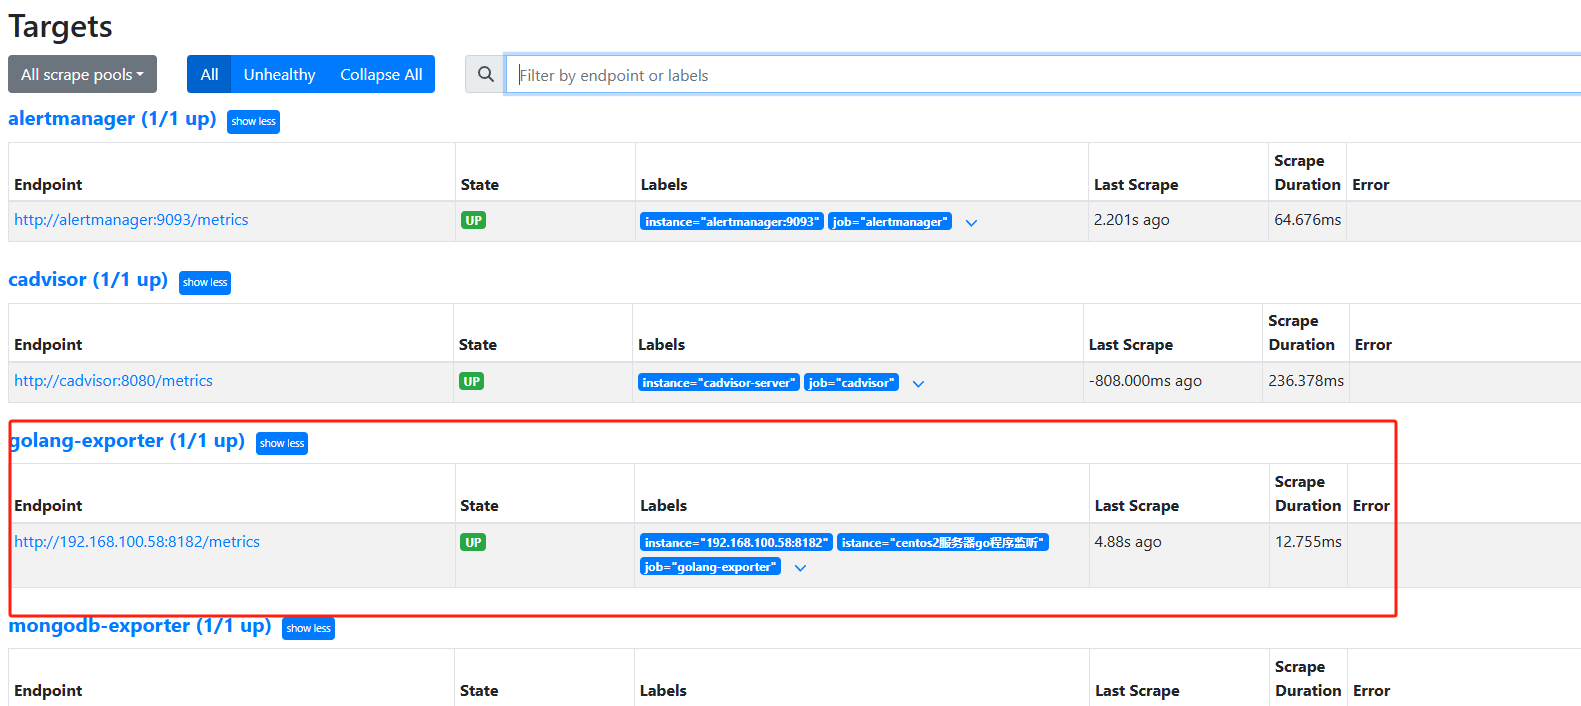
成功監聽
<hr>
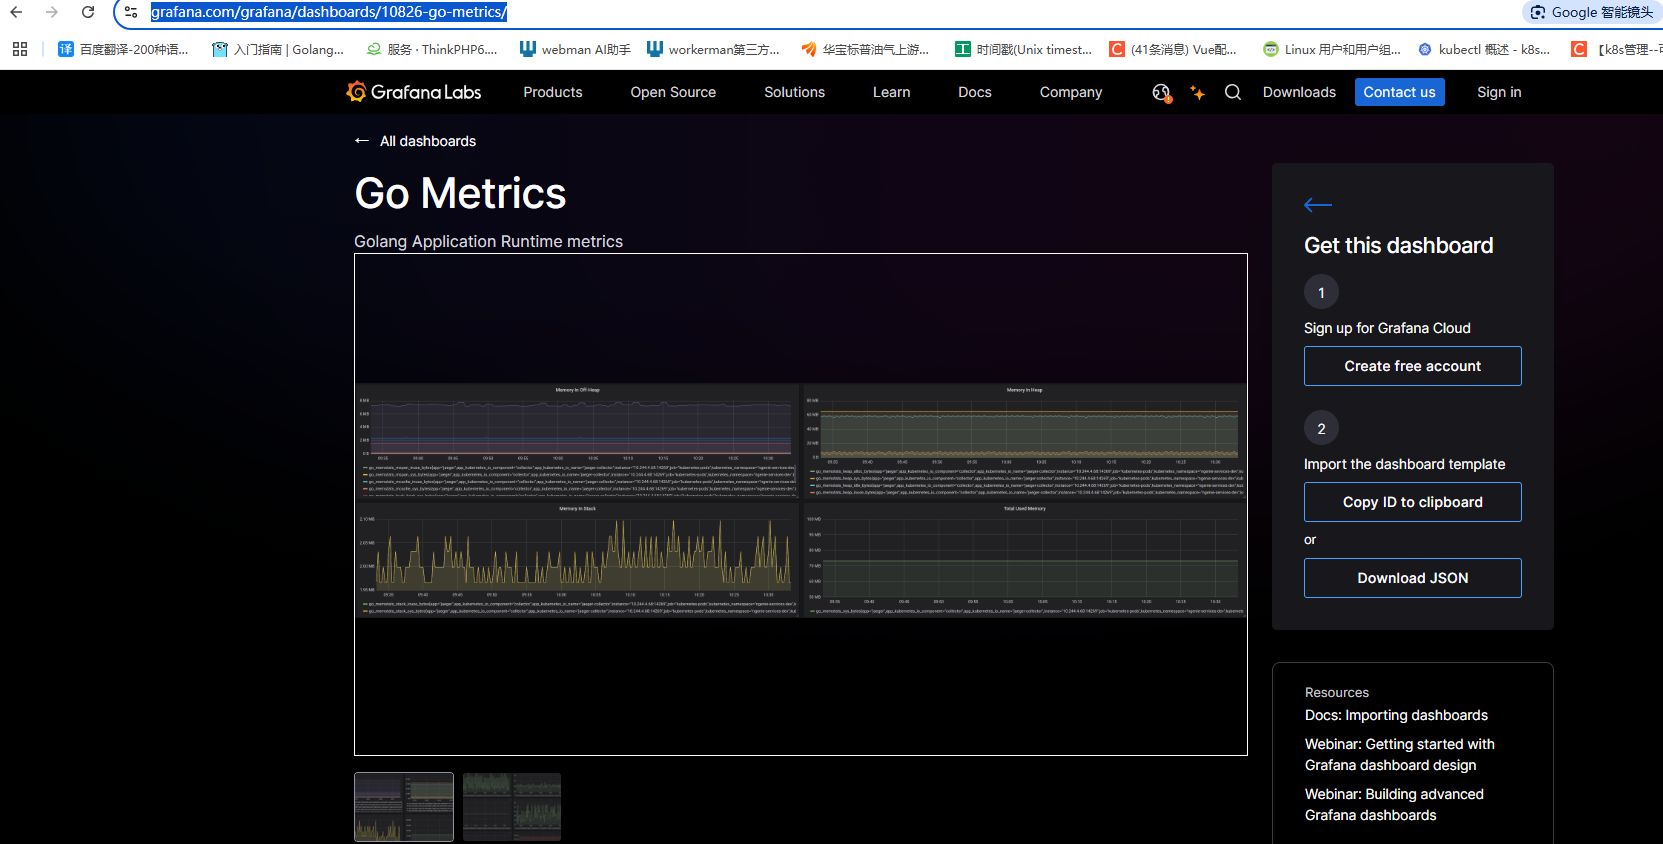
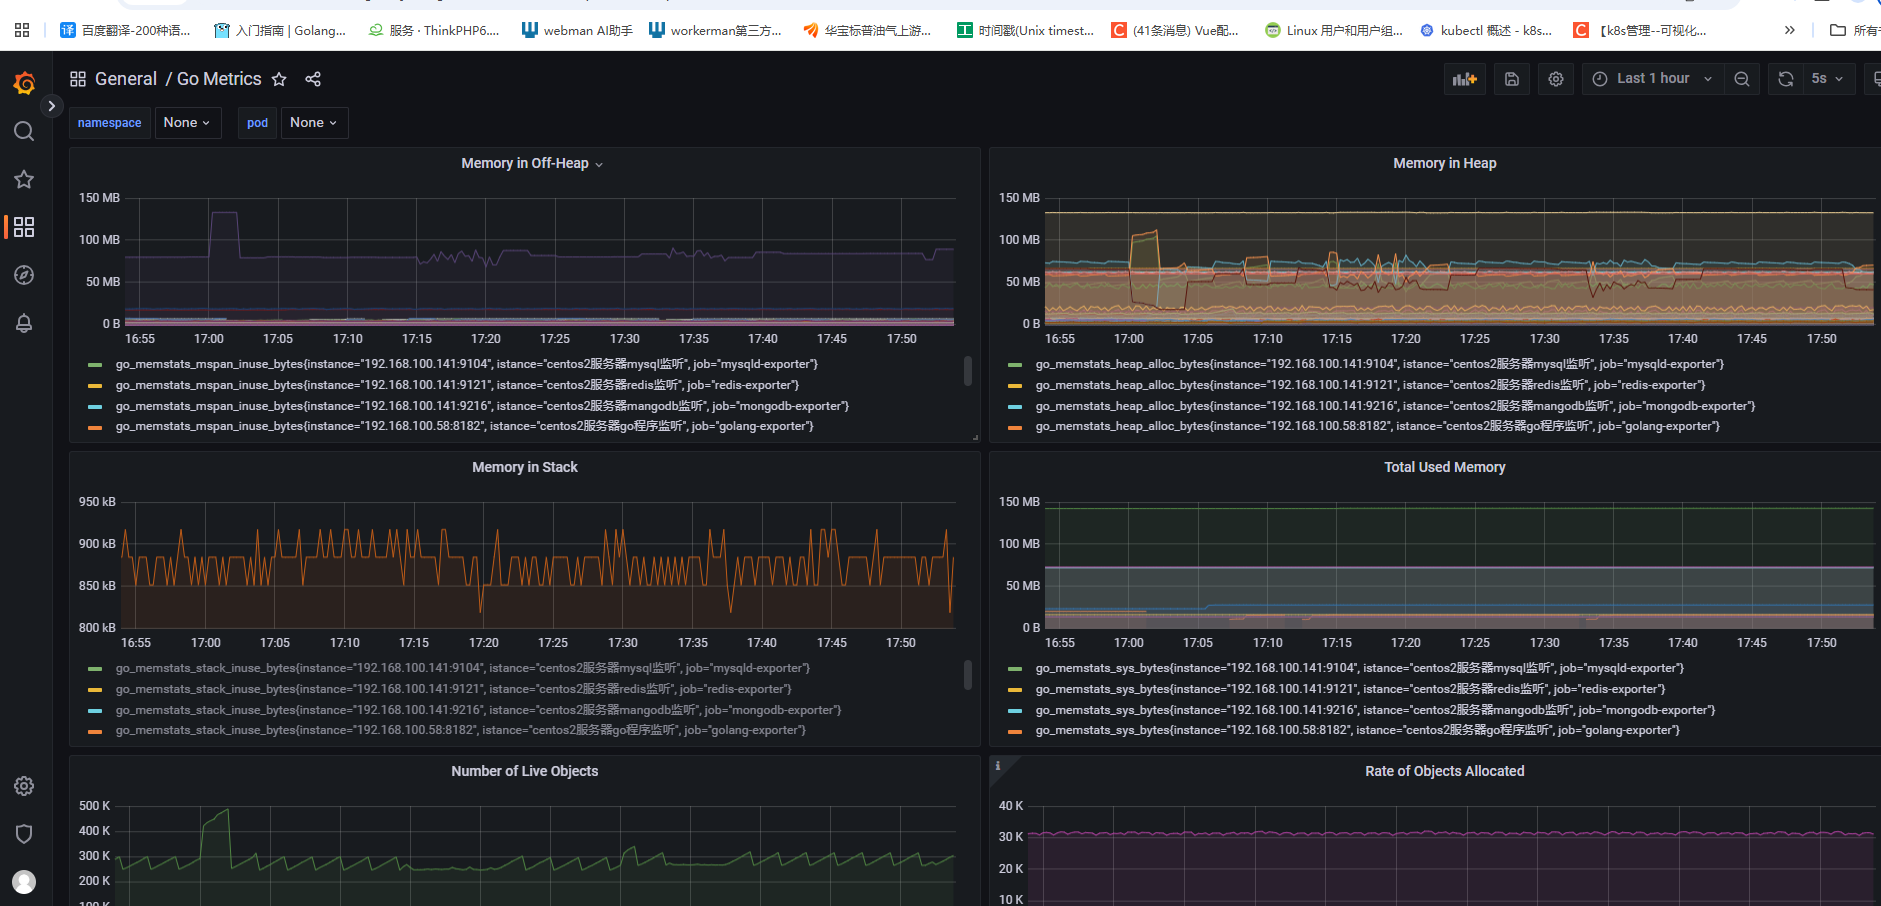
2.6 grafana中對go程序進行監控(因為程序參數是對著模板參數寫的,所以適合,自己隨便寫的得自己配面板)
copy id to clipboard->grafana的dashboards中lmport dashboard
https://grafana.com/grafana/dashboards/10826-go-metrics/
- Prometheus教程
- 一. dokcer 安裝
- 二. 安裝docker-compose
- 三. docker-compose安裝Prometheus
- 四. 配置grafana的數據源
- 五. Prometheus的Exporter
- 六. Prometheus的基本術語
- 七. 監控Linux
- 八. 監控redis和mongodb
- 九. 監控mysql數據庫
- 十. 監控go程序
- 十一. 監控nginx
- 十二. 監控消息隊列
- 十三. 監控docker
- 十四. 監控進程
- 十五. 域名監控
- 十六. SNMP監控
- 十七. 黑盒監控
- 十八. 自定義監控
- 十九. go實現自定義監控
- 二十. 服務發現概述
- 二十一. 基于文件的服務發現
- 二十二. 基于Consul的服務發現
- 二十三. relabeling機制