
[TOC]
# 1、最常用的調試 golang 的 bug 以及性能問題的實踐方法?
> 本節為**重點**章節
## 場景1: 如何分析程序的運行時間與CPU利用率情況?
### (1) shell內置time指令
這個方法不算新穎,但是確很實用。 `time`是Unix/Linux內置多命令,使用時一般不用傳過多參數,直接跟上需要調試多程序即可。
```bash
$ time go run test2.go
&{{0 0} 張三 0}
real 0m0.843s
user 0m0.216s
sys 0m0.389s
```
上面是使用time對 `go run test2.go`對執行程序坐了性能分析,得到3個指標。
- `real`:從程序開始到結束,實際度過的時間;
- `user`:程序在**用戶態**度過的時間;
- `sys`:程序在**內核態**度過的時間。
一般情況下 `real` **>=** `user` + `sys`,因為系統還有其它進程(切換其他進程中間對于本進程會有空白期)。
### (2) /usr/bin/time指令
這個指令比內置的time更加詳細一些,使用的時候需要用絕對路徑,而且要加上參數`-v `
```bash
$ /usr/bin/time -v go run test2.go
Command being timed: "go run test2.go"
User time (seconds): 0.12
System time (seconds): 0.06
Percent of CPU this job got: 115%
Elapsed (wall clock) time (h:mm:ss or m:ss): 0:00.16
Average shared text size (kbytes): 0
Average unshared data size (kbytes): 0
Average stack size (kbytes): 0
Average total size (kbytes): 0
Maximum resident set size (kbytes): 41172
Average resident set size (kbytes): 0
Major (requiring I/O) page faults: 1
Minor (reclaiming a frame) page faults: 15880
Voluntary context switches: 897
Involuntary context switches: 183
Swaps: 0
File system inputs: 256
File system outputs: 2664
Socket messages sent: 0
Socket messages received: 0
Signals delivered: 0
Page size (bytes): 4096
Exit status: 0
```
可以看到這里的功能要強大多了,除了之前的信息外,還包括了:
- CPU占用率;
- 內存使用情況;
- Page Fault 情況;
- 進程切換情況;
- 文件系統IO;
- Socket 使用情況;
- ……
## 場景2: 如何分析golang程序的內存使用情況?
### (1) 內存占用情況查看
我們先寫一段demo例子代碼
```go
package main
import (
"log"
"runtime"
"time"
)
func test() {
//slice 會動態擴容,用slice來做堆內存申請
container := make([]int, 8)
log.Println(" ===> loop begin.")
for i := 0; i < 32*1000*1000; i++ {
container = append(container, i)
}
log.Println(" ===> loop end.")
}
func main() {
log.Println("Start.")
test()
log.Println("force gc.")
runtime.GC() //強制調用gc回收
log.Println("Done.")
time.Sleep(3600 * time.Second) //睡眠,保持程序不退出
}
```
編譯
```bash
$go build -o snippet_mem && ./snippet_mem
```
然后在./snippet_mem進程沒有執行完,我們再開一個窗口,通過`top`命令查看進程的內存占用情況
```bash
$top -p $(pidof snippet_mem)
```
得到結果如下:
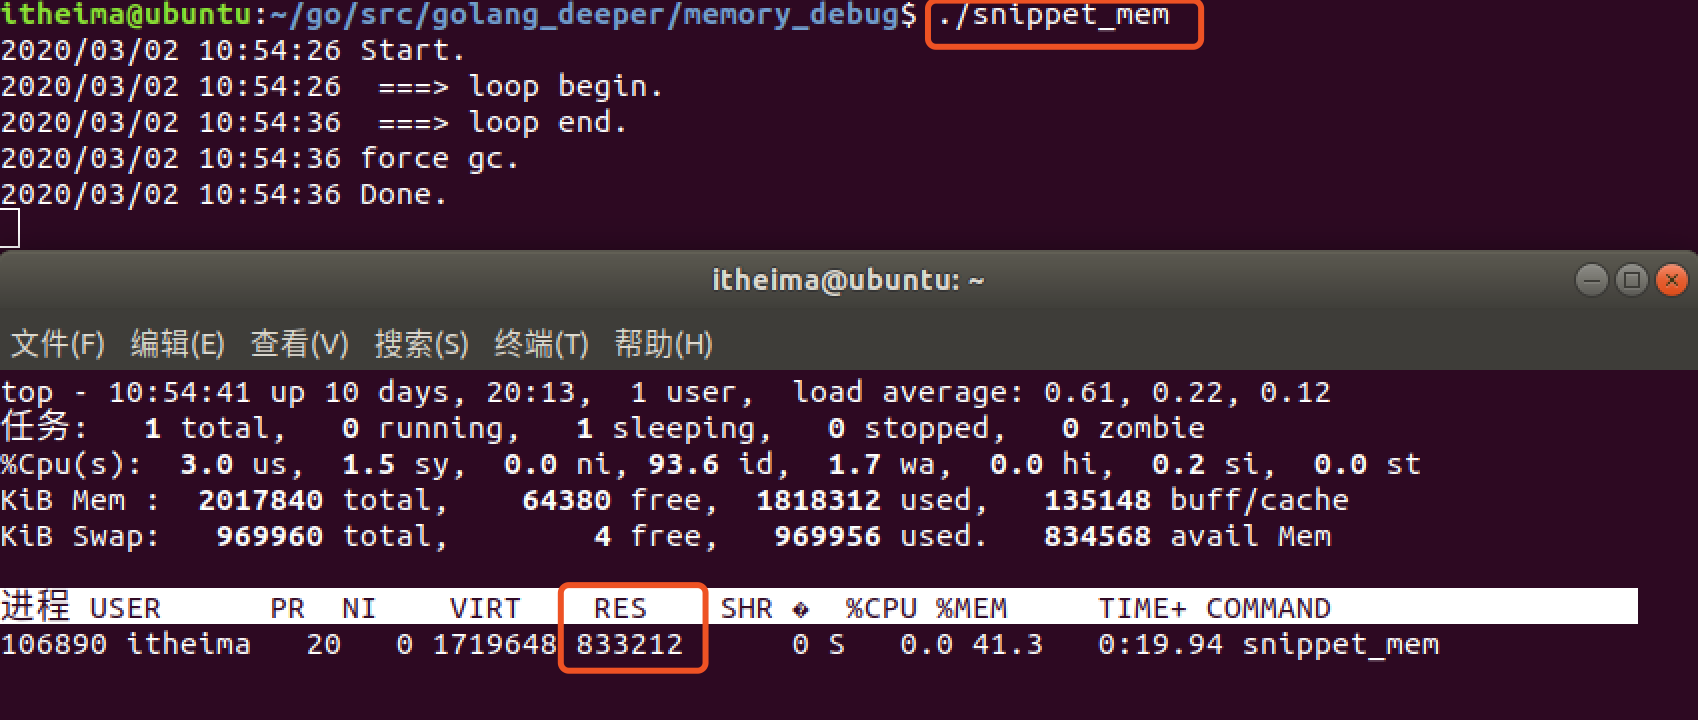
我們看出來,沒有退出的snippet_mem進程有約830m的內存被占用。
直觀上來說,這個程序在`test()`函數執行完后,切片`contaner`的內存應該被釋放,不應該占用830M那么大。
下面讓我們使用GODEBUG來分析程序的內存使用情況。
---
### (2) GODEBUG與gctrace
**用法**
執行`snippet_mem`程序之前添加環境變量`GODEBUG='gctrace=1'`來跟蹤打印垃圾回收器信息
```bash
$ GODEBUG='gctrace=1' ./snippet_mem
```
設置`gctrace=1`會使得垃圾回收器在每次回收時匯總所回收內存的大小以及耗時,
并將這些內容匯總成單行內容打印到標準錯誤輸出中。
**格式**
```
gc # @#s #%: #+#+# ms clock, #+#/#/#+# ms cpu, #->#-># MB, # MB goal, # P
```
含義
```
gc # GC次數的編號,每次GC時遞增
@#s 距離程序開始執行時的時間
#% GC占用的執行時間百分比
#+...+# GC使用的時間
#->#-># MB GC開始,結束,以及當前活躍堆內存的大小,單位M
# MB goal 全局堆內存大小
# P 使用processor的數量
```
如果每條信息最后,以`(forced)`結尾,那么該信息是由`runtime.GC()`調用觸發
我們來選擇其中一行來解釋一下:
```bash
gc 17 @0.149s 1%: 0.004+36+0.003 ms clock, 0.009+0/0.051/36+0.006 ms cpu, 181->181->101 MB, 182 MB goal, 2 P
```
該條信息含義如下:
* `gc 17`: Gc 調試編號為17
* `@0.149s`:此時程序已經執行了0.149s
* `1%`: 0.149s中其中gc模塊占用了1%的時間
* `0.004+36+0.003 ms clock`: 垃圾回收的時間,分別為STW(stop-the-world)清掃的時間+并發標記和掃描的時間+STW標記的時間
* `0.009+0/0.051/36+0.006 ms cpu`: 垃圾回收占用cpu時間
* `181->181->101 MB`: GC開始前堆內存181M, GC結束后堆內存181M,當前活躍的堆內存101M
* `182 MB goal`: 全局堆內存大小
* `2 P`: 本次GC使用了2個P(調度器中的Processer)
---
了解了GC的調試信息讀法后,接下來我們來分析一下本次GC的結果。
我們還是執行GODEBUG調試
```bash
$ GODEBUG='gctrace=1' ./snippet_mem
```
結果如下
```bash
2020/03/02 11:22:37 Start.
2020/03/02 11:22:37 ===> loop begin.
gc 1 @0.002s 5%: 0.14+0.45+0.002 ms clock, 0.29+0/0.042/0.33+0.005 ms cpu, 4->4->0 MB, 5 MB goal, 2 P
gc 2 @0.003s 4%: 0.13+3.7+0.019 ms clock, 0.27+0/0.037/2.8+0.038 ms cpu, 4->4->2 MB, 5 MB goal, 2 P
gc 3 @0.008s 3%: 0.002+1.1+0.001 ms clock, 0.005+0/0.083/1.0+0.003 ms cpu, 6->6->2 MB, 7 MB goal, 2 P
gc 4 @0.010s 3%: 0.003+0.99+0.002 ms clock, 0.006+0/0.041/0.82+0.004 ms cpu, 5->5->2 MB, 6 MB goal, 2 P
gc 5 @0.011s 4%: 0.079+0.80+0.003 ms clock, 0.15+0/0.046/0.51+0.006 ms cpu, 6->6->3 MB, 7 MB goal, 2 P
gc 6 @0.013s 4%: 0.15+3.7+0.002 ms clock, 0.31+0/0.061/3.3+0.005 ms cpu, 8->8->8 MB, 9 MB goal, 2 P
gc 7 @0.019s 3%: 0.004+2.5+0.005 ms clock, 0.008+0/0.051/2.1+0.010 ms cpu, 20->20->6 MB, 21 MB goal, 2 P
gc 8 @0.023s 5%: 0.014+3.7+0.002 ms clock, 0.029+0.040/1.2/0+0.005 ms cpu, 15->15->8 MB, 16 MB goal, 2 P
gc 9 @0.031s 4%: 0.003+1.6+0.001 ms clock, 0.007+0.094/0/0+0.003 ms cpu, 19->19->10 MB, 20 MB goal, 2 P
gc 10 @0.034s 3%: 0.006+5.2+0.004 ms clock, 0.013+0/0.045/5.0+0.008 ms cpu, 24->24->13 MB, 25 MB goal, 2 P
gc 11 @0.040s 3%: 0.12+2.6+0.002 ms clock, 0.24+0/0.043/2.5+0.004 ms cpu, 30->30->16 MB, 31 MB goal, 2 P
gc 12 @0.043s 3%: 0.11+4.4+0.002 ms clock, 0.23+0/0.044/4.1+0.005 ms cpu, 38->38->21 MB, 39 MB goal, 2 P
gc 13 @0.049s 3%: 0.008+10+0.040 ms clock, 0.017+0/0.045/10+0.080 ms cpu, 47->47->47 MB, 48 MB goal, 2 P
gc 14 @0.070s 2%: 0.004+12+0.002 ms clock, 0.008+0/0.062/12+0.005 ms cpu, 122->122->41 MB, 123 MB goal, 2 P
gc 15 @0.084s 2%: 0.11+11+0.038 ms clock, 0.22+0/0.064/3.9+0.076 ms cpu, 93->93->93 MB, 94 MB goal, 2 P
gc 16 @0.122s 1%: 0.005+25+0.010 ms clock, 0.011+0/0.12/24+0.021 ms cpu, 238->238->80 MB, 239 MB goal, 2 P
gc 17 @0.149s 1%: 0.004+36+0.003 ms clock, 0.009+0/0.051/36+0.006 ms cpu, 181->181->101 MB, 182 MB goal, 2 P
gc 18 @0.187s 1%: 0.12+19+0.004 ms clock, 0.25+0/0.049/19+0.008 ms cpu, 227->227->126 MB, 228 MB goal, 2 P
gc 19 @0.207s 1%: 0.096+27+0.004 ms clock, 0.19+0/0.077/0.73+0.009 ms cpu, 284->284->284 MB, 285 MB goal, 2 P
gc 20 @0.287s 0%: 0.005+944+0.040 ms clock, 0.011+0/0.048/1.3+0.081 ms cpu, 728->728->444 MB, 729 MB goal, 2 P
2020/03/02 11:22:38 ===> loop end.
2020/03/02 11:22:38 force gc.
gc 21 @1.236s 0%: 0.004+0.099+0.001 ms clock, 0.008+0/0.018/0.071+0.003 ms cpu, 444->444->0 MB, 888 MB goal, 2 P (forced)
2020/03/02 11:22:38 Done.
GC forced
gc 22 @122.455s 0%: 0.010+0.15+0.003 ms clock, 0.021+0/0.025/0.093+0.007 ms cpu, 0->0->0 MB, 4 MB goal, 2 P
GC forced
gc 23 @242.543s 0%: 0.007+0.075+0.002 ms clock, 0.014+0/0.022/0.085+0.004 ms cpu, 0->0->0 MB, 4 MB goal, 2 P
GC forced
gc 24 @362.545s 0%: 0.018+0.19+0.006 ms clock, 0.037+0/0.055/0.15+0.013 ms cpu, 0->0->0 MB, 4 MB goal, 2 P
GC forced
gc 25 @482.548s 0%: 0.012+0.25+0.005 ms clock, 0.025+0/0.025/0.11+0.010 ms cpu, 0->0->0 MB, 4 MB goal, 2 P
GC forced
gc 26 @602.551s 0%: 0.009+0.10+0.003 ms clock, 0.018+0/0.021/0.075+0.006 ms cpu, 0->0->0 MB, 4 MB goal, 2 P
GC forced
gc 27 @722.554s 0%: 0.012+0.30+0.005 ms clock, 0.025+0/0.15/0.22+0.011 ms cpu, 0->0->0 MB, 4 MB goal, 2 P
GC forced
gc 28 @842.556s 0%: 0.027+0.18+0.003 ms clock, 0.054+0/0.11/0.14+0.006 ms cpu, 0->0->0 MB, 4 MB goal, 2 P
...
```
**分析**
? 先看在`test()`函數執行完后立即打印的`gc 21`那行的信息。`444->444->0 MB, 888 MB goal`表示垃圾回收器已經把444M的內存標記為非活躍的內存。
再看下一個記錄`gc 22`。`0->0->0 MB, 4 MB goal`表示垃圾回收器中的全局堆內存大小由`888M`下降為`4M`。
**結論**
**1、在test()函數執行完后,demo程序中的切片容器所申請的堆空間都被垃圾回收器回收了。**
2、如果此時在`top`指令查詢內存的時候,如果依然是800+MB,說明**垃圾回收器回收了應用層的內存后,(可能)并不會立即將內存歸還給系統。**
### (3)runtime.ReadMemStats
接下來我么換另一種方式查看內存的方式 利用 runtime庫里的`ReadMemStats()`方法
> demo2.go
```go
package main
import (
"log"
"runtime"
"time"
)
func readMemStats() {
var ms runtime.MemStats
runtime.ReadMemStats(&ms)
log.Printf(" ===> Alloc:%d(bytes) HeapIdle:%d(bytes) HeapReleased:%d(bytes)", ms.Alloc, ms.HeapIdle, ms.HeapReleased)
}
func test() {
//slice 會動態擴容,用slice來做堆內存申請
container := make([]int, 8)
log.Println(" ===> loop begin.")
for i := 0; i < 32*1000*1000; i++ {
container = append(container, i)
if ( i == 16*1000*1000) {
readMemStats()
}
}
log.Println(" ===> loop end.")
}
func main() {
log.Println(" ===> [Start].")
readMemStats()
test()
readMemStats()
log.Println(" ===> [force gc].")
runtime.GC() //強制調用gc回收
log.Println(" ===> [Done].")
readMemStats()
go func() {
for {
readMemStats()
time.Sleep(10 * time.Second)
}
}()
time.Sleep(3600 * time.Second) //睡眠,保持程序不退出
}
```
這里我們, 封裝了一個函數`readMemStats()`,這里面主要是調用`runtime`中的`ReadMemStats()`方法獲得內存信息,然后通過`log`打印出來。
我們執行一下代碼并運行
```bash
$ go run demo2.go
2020/03/02 18:21:17 ===> [Start].
2020/03/02 18:21:17 ===> Alloc:71280(bytes) HeapIdle:66633728(bytes) HeapReleased:66600960(bytes)
2020/03/02 18:21:17 ===> loop begin.
2020/03/02 18:21:18 ===> Alloc:132535744(bytes) HeapIdle:336756736(bytes) HeapReleased:155721728(bytes)
2020/03/02 18:21:38 ===> loop end.
2020/03/02 18:21:38 ===> Alloc:598300600(bytes) HeapIdle:609181696(bytes) HeapReleased:434323456(bytes)
2020/03/02 18:21:38 ===> [force gc].
2020/03/02 18:21:38 ===> [Done].
2020/03/02 18:21:38 ===> Alloc:55840(bytes) HeapIdle:1207427072(bytes) HeapReleased:434266112(bytes)
2020/03/02 18:21:38 ===> Alloc:56656(bytes) HeapIdle:1207394304(bytes) HeapReleased:434266112(bytes)
2020/03/02 18:21:48 ===> Alloc:56912(bytes) HeapIdle:1207394304(bytes) HeapReleased:1206493184(bytes)
2020/03/02 18:21:58 ===> Alloc:57488(bytes) HeapIdle:1207394304(bytes) HeapReleased:1206493184(bytes)
2020/03/02 18:22:08 ===> Alloc:57616(bytes) HeapIdle:1207394304(bytes) HeapReleased:1206493184(bytes)
c2020/03/02 18:22:18 ===> Alloc:57744(bytes) HeapIdle:1207394304(bytes) HeapReleased:1206493184(by
```
? 可以看到,打印`[Done].`之后那條trace信息,Alloc已經下降,即內存已被垃圾回收器回收。在`2020/03/02 18:21:38`和`2020/03/02 18:21:48`的兩條trace信息中,HeapReleased開始上升,即垃圾回收器把內存歸還給系統。
另外,MemStats還可以獲取其它哪些信息以及字段的含義可以參見官方文檔:
> http://golang.org/pkg/runtime/#MemStats
### (4)pprof工具
pprof工具支持網頁上查看內存的使用情況,需要在代碼中添加一個協程即可。
```go
import(
"net/http"
_ "net/http/pprof"
)
go func() {
log.Println(http.ListenAndServe("0.0.0.0:10000", nil))
}()
```
具體添加的完整代碼如下:
> demo3.go
```go
package main
import (
"log"
"runtime"
"time"
"net/http"
_ "net/http/pprof"
)
func readMemStats() {
var ms runtime.MemStats
runtime.ReadMemStats(&ms)
log.Printf(" ===> Alloc:%d(bytes) HeapIdle:%d(bytes) HeapReleased:%d(bytes)", ms.Alloc, ms.HeapIdle, ms.HeapReleased)
}
func test() {
//slice 會動態擴容,用slice來做堆內存申請
container := make([]int, 8)
log.Println(" ===> loop begin.")
for i := 0; i < 32*1000*1000; i++ {
container = append(container, i)
if ( i == 16*1000*1000) {
readMemStats()
}
}
log.Println(" ===> loop end.")
}
func main() {
//啟動pprof
go func() {
log.Println(http.ListenAndServe("0.0.0.0:10000", nil))
}()
log.Println(" ===> [Start].")
readMemStats()
test()
readMemStats()
log.Println(" ===> [force gc].")
runtime.GC() //強制調用gc回收
log.Println(" ===> [Done].")
readMemStats()
go func() {
for {
readMemStats()
time.Sleep(10 * time.Second)
}
}()
time.Sleep(3600 * time.Second) //睡眠,保持程序不退出
}
```
我們正常運行程序,然后同時打開瀏覽器,
輸入地址:http://127.0.0.1:10000/debug/pprof/heap?debug=1
瀏覽器的內容其中有一部分如下,記錄了目前的內存情況
```bash
# ...
# runtime.MemStats
# Alloc = 228248
# TotalAlloc = 1293696976
# Sys = 834967896
# Lookups = 0
# Mallocs = 2018
# Frees = 671
# HeapAlloc = 228248
# HeapSys = 804913152
# HeapIdle = 804102144
# HeapInuse = 811008
# HeapReleased = 108552192
# HeapObjects = 1347
# Stack = 360448 / 360448
# MSpan = 28288 / 32768
# MCache = 3472 / 16384
# BuckHashSys = 1449617
# GCSys = 27418976
# OtherSys = 776551
# NextGC = 4194304
# LastGC = 1583203571137891390
# ...
```
## 場景3: 如何分析Golang程序的CPU性能情況?
### (1)性能分析注意事項
- 性能分析必須在一個
可重復的、穩定的環境中來進行。
- 機器必須閑置
- 不要在共享硬件上進行性能分析;
- 不要在性能分析期間,在同一個機器上去瀏覽網頁
- 注意省電模式和過熱保護,如果突然進入這些模式,會導致分析數據嚴重不準確
- **不要使用虛擬機、共享的云主機**,太多干擾因素,分析數據會很不一致;
- 不要在 macOS 10.11 及以前的版本運行性能分析,有 bug,之后的版本修復了。
如果承受得起,購買專用的性能測試分析的硬件設備,上架。
- 關閉電源管理、過熱管理;
- 絕不要升級,以保證測試的一致性,以及具有可比性。
如果沒有這樣的環境,那就一定要在多個環境中,執行多次,以取得可參考的、具有相對一致性的測試結果。
### (2) CPU性能分析
我們來用下面的代碼進行測試
> demo4.go
```go
package main
import (
"bytes"
"math/rand"
"time"
"log"
"net/http"
_ "net/http/pprof"
)
func test() {
log.Println(" ===> loop begin.")
for i := 0; i < 1000; i++ {
log.Println(genSomeBytes())
}
log.Println(" ===> loop end.")
}
//生成一個隨機字符串
func genSomeBytes() *bytes.Buffer {
var buff bytes.Buffer
for i := 1; i < 20000; i++ {
buff.Write([]byte{'0' + byte(rand.Intn(10))})
}
return &buff
}
func main() {
go func() {
for {
test()
time.Sleep(time.Second * 1)
}
}()
//啟動pprof
http.ListenAndServe("0.0.0.0:10000", nil)
}
```
這里面還是啟動了pprof的堅挺,有關`pprof`啟動的代碼如下
```go
import (
"net/http"
_ "net/http/pprof"
)
func main() {
//...
//...
//啟動pprof
http.ListenAndServe("0.0.0.0:10000", nil)
}
```
`main()`里的流程很簡單,啟動一個goroutine去無限循環調用`test()`方法,休眠1s.
`test()`的流程是生成1000個20000個字符的隨機字符串.并且打印.
我們將上面的代碼編譯成可執行的二進制文件 `demo4`(記住這個名字,稍后我們能用到)
```bash
$ go build demo4.go
```
接下來我們啟動程序,程序會無限循環的打印字符串.
接下來我們通過幾種方式來查看進程的cpu性能情況.
#### A. Web界面查看
瀏覽器訪問http://127.0.0.1:10000/debug/pprof/
我們會看到如下畫面
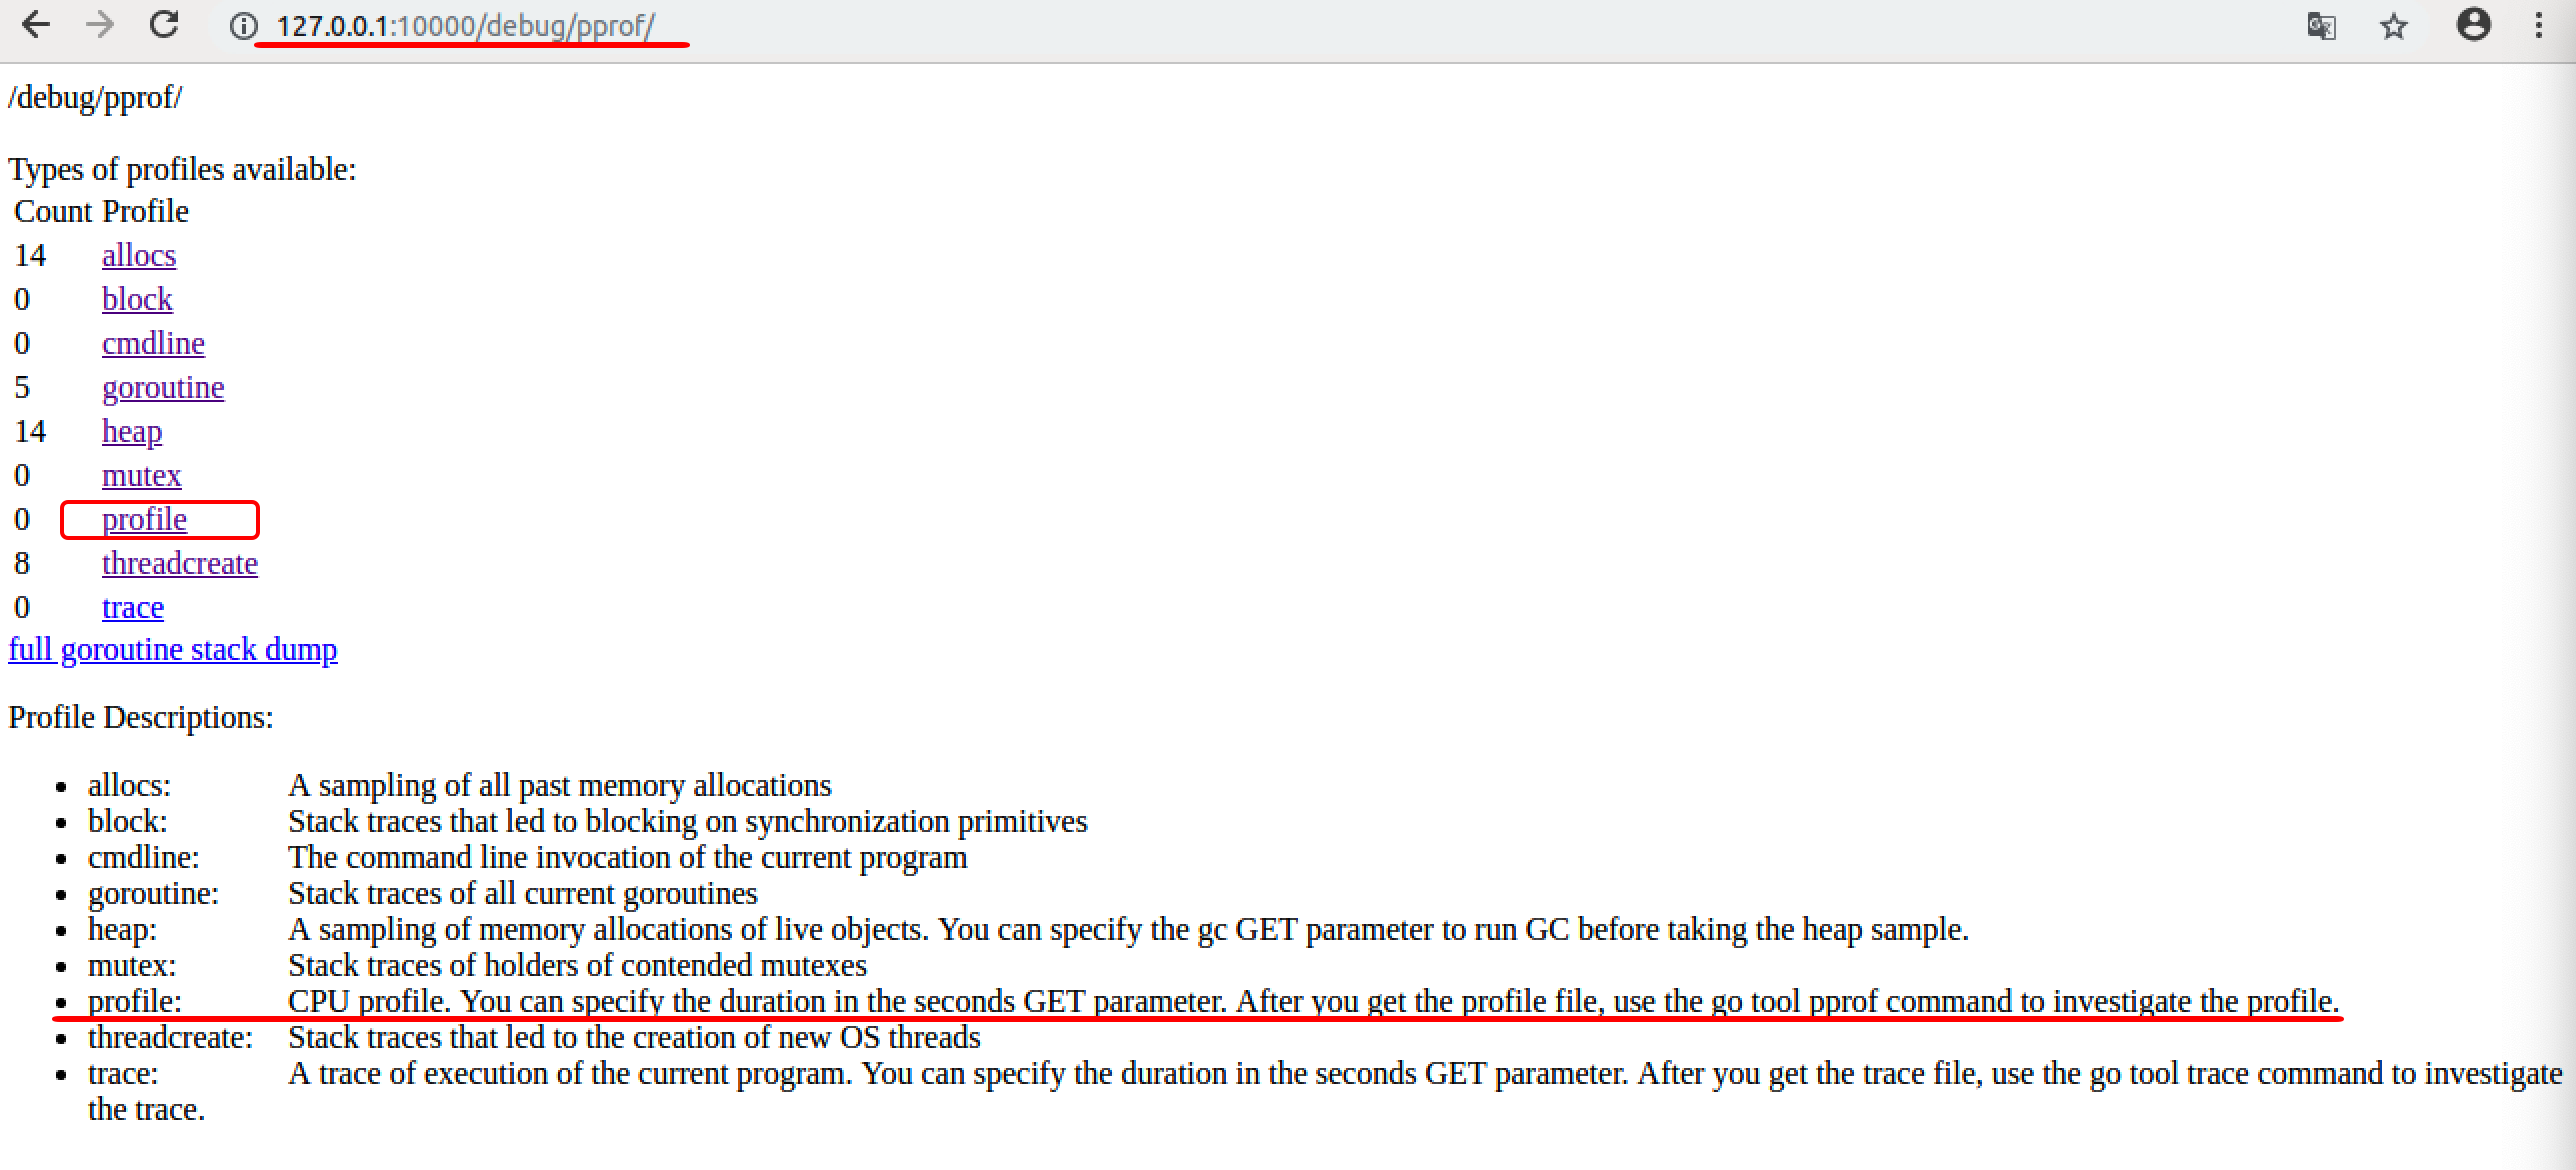
這里面能夠通過pprof查看包括(阻塞信息、cpu信息、內存堆信息、鎖信息、goroutine信息等等), 我們這里關心的cpu的性能的`profile`信息.
有關`profile`下面的英文解釋大致如下:
> “CPU配置文件。您可以在秒GET參數中指定持續時間。獲取概要文件后,請使用go tool pprof命令調查概要文件。”
所以我們要是想得到cpu性能,就是要獲取到當前進程的`profile`文件,這個文件默認是30s生成一個,所以你的程序要至少運行30s以上(這個參數也可以修改,稍后我們介紹)
我們可以直接點擊網頁的`profile`,瀏覽器會給我們下載一個`profile`文件. 記住這個文件的路徑, 可以拷貝到與`demo4`所在的同一文件夾下.
#### B. 使用pprof工具查看
pprof 的格式如下
```bash
go tool pprof [binary] [profile]
```
binary: 必須指向生成這個性能分析數據的那個二進制可執行文件;
profile: 必須是該二進制可執行文件所生成的性能分析數據文件。
**`binary` 和 `profile` 必須嚴格匹配**。
我們來查看一下:
```bash
$ go tool pprof ./demo4 profile
File: demo4
Type: cpu
Time: Mar 3, 2020 at 11:18pm (CST)
Duration: 30.13s, Total samples = 6.27s (20.81%)
Entering interactive mode (type "help" for commands, "o" for options)
(pprof)
```
**help**可以查看一些指令,我么可以通過**top**來查看cpu的性能情況.
```bash
(pprof) top
Showing nodes accounting for 5090ms, 81.18% of 6270ms total
Dropped 80 nodes (cum <= 31.35ms)
Showing top 10 nodes out of 60
flat flat% sum% cum cum%
1060ms 16.91% 16.91% 2170ms 34.61% math/rand.(*lockedSource).Int63
850ms 13.56% 30.46% 850ms 13.56% sync.(*Mutex).Unlock (inline)
710ms 11.32% 41.79% 2950ms 47.05% math/rand.(*Rand).Int31n
570ms 9.09% 50.88% 990ms 15.79% bytes.(*Buffer).Write
530ms 8.45% 59.33% 540ms 8.61% syscall.Syscall
370ms 5.90% 65.23% 370ms 5.90% runtime.procyield
270ms 4.31% 69.54% 4490ms 71.61% main.genSomeBytes
250ms 3.99% 73.52% 3200ms 51.04% math/rand.(*Rand).Intn
250ms 3.99% 77.51% 250ms 3.99% runtime.memmove
230ms 3.67% 81.18% 690ms 11.00% runtime.suspendG
(pprof)
```
這里面有幾列數據,需要說明一下.
- flat:當前函數占用CPU的耗時
- flat::當前函數占用CPU的耗時百分比
- sun%:函數占用CPU的耗時累計百分比
- cum:當前函數加上調用當前函數的函數占用CPU的總耗時
- cum%:當前函數加上調用當前函數的函數占用CPU的總耗時百分比
- 最后一列:函數名稱
通過結果我們可以看出, 該程序的大部分cpu性能消耗在 `main.getSoneBytes()`方法中,其中math/rand取隨機數消耗比較大.
#### C. 通過go tool pprof得到profile文件
我們上面的profile文件是通過web瀏覽器下載的,這個profile的經過時間是30s的,默認值我們在瀏覽器上修改不了,如果你想得到時間更長的cpu利用率,可以通過`go tool pprof`指令與程序交互來獲取到
首先,我們先啟動程序
```
$ ./demo4
```
然后再打開一個終端
```bash
go tool pprof http://localhost:10000/debug/pprof/profile?seconds=60
```
這里制定了生成profile文件的時間間隔60s
等待60s之后, 終端就會有結果出來,我們繼續使用top來查看.
```bash
$ go tool pprof http://localhost:10000/debug/pprof/profile?seconds=60
Fetching profile over HTTP from http://localhost:10000/debug/pprof/profile?seconds=60
Saved profile in /home/itheima/pprof/pprof.demo4.samples.cpu.005.pb.gz
File: demo4
Type: cpu
Time: Mar 3, 2020 at 11:59pm (CST)
Duration: 1mins, Total samples = 12.13s (20.22%)
Entering interactive mode (type "help" for commands, "o" for options)
(pprof) top
Showing nodes accounting for 9940ms, 81.95% of 12130ms total
Dropped 110 nodes (cum <= 60.65ms)
Showing top 10 nodes out of 56
flat flat% sum% cum cum%
2350ms 19.37% 19.37% 4690ms 38.66% math/rand.(*lockedSource).Int63
1770ms 14.59% 33.97% 1770ms 14.59% sync.(*Mutex).Unlock (inline)
1290ms 10.63% 44.60% 6040ms 49.79% math/rand.(*Rand).Int31n
1110ms 9.15% 53.75% 1130ms 9.32% syscall.Syscall
810ms 6.68% 60.43% 1860ms 15.33% bytes.(*Buffer).Write
620ms 5.11% 65.54% 6660ms 54.91% math/rand.(*Rand).Intn
570ms 4.70% 70.24% 570ms 4.70% runtime.procyield
500ms 4.12% 74.36% 9170ms 75.60% main.genSomeBytes
480ms 3.96% 78.32% 480ms 3.96% runtime.memmove
440ms 3.63% 81.95% 440ms 3.63% math/rand.(*rngSource).Uint64
(pprof)
```
依然會得到cpu性能的結果, 我們發現這次的結果與上次30s的結果百分比類似.
#### D.可視化查看
我們還是通過
```bash
$ go tool pprof ./demo4 profile
```
進入profile文件查看,然后我們輸入`web`指令.
```bash
$ go tool pprof ./demo4 profileFile: demo4
Type: cpu
Time: Mar 3, 2020 at 11:18pm (CST)
Duration: 30.13s, Total samples = 6.27s (20.81%)
Entering interactive mode (type "help" for commands, "o" for options)
(pprof) web
```
這里如果報找不到`graphviz`工具,需要安裝一下
**Ubuntu安裝**
```
$sudo apt-get install graphviz
```
**Mac安裝**
```
brew install graphviz
```
**windows安裝**
下載https://graphviz.gitlab.io/_pages/Download/Download_windows.html
```bash
將graphviz安裝目錄下的bin文件夾添加到Path環境變量中。 在終端輸入dot -version查看是否安裝成功。
```
然后我們得到一個svg的可視化文件在`/tmp`路徑下
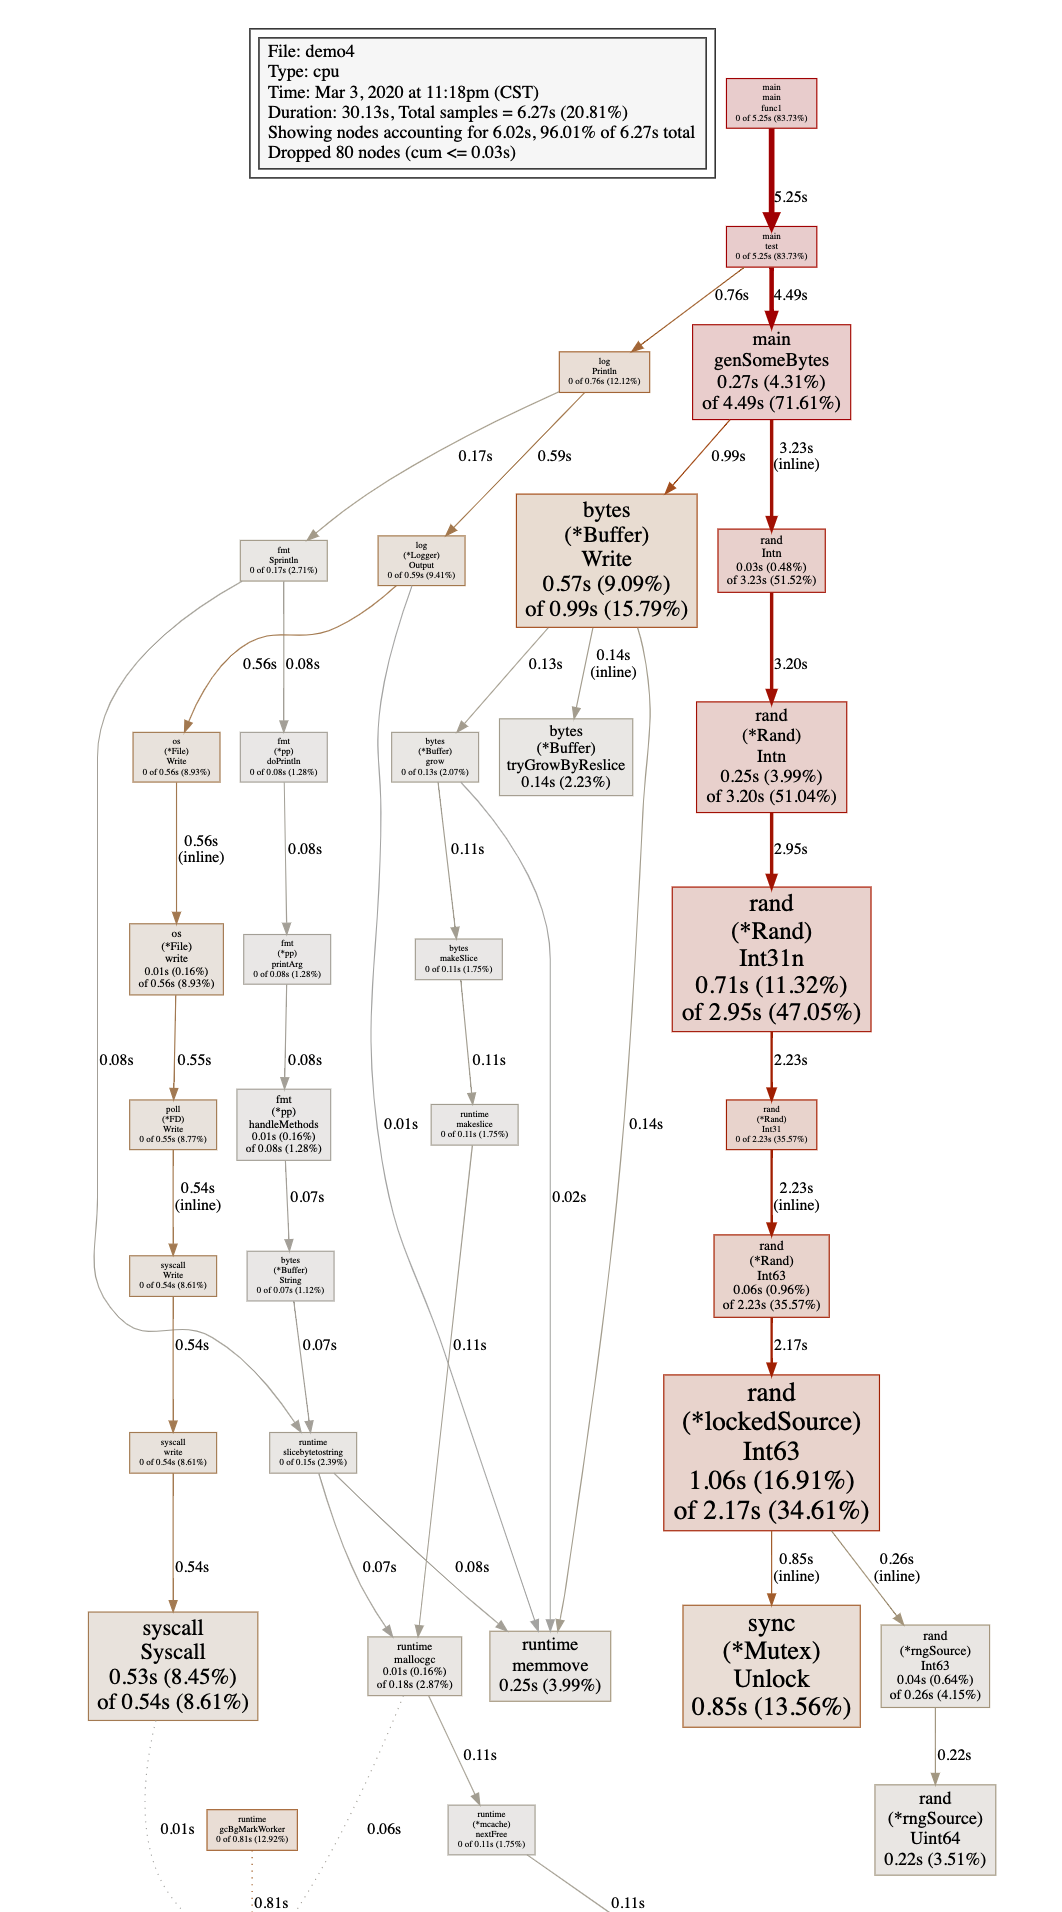
這樣我們就能比較清晰的看到函數之間的調用關系,方塊越大的表示cpu的占用越大.
- 封面
- 第一篇:Golang修養必經之路
- 1、最常用的調試 golang 的 bug 以及性能問題的實踐方法?
- 2、Golang的協程調度器原理及GMP設計思想?
- 3、Golang中逃逸現象, 變量“何時棧?何時堆?”
- 4、Golang中make與new有何區別?
- 5、Golang三色標記+混合寫屏障GC模式全分析
- 6、面向對象的編程思維理解interface
- 7、Golang中的Defer必掌握的7知識點
- 8、精通Golang項目依賴Go modules
- 9、一站式精通Golang內存管理
- 第二篇:Golang面試之路
- 1、數據定義
- 2、數組和切片
- 3、Map
- 4、interface
- 5、channel
- 6、WaitGroup
- 第三篇、Golang編程設計與通用之路
- 1、流?I/O操作?阻塞?epoll?
- 2、分布式從ACID、CAP、BASE的理論推進
- 3、對于操作系統而言進程、線程以及Goroutine協程的區別
- 4、Go是否可以無限go? 如何限定數量?
- 5、單點Server的N種并發模型匯總
- 6、TCP中TIME_WAIT狀態意義詳解
- 7、動態保活Worker工作池設計