
實戰 | 使用Prometheus監控Kubernetes集群和應用
====================================
### 一、環境準備
----------------
必要的環境:
* Kubernetes集群,版本1.4以上
* 相關鏡像準備:
* gcr.io/google_containers/kube-state-metrics:v0.5.0
* prom/prometheus:v1.7.0
* prom/node-exporter:v0.14.0
* giantswarm/tiny-tools
* dockermuenster/caddy:0.9.3
* grafana/grafana:4.2.0
* quay.io/prometheus/alertmanager:v0.7.1
訪問專屬harbor下載所有鏡像,harbor地址如下:
`http://harbor.ttlinux.com.cn/harbor/sign-in`
* 將上述鏡像下載到本地后,使用`docker load`命令加載到*Kubernetes*每臺Node節點上。
### 二、Prometheus介紹
---------------------
*Prometheus*由SoundCloud開源的監控系統,它與*Kubernetes*是**CNCF**組織最初的兩個項目,
*Prometheus*很大程度上受到了*Google*的*Borgmon*系統啟發,與傳統的監控方式不同,*Prometheus*使用**拉(Pull)**的方式。
*Prometheus*是一個監控系統,它不僅僅包含了時間序列數據庫,還有全套的抓取、檢索、繪圖、報警的功能。
下圖是*Prometheus*的架構圖:
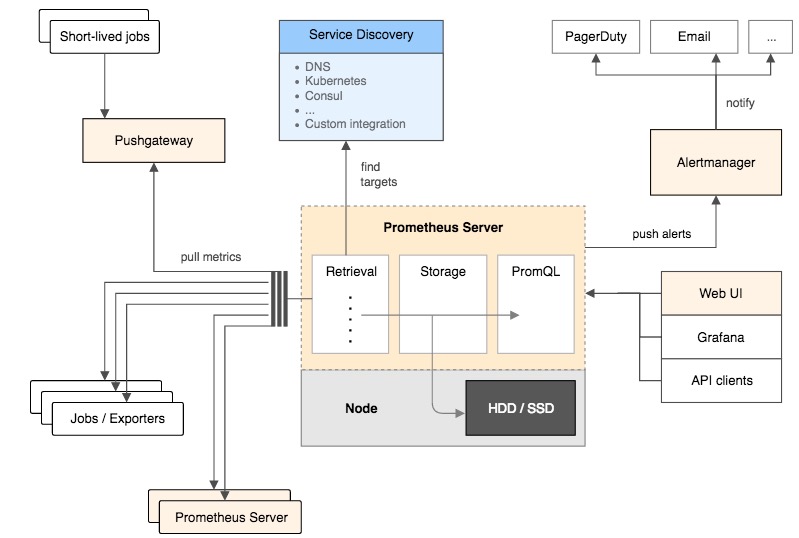
更多細節請訪問[*Prometheus*官方網站](https://prometheus.io/docs/introduction/overview/)
### 三、監控組件安裝
----------------------
下載*Prometheus*的部署文件:[prometheus配置文件下載](https://gitee.com/huyipow/k8s-deploy.git),使用`kubectl`命令創建*Prometheus*各個組件:
```bash
kubectl create -f manifests-all.yaml
```
執行完成后,*Kubernetes*集群中會出現一個新的*Namespace*: "monitoring",里面有很多組件:
```bash
kubectl get pods,svc,deployment,job,daemonset,ingress --namespace=monitoring
NAME READY STATUS RESTARTS AGE
po/alertmanager-3874563995-fqvet 1/1 Running 1 1d
po/grafana-core-741762473-exne3 1/1 Running 1 2d
po/kube-state-metrics-1381605391-hiqti 1/1 Running 1 1d
po/kube-state-metrics-1381605391-j11e6 1/1 Running 1 2d
po/node-directory-size-metrics-0abcp 2/2 Running 2 16d
po/node-directory-size-metrics-6xmzk 2/2 Running 2 16d
po/node-directory-size-metrics-d5cka 2/2 Running 2 16d
po/node-directory-size-metrics-ojo1x 2/2 Running 2 16d
po/node-directory-size-metrics-rdvn8 2/2 Running 2 16d
po/node-directory-size-metrics-tfqox 2/2 Running 2 16d
po/node-directory-size-metrics-wkec1 2/2 Running 2 16d
po/prometheus-core-4080573952-vu2dg 1/1 Running 49 1d
po/prometheus-node-exporter-1dnvp 1/1 Running 1 16d
po/prometheus-node-exporter-64763 1/1 Running 1 16d
po/prometheus-node-exporter-6h6u0 1/1 Running 1 16d
po/prometheus-node-exporter-i29ic 1/1 Running 1 16d
po/prometheus-node-exporter-i6mvh 1/1 Running 1 16d
po/prometheus-node-exporter-lxqou 1/1 Running 1 16d
po/prometheus-node-exporter-n1n8y 1/1 Running 1 16d
NAME CLUSTER-IP EXTERNAL-IP PORT(S) AGE
svc/alertmanager 192.168.3.247 <nodes> 9093/TCP 16d
svc/grafana 192.168.3.89 <nodes> 3000/TCP 16d
svc/kube-state-metrics 192.168.3.78 <none> 8080/TCP 16d
svc/prometheus 192.168.3.174 <nodes> 9090/TCP 16d
svc/prometheus-node-exporter None <none> 9100/TCP 16d
NAME DESIRED CURRENT UP-TO-DATE AVAILABLE AGE
deploy/alertmanager 1 1 1 1 16d
deploy/grafana-core 1 1 1 1 16d
deploy/kube-state-metrics 2 2 2 2 16d
deploy/prometheus-core 1 1 1 1 16d
NAME DESIRED SUCCESSFUL AGE
jobs/grafana-import-dashboards 1 1 16d
NAME DESIRED CURRENT NODE-SELECTOR AGE
ds/node-directory-size-metrics 7 7 <none> 16d
ds/prometheus-node-exporter 7 7 <none> 16d
NAME HOSTS ADDRESS PORTS AGE
ing/grafana grafana.yeepay.com 80 16d
```
*manifests-all.yaml*文件中使用30161和30162的*Nodeport*端口作為*Grafana*和*Prometheus* Web界面的訪問端口。
### 四、監控初始化
----------------------------------
#### 1、 登錄*Grafana*
---------------------
通過[http://${Your_API_SERVER_IP}:30161/]()登錄*Grafana*,默認的用戶名和密碼都是*admin*,登錄如下圖所示:

#### 2、添加數據源
-------------------
點擊左上角圖標,找到*DataSource*選項,添加數據源:

#### 3、添加*Prometheus*的數據源
--------------------
將*Prometheus*的作為數據源的相關參數如下圖所示:

點擊*Save & Test*按鈕,保存數據源。
#### 五、監控*Kubernetes*集群
---------------
#### 1、導入模板文件:
--------------------
點擊左上角*Grafana*的圖標,選在*Dashboard*選項:

點擊*Import*導入監控模板:

可以從[這里](https://grafana.com/dashboards)下載各種監控模板,然后使用*Upload*到*Grafana*:

#### 2、Kubernetes集群監控實例
------------

下載此監控模板:[kubernetes-cluster-monitoring-via-prometheus_rev2.json](grafana/kubernetes-cluster-monitoring-via-prometheus_rev2.json)
#### 3、Deployment級別監控實例
------------------

下載此監控模板:[deployment-metrics_rev1.json](grafana/deployment-metrics_rev1.json)
#### 4、Pod級別資源監控實例
-----------------

下載此監控模板:[pod-metrics_rev2.json](grafana/pod-metrics_rev2.json)
#### 5、App級別的資源、請求量監控實例
--------------

下載此監控模板:[kubernetes-apps_rev1.json](grafana/kubernetes-apps_rev1.json)
- 第一章 kubernetes 功能介紹
- 第二章 在CentOS上部署kubernetes1.7.6集群
- 第三章 創建TLS證書和秘鑰
- 第四章 安裝kubectl命令行工具
- 第五章 創建kubeconfig 文件
- 第六章 etcd 集群部署
- 第七章 部署k8s-master-v1.7.6節點
- 第八章 部署k8s-v1.7.6 node 節點
- 第九章 kubectl 操作示例
- 第十章 在kubernetes 部署第一個應用
- 第十一章 kubernetes之pod 調度
- 第十二章 K8S服務組件之kube-dns&Dashboard
- 第十三章 Kubernetes中的角色訪問控制機制(RBAC)支持
- 第十四章 部署nginx ingress
- 第十五章 使用Prometheus監控Kubernetes集群和應用
- 第十六章 使用helm 應用部署工具
- 第十七章 kubernetes 從1.7 到1.8升級記錄
- 第十八章 在kubernetes 使用ceph
- 第十九章 基于 Jenkins 的 CI/CD(一)
- 第二十章 基于jenkins的CI/CD(二)
- 第二十一章 基于prometheus自定指標HPA彈性伸縮