
# 核心工具模塊
這個模塊主要是參考了 Dropwizard 框架,是一位用戶提醒我說有這么一個框架,然后里面實現一些很酷的東西。那個 [issue](https://github.com/astaxie/beego/issues/128) 詳細描述了該功能的雛形,然后就在參考該功能的情況下增加了一些額外的很酷的功能,接下來我將一一介紹這個模塊中的幾個功能:健康檢查、性能調試、訪問統計、計劃任務。
## 如何安裝
go get github.com/astaxie/beego/toolbox
## healthcheck
監控檢查是用于當你應用于產品環境中進程,檢查當前的狀態是否正常,例如你要檢查當前數據庫是否可用,如下例子所示:
```
type DatabaseCheck struct {
}
func (dc *DatabaseCheck) Check() error {
if dc.isConnected() {
return nil
} else {
return errors.New("can't connect database")
}
}
```
然后就可以通過如下方式增加檢測項:
```
toolbox.AddHealthCheck("database",&DatabaseCheck{})
```
加入之后,你可以往你的管理端口 `/healthcheck` 發送GET請求:
$ curl http://beego.me:8088/healthcheck
* deadlocks: OK
* database: OK
如果檢測顯示是正確的,那么輸出 OK,如果檢測出錯,顯示出錯的信息。
## profile
對于運行中的進程的性能監控是我們進行程序調優和查找問題的最佳方法,例如 GC、goroutine 等基礎信息。profile 提供了方便的入口方便用戶來調試程序,他主要是通過入口函數 `ProcessInput` 來進行處理各類請求,主要包括以下幾種調試:
- lookup goroutine
打印出來當前全部的 goroutine 執行的情況,非常方便查找各個 goroutine 在做的事情:
goroutine 3 [running]:
runtime/pprof.writeGoroutineStacks(0x634238, 0xc210000008, 0x62b000, 0xd200000000000000)
/Users/astaxie/go/src/pkg/runtime/pprof/pprof.go:511 +0x7c
runtime/pprof.writeGoroutine(0x634238, 0xc210000008, 0x2, 0xd2676410957b30fd, 0xae98)
/Users/astaxie/go/src/pkg/runtime/pprof/pprof.go:500 +0x3c
runtime/pprof.(*Profile).WriteTo(0x52ebe0, 0x634238, 0xc210000008, 0x2, 0x1, ...)
/Users/astaxie/go/src/pkg/runtime/pprof/pprof.go:229 +0xb4
_/Users/astaxie/github/beego/toolbox.ProcessInput(0x2c89f0, 0x10, 0x634238, 0xc210000008)
/Users/astaxie/github/beego/toolbox/profile.go:26 +0x256
_/Users/astaxie/github/beego/toolbox.TestProcessInput(0xc21004e090)
/Users/astaxie/github/beego/toolbox/profile_test.go:9 +0x5a
testing.tRunner(0xc21004e090, 0x532320)
/Users/astaxie/go/src/pkg/testing/testing.go:391 +0x8b
created by testing.RunTests
/Users/astaxie/go/src/pkg/testing/testing.go:471 +0x8b2
goroutine 1 [chan receive]:
testing.RunTests(0x315668, 0x532320, 0x4, 0x4, 0x1)
/Users/astaxie/go/src/pkg/testing/testing.go:472 +0x8d5
testing.Main(0x315668, 0x532320, 0x4, 0x4, 0x537700, ...)
/Users/astaxie/go/src/pkg/testing/testing.go:403 +0x84
main.main()
_/Users/astaxie/github/beego/toolbox/_test/_testmain.go:53 +0x9c
- lookup heap
用來打印當前 heap 的信息:
heap profile: 1: 288 [2: 296] @ heap/1048576
1: 288 [2: 296] @
# runtime.MemStats
# Alloc = 275504
# TotalAlloc = 275512
# Sys = 4069608
# Lookups = 5
# Mallocs = 469
# Frees = 1
# HeapAlloc = 275504
# HeapSys = 1048576
# HeapIdle = 647168
# HeapInuse = 401408
# HeapReleased = 0
# HeapObjects = 468
# Stack = 24576 / 131072
# MSpan = 4472 / 16384
# MCache = 1504 / 16384
# BuckHashSys = 1476472
# NextGC = 342976
# PauseNs = [370712 77378 0 0 0 0 0 0 0 0 0 0 0 0 0 0 0 0 0 0 0 0 0 0 0 0 0 0 0 0 0 0 0 0 0 0 0 0 0 0 0 0 0 0 0 0 0 0 0 0 0 0 0 0 0 0 0 0 0 0 0 0 0 0 0 0 0 0 0 0 0 0 0 0 0 0 0 0 0 0 0 0 0 0 0 0 0 0 0 0 0 0 0 0 0 0 0 0 0 0 0 0 0 0 0 0 0 0 0 0 0 0 0 0 0 0 0 0 0 0 0 0 0 0 0 0 0 0 0 0 0 0 0 0 0 0 0 0 0 0 0 0 0 0 0 0 0 0 0 0 0 0 0 0 0 0 0 0 0 0 0 0 0 0 0 0 0 0 0 0 0 0 0 0 0 0 0 0 0 0 0 0 0 0 0 0 0 0 0 0 0 0 0 0 0 0 0 0 0 0 0 0 0 0 0 0 0 0 0 0 0 0 0 0 0 0 0 0 0 0 0 0 0 0 0 0 0 0 0 0 0 0 0 0 0 0 0 0 0 0 0 0 0 0 0 0 0 0 0 0 0 0 0 0 0 0]
# NumGC = 2
# EnableGC = true
# DebugGC = false
- lookup threadcreate
查看創建線程的信息:
threadcreate profile: total 4
1 @ 0x17f68 0x183c7 0x186a8 0x188cc 0x19ca9 0xcf41 0x139a3 0x196c0
# 0x183c7 newm+0x27 /Users/astaxie/go/src/pkg/runtime/proc.c:896
# 0x186a8 startm+0xb8 /Users/astaxie/go/src/pkg/runtime/proc.c:974
# 0x188cc handoffp+0x1ac /Users/astaxie/go/src/pkg/runtime/proc.c:992
# 0x19ca9 runtime.entersyscallblock+0x129 /Users/astaxie/go/src/pkg/runtime/proc.c:1514
# 0xcf41 runtime.notetsleepg+0x71 /Users/astaxie/go/src/pkg/runtime/lock_sema.c:253
# 0x139a3 runtime.MHeap_Scavenger+0xa3 /Users/astaxie/go/src/pkg/runtime/mheap.c:463
1 @ 0x17f68 0x183c7 0x186a8 0x188cc 0x189c3 0x1969b 0x2618b
# 0x183c7 newm+0x27 /Users/astaxie/go/src/pkg/runtime/proc.c:896
# 0x186a8 startm+0xb8 /Users/astaxie/go/src/pkg/runtime/proc.c:974
# 0x188cc handoffp+0x1ac /Users/astaxie/go/src/pkg/runtime/proc.c:992
# 0x189c3 stoplockedm+0x83 /Users/astaxie/go/src/pkg/runtime/proc.c:1049
# 0x1969b runtime.gosched0+0x8b /Users/astaxie/go/src/pkg/runtime/proc.c:1382
# 0x2618b runtime.mcall+0x4b /Users/astaxie/go/src/pkg/runtime/asm_amd64.s:178
1 @ 0x17f68 0x183c7 0x170bc 0x196c0
# 0x183c7 newm+0x27 /Users/astaxie/go/src/pkg/runtime/proc.c:896
# 0x170bc runtime.main+0x3c /Users/astaxie/go/src/pkg/runtime/proc.c:191
1 @
- lookup block
查看 block 信息:
/cssjs/widgets.js contention:
cycles/second=2294781025
- start cpuprof
開始記錄 cpuprof 信息,生產一個文件 cpu-pid.pprof,開始記錄當前進程的 CPU 處理信息
- stop cpuprof
關閉記錄信息
- get memprof
開啟記錄 memprof,生產一個文件 mem-pid.memprof
- gc summary
查看 GC 信息
NumGC:2 Pause:54.54us Pause(Avg):170.82us Overhead:177.49% Alloc:248.97K Sys:3.88M Alloc(Rate):1.23G/s Histogram:287.09us 287.09us 287.09us
## statistics
請先看下面這張效果圖,你有什么想法,很酷?是的,很酷,現在 tootlbox 就是支持這樣的功能了:
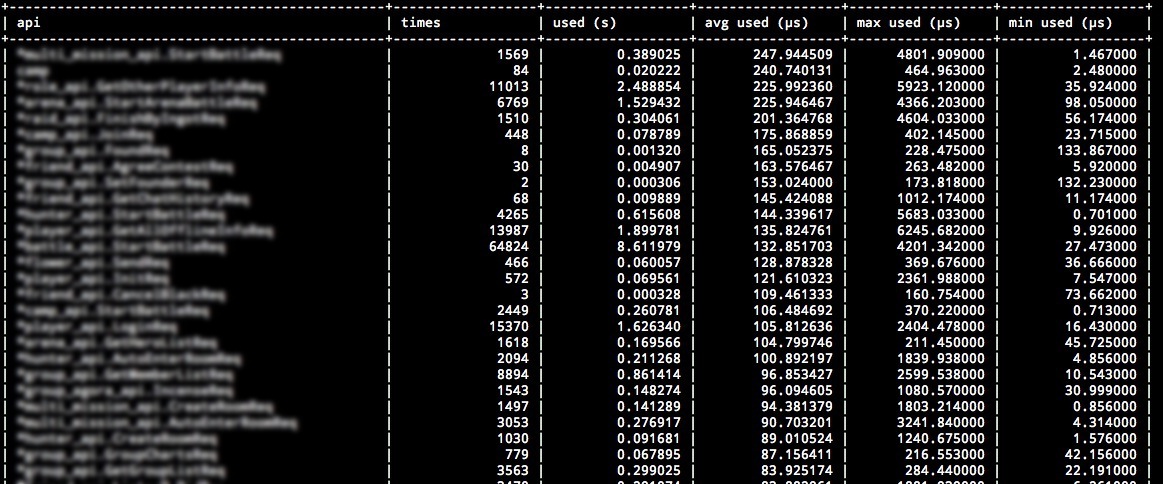
如何使用這個統計呢?如下所示添加統計:
toolbox.StatisticsMap.AddStatistics("POST", "/api/user", "&admin.user", time.Duration(2000))
toolbox.StatisticsMap.AddStatistics("POST", "/api/user", "&admin.user", time.Duration(120000))
toolbox.StatisticsMap.AddStatistics("GET", "/api/user", "&admin.user", time.Duration(13000))
toolbox.StatisticsMap.AddStatistics("POST", "/api/admin", "&admin.user", time.Duration(14000))
toolbox.StatisticsMap.AddStatistics("POST", "/api/user/astaxie", "&admin.user", time.Duration(12000))
toolbox.StatisticsMap.AddStatistics("POST", "/api/user/xiemengjun", "&admin.user", time.Duration(13000))
toolbox.StatisticsMap.AddStatistics("DELETE", "/api/user", "&admin.user", time.Duration(1400))
獲取統計信息
toolbox.StatisticsMap.GetMap(os.Stdout)
輸出如下格式的信息:
| requestUrl | method | times | used | max used | min used | avg used |
| /api/user | POST | 2 | 122.00us | 120.00us | 2.00us | 61.00us |
| /api/user | GET | 1 | 13.00us | 13.00us | 13.00us | 13.00us |
| /api/user | DELETE | 1 | 1.40us | 1.40us | 1.40us | 1.40us |
| /api/admin | POST | 1 | 14.00us | 14.00us | 14.00us | 14.00us |
| /api/user/astaxie | POST | 1 | 12.00us | 12.00us | 12.00us | 12.00us |
| /api/user/xiemengjun | POST | 1 | 13.00us | 13.00us | 13.00us | 13.00us |
## task
玩過 linux 的用戶都知道有一個計劃任務的工具 crontab,我們經常利用該工具來定時的做一些任務,但是有些時候我們的進程內也希望定時的來處理一些事情,例如定時的匯報當前進程的內存信息,goroutine 信息等。或者定時的進行手工觸發 GC,或者定時的清理一些日志數據等,所以實現了秒級別的定時任務,首先讓我們看看如何使用:
1. 初始化一個任務
tk1 := toolbox.NewTask("tk1", "0 12 * * * *", func() error { fmt.Println("tk1"); return nil })
函數原型:
NewTask(tname string, spec string, f TaskFunc) *Task
- tname 任務名稱
- spec 定時任務格式,請參考下面的詳細介紹
- f 執行的函數 func() error
2. 可以測試開啟運行
可以通過如下的代碼運行 TaskFunc,和 spec 無關,用于檢測寫的函數是否如預期所希望的這樣:
err := tk.Run()
if err != nil {
t.Fatal(err)
}
3. 加入全局的計劃任務列表
toolbox.AddTask("tk1", tk1)
4. 開始執行全局的任務
toolbox.StartTask()
defer toolbox.StopTask()
### spec 詳解
spec 格式是參照 crontab 做的,詳細的解釋如下所示:
```
//前6個字段分別表示:
// 秒鐘:0-59
// 分鐘:0-59
// 小時:1-23
// 日期:1-31
// 月份:1-12
// 星期:0-6(0 表示周日)
//還可以用一些特殊符號:
// *: 表示任何時刻
// ,: 表示分割,如第三段里:2,4,表示 2 點和 4 點執行
// -:表示一個段,如第三端里: 1-5,就表示 1 到 5 點
// /n : 表示每個n的單位執行一次,如第三段里,*/1, 就表示每隔 1 個小時執行一次命令。也可以寫成1-23/1.
/////////////////////////////////////////////////////////
// 0/30 * * * * * 每 30 秒 執行
// 0 43 21 * * * 21:43 執行
// 0 15 05 * * * 05:15 執行
// 0 0 17 * * * 17:00 執行
// 0 0 17 * * 1 每周一的 17:00 執行
// 0 0,10 17 * * 0,2,3 每周日,周二,周三的 17:00和 17:10 執行
// 0 0-10 17 1 * * 毎月1日從 17:00 到 7:10 毎隔 1 分鐘 執行
// 0 0 0 1,15 * 1 毎月1日和 15 日和 一日的 0:00 執行
// 0 42 4 1 * * 毎月1日的 4:42 分 執行
// 0 0 21 * * 1-6 周一到周六 21:00 執行
// 0 0,10,20,30,40,50 * * * * 每隔 10 分 執行
// 0 */10 * * * * 每隔 10 分 執行
// 0 * 1 * * * 從 1:0 到 1:59 每隔 1 分鐘 執行
// 0 0 1 * * * 1:00 執行
// 0 0 */1 * * * 毎時 0 分 每隔 1 小時 執行
// 0 0 * * * * 毎時 0 分 每隔 1 小時 執行
// 0 2 8-20/3 * * * 8:02,11:02,14:02,17:02,20:02 執行
// 0 30 5 1,15 * * 1 日 和 15 日的 5:30 執行
```
## 調試模塊(已移動到utils模塊)
我們經常需要打印一些參數進行調試,但是默認的參數打印總是不是很完美,也沒辦法定位代碼行之類的,所以 beego 的 toolbox 模塊進行了 debug 模塊的開發,主要包括了兩個函數:
- Display() 直接打印結果到 console
- GetDisplayString() 返回打印的字符串
兩個函數的功能一模一樣,第一個是直接打印到 console,第二個是返回字符串,方便用戶存儲到日志或者其他存儲。
使用很方便,是 key/value 串出現的,如下示例:
Display("v1", 1, "v2", 2, "v3", 3)
打印結果如下:
2013/12/16 23:48:41 [Debug] at TestPrint() [/Users/astaxie/github/beego/toolbox/debug_test.go:13]
[Variables]
v1 = 1
v2 = 2
v3 = 3
指針類型的打印如下:
type mytype struct {
next *mytype
prev *mytype
}
var v1 = new(mytype)
var v2 = new(mytype)
v1.prev = nil
v1.next = v2
v2.prev = v1
v2.next = nil
Display("v1", v1, "v2", v2)
打印結果如下:
2013/12/16 23:48:41 [Debug] at TestPrintPoint() [/Users/astaxie/github/beego/toolbox/debug_test.go:26]
[Variables]
v1 = &toolbox.mytype{
next: &toolbox.mytype{
next: nil,
prev: 0x210335420,
},
prev: nil,
}
v2 = &toolbox.mytype{
next: nil,
prev: &toolbox.mytype{
next: 0x210335430,
prev: nil,
},
}
- beego簡介
- 為 beego 貢獻
- 發布版本
- 升級指南
- beego安裝升級
- Bee 工具的使用
- 快速入門
- 新建項目
- 路由設置
- Controller 運行機制
- model 邏輯
- view 編寫
- 靜態文件處理
- beego 的 MVC 架構介紹
- controller 設計
- 參數配置
- 路由設置
- 控制器函數
- XSRF 過濾
- 請求數據處理
- session 控制
- 過濾器
- flash 數據
- URL構建
- 多種格式數據輸出
- 表單數據驗證
- 錯誤處理
- 日志處理
- model設計
- 概述
- ORM 使用
- CRUD 操作
- 高級查詢
- 原生 SQL 查詢
- 構造查詢
- 事務處理
- 模型定義
- 命令模式
- 測試用例
- 自定義字段
- FAQ
- view 設計
- 模板語法指南
- 模板處理
- 模板函數
- 靜態文件處理
- 模板分頁處理
- beego 的模塊設計
- session 模塊
- grace 模塊
- cache 模塊
- logs 模塊
- httplib 模塊
- context 模塊
- toolbox 模塊
- config 模塊
- i18n 模塊
- beego 高級編程
- 進程內監控
- API 自動化文檔
- 應用部署
- 獨立部署
- supervisor 部署
- Nginx 部署
- apache 部署
- beego 第三方庫
- 應用例子
- 在線聊天室
- 短域名服務
- Todo 列表
- beego實用庫
- 驗證碼
- 分頁
- FAQ