
## 1、Prometheus 特點
* 多維數據模型:由度量名稱和鍵值對標識的時間序列數據。
* PromSQL:一種靈活的查詢語言,可以利用多維數據完成復雜的查詢。
* 不依賴分布式存儲,單個服務器節點可直接工作。
* 基于HTTP的pull方式采集時間序列數據。
* 推送時間序列數據通過PushGateway組件支持。
* 通過服務發現或靜態配置發現目標。
* 多種圖形模式及儀表盤支持(grafana)。
## 2、Prometheus 工作原理
通過HTTP周期性抓取被監控組件的狀態,任意組件只要提供對應的HTTP接口并符合Prometheus定義的數據格式,就可以接入Prometheus監控;Prometheus Server負責定時在目標上抓取metrics(指標)數據,每個抓取目標都需要暴露一個HTTP服務接口用于Prometheus定時抓取。這種調用被監控對象獲取監控數據的方式被稱為Pull(拉);Pull方式體現了Prometheus獨特的設計哲學與大多數采用Push(推)方式的監控不同。
**優點**
* ```
強大的多維度數據模型
```
* ```
靈活而強大的查詢語句(PromQL):在同一個查詢語句,可以對多個 metrics 進行乘法、加法、連接、取分數位等操作。
```
* ```
易于管理: Prometheus server 是一個單獨的二進制文件,可直接在本地工作,不依賴于分布式存儲。
```
* ```
高效:平均每個采樣點僅占 3.5 bytes,且一個 Prometheus server 可以處理數百萬的 metrics。
```
* ```
使用 pull 模式采集時間序列數據,這樣不僅有利于本機測試而且可以避免有問題的服務器推送壞的 metrics。
```
* ```
可以采用 push gateway 的方式把時間序列數據推送至 Prometheus server 端
```
* ```
可以通過服務發現或者靜態配置去獲取監控的 targets。
```
* ```
有多種可視化圖形界面。
```
* ```
易于伸縮。
```
## 3、組件
Prometheus 生態圈中包含了多個組件,其中許多組件是可選的:
* ```
Prometheus Server: 用于收集和存儲時間序列數據。
```
* ```
Client Library:客戶端庫,為需要監控的服務生成相應的 metrics 并暴露給 Prometheus server。當 Prometheus server 來 pull 時,直接返回實時狀態的 metrics。
```
* ```
Push Gateway: 主要用于短期的 jobs。由于這類 jobs 存在時間較短,可能在 Prometheus 來 pull 之前就消失了。為此,這次 jobs 可以直接向 Prometheus server 端推送它們的 metrics。這種方式主要用于服務層面的 metrics,對于機器層面的 metrices,需要使用 node exporter。
```
* ```
Exporters: 用于暴露已有的第三方服務的 metrics 給 Prometheus。
```
* ```
Alertmanager: 從 Prometheus server 端接收到 alerts 后,會進行去除重復數據,分組,并路由到對收的接受方式,發出報警。常見的接收方式有:電子郵件,pagerduty,OpsGenie, webhook 等。
```
## 4、架構
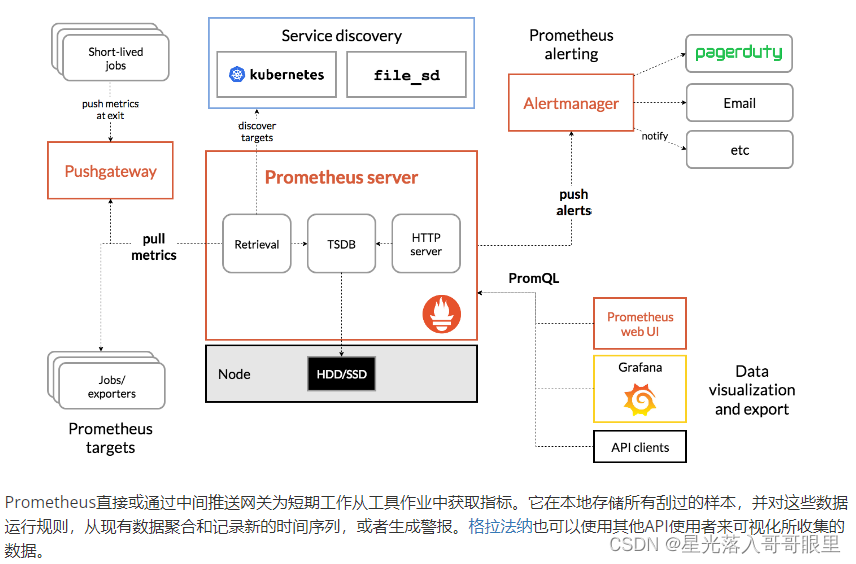
## 5、prometheus運行流程
prometheus根據配置定時去拉取各個節點的數據,默認使用的拉取方式是pull,也可以使用pushgateway提供的push方式獲取各個監控節點的數據。將獲取到的數據存入TSDB(一款時序型數據庫)。此時prometheus已經獲取到了監控數據,可以使用內置的PromQL進行查詢。它的報警功能使用Alertmanager提供(Alertmanager是prometheus的告警管理和發送報警的一個組件)。prometheus原生的圖標功能過于簡單,可將prometheus數據接入grafana,由grafana進行統一管理。
- 項目介紹
- 項目聲明
- 項目簡介
- 架構設計
- 項目亮點功能介紹
- 技術棧介紹
- 核心功能
- 運行環境
- 項目更新日志
- 文檔更新日志
- F&Q
- 部署教程
- 環境準備
- JDK安裝
- JDK1.8,17共存
- maven
- 分布式緩存Redis
- 單機版
- 集群
- 注冊&配置中心alibaba/nacos
- 介紹
- Nacos安裝
- Nacos配置中心
- Nacos注冊發現
- Nacos生產部署方案
- 服務監控-BootAdmin
- 基本介紹
- 如何使用
- 整合Admin-Ui
- 客戶端配置
- 鏈路追蹤
- 基本介紹
- SkyWalking-1
- Skywalking-1
- 消息隊列
- Kafka
- docker安裝kafka
- Linux集群
- Maven私服
- nexus安裝部署
- nexus使用介紹
- 全文搜索elasticsearch
- windows集群搭建
- docker安裝es
- ElasticHD
- linux集群部署
- 統一日志解決方案
- 日志解決方案設計
- 介紹與相關資料
- ELK安裝部署
- elasticsearch 7.5
- logstash-7.5
- kibana-7.5
- filebeat
- 服務監控-Prometheus
- Prometheus安裝配置
- Prometheus介紹
- grafana
- 持續集成部署CICD
- 自動化部署Jenkins
- 安裝部署win
- 打包發布遠程執行
- 安裝部署linux
- jenkins+gitlab+docker容器化工程自動化部署
- Git
- CICD說明
- 阿里云效
- CentOS_MYSQL安裝
- docker
- 安裝
- Docker安裝Nginx
- Docker部署啟動springboot
- dockerCompose
- harbor
- Docker私有鏡像倉庫
- Portainer
- Docker遠程連接設置
- 打包工程
- 必要啟動模塊
- 核心模塊
- 登錄認證
- 緩存功能
- 日志模塊
- 分布式鎖
- 消息隊列
- 異常處理
- 系統接口
- 參數驗證
- es檢索
- 數據導出
- 系統設計
- 系統總體架構
- 擴展模塊(可選)
- 限流熔斷alibaba/sentinel
- 使用Sentinel實現gateway網關及服務接口限流
- Sentinel使用Nacos存儲規則及同步
- 服務調用Feign
- Feign基本介紹
- 如何使用
- 負載均衡
- 請求超時
- 請求攔截器
- 分布式任務調度
- XXL-JOB
- 分布式事務
- TX-LCN
- Seata
- Seata原理解析
- 數據庫分庫分表
- swagger文檔
- 分布式ID生成器解決方案
- 服務網關CloudGateway
- 基本介紹
- 使用網關
- 路由配置
- 全局過濾器
- 服務認證授權架構設計
- 認證服務流程
- 授權服務流程
- 系統冪等性設計與實踐
- 分布式日志鏈路跟蹤
- 實時搜索系統設計
- 應用性能
- 壓力測試工具
- Apache JMeter介紹和安裝
- ApacheJMeter使用
- JVM
- JVM性能調優
- 常見JVM內存錯誤及解決方案
- JVM 分析工具詳解
- Spring Cloud性能調優
- Linux運維
- Linux 常用命令
- Linux開啟端口