[TOC]
# 一、原理
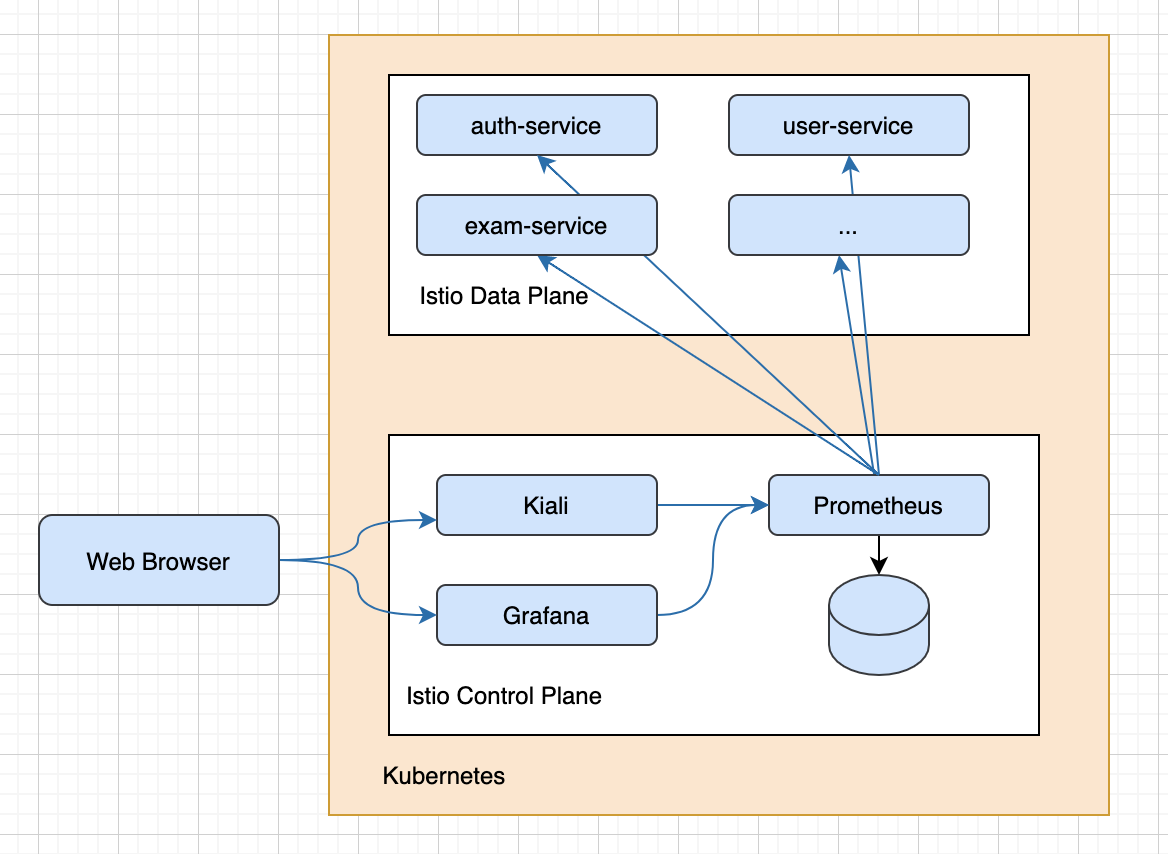
流程如下:
主要依賴:
* `implementation 'org.springframework.boot:spring-boot-starter-actuator'`
* `implementation("io.micrometer:micrometer-registry-prometheus")`
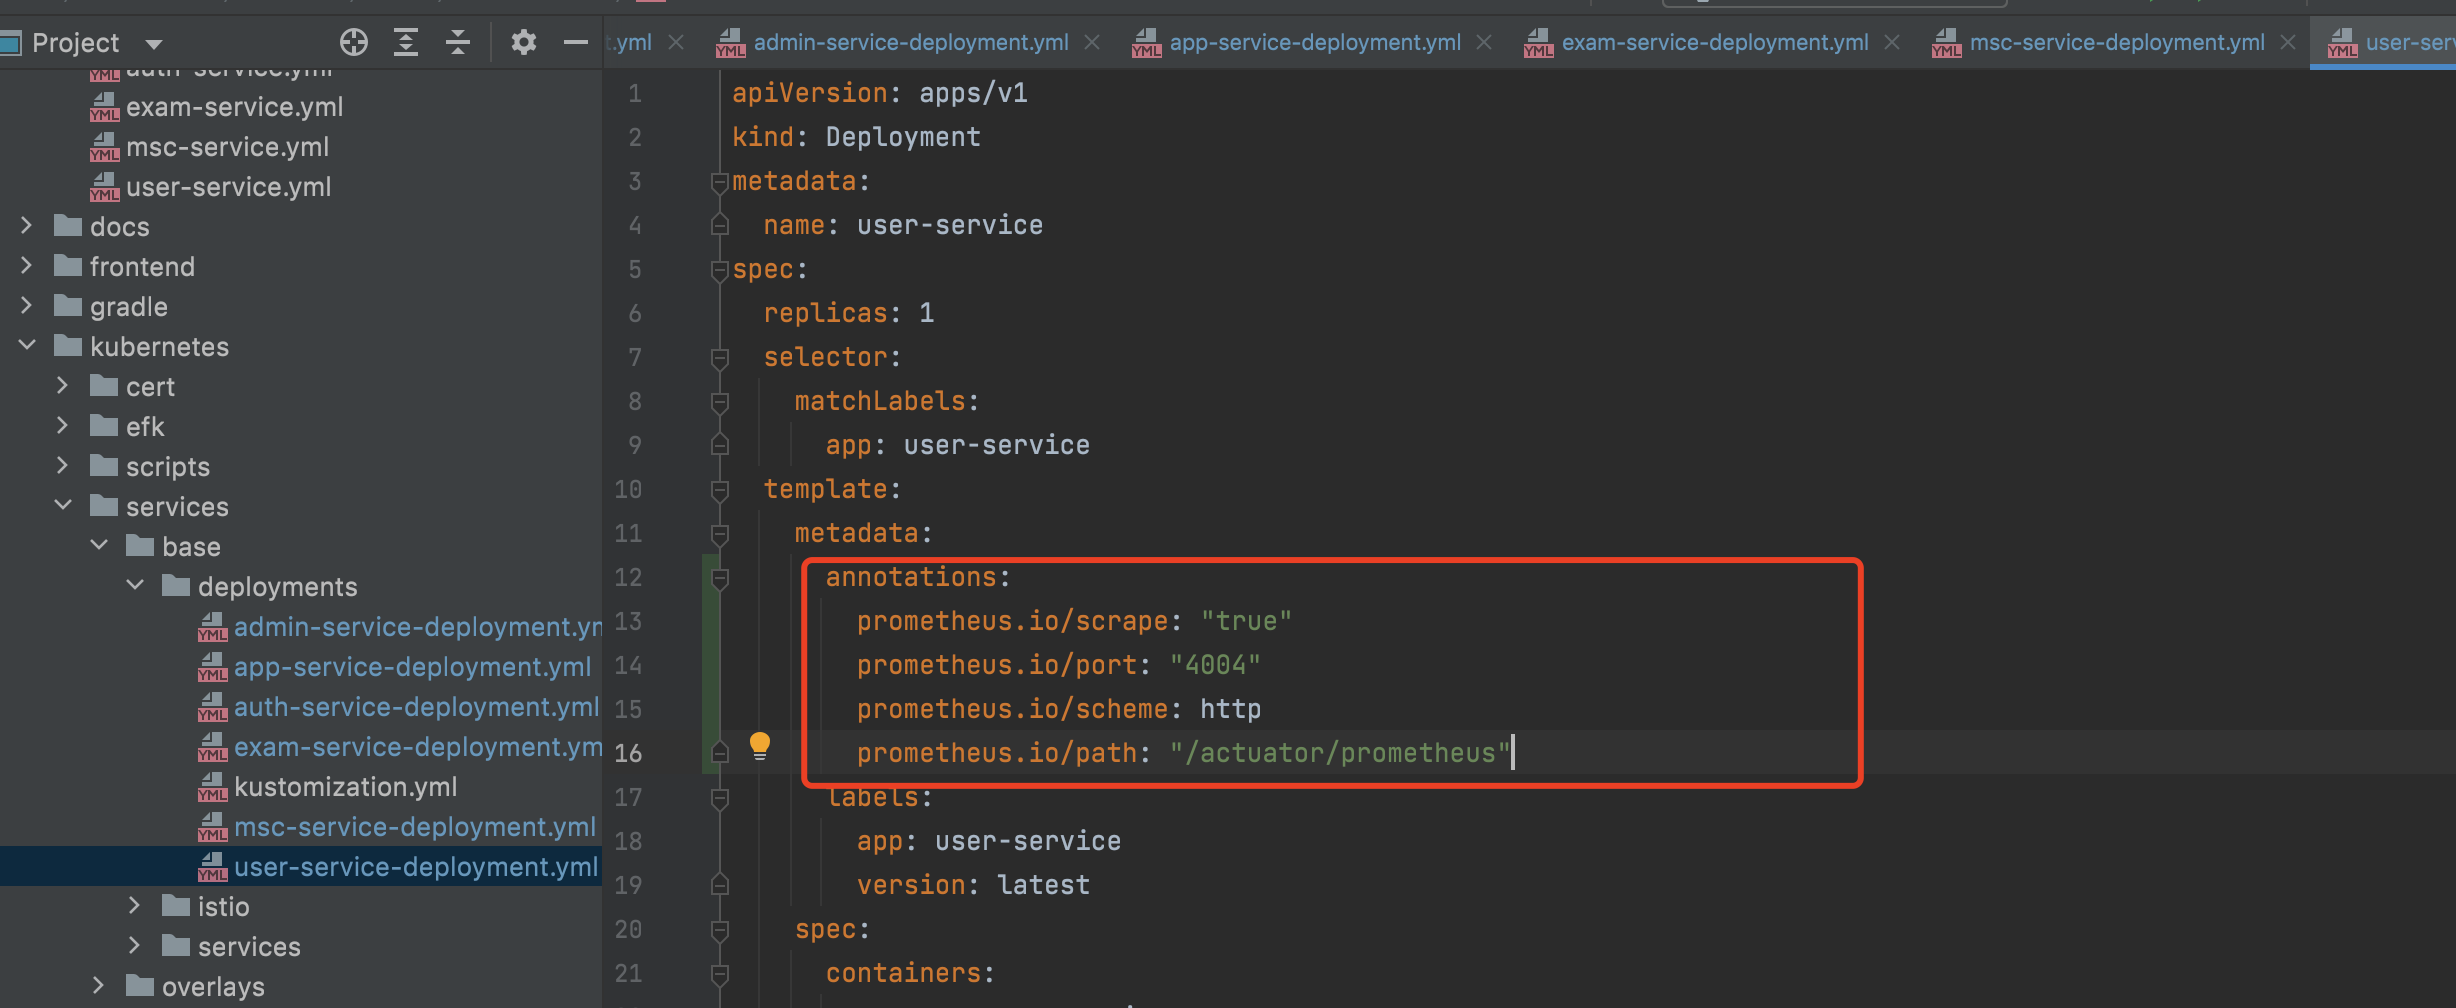
各服務通過`/actuator/prometheus`暴露服務指標
具體配置見:`kubernetes/services/base/deployments`
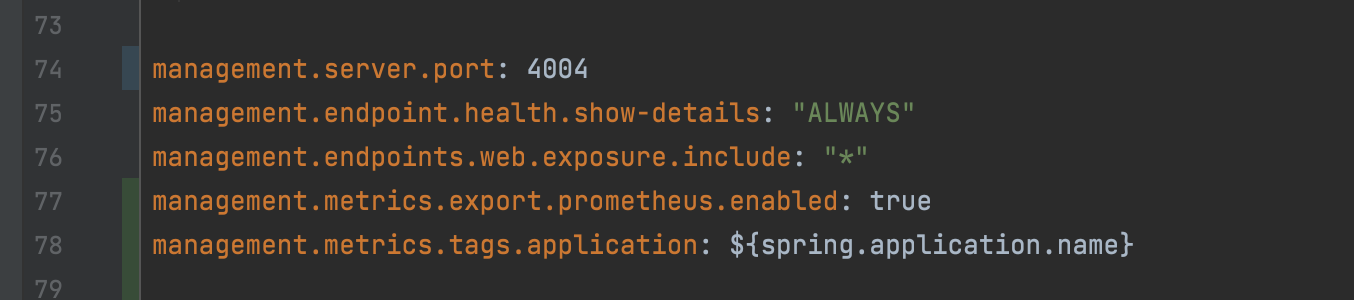
`application.yml`配置:
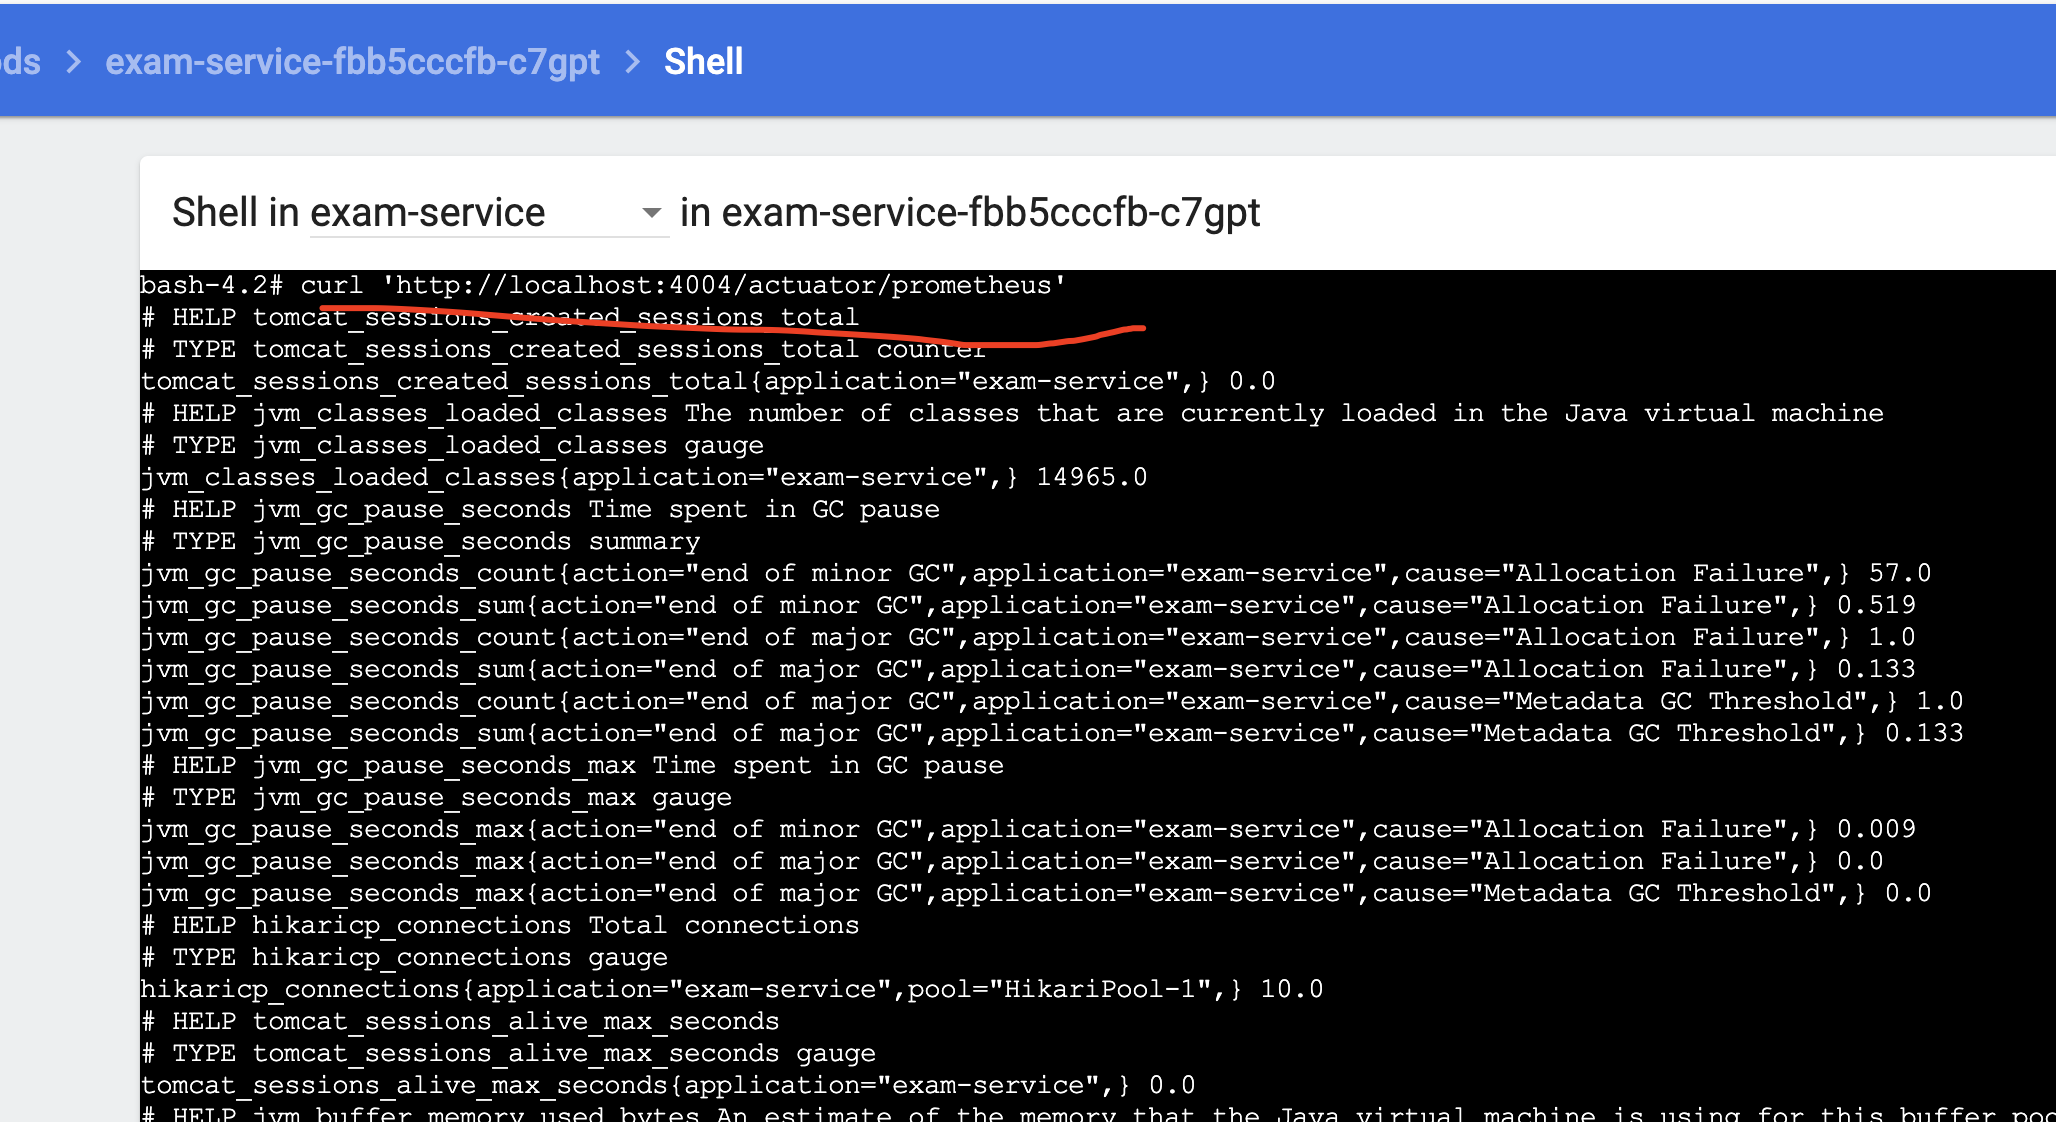
可以在容器內curl確認prometheus指標是否上報成功:
```
$ curl 'http://localhost:4004/actuator/prometheus'
```
# 二、配置Grafana Dashboards
打開Grafana Dashboards
```
$ istioctl dashboard grafana
```
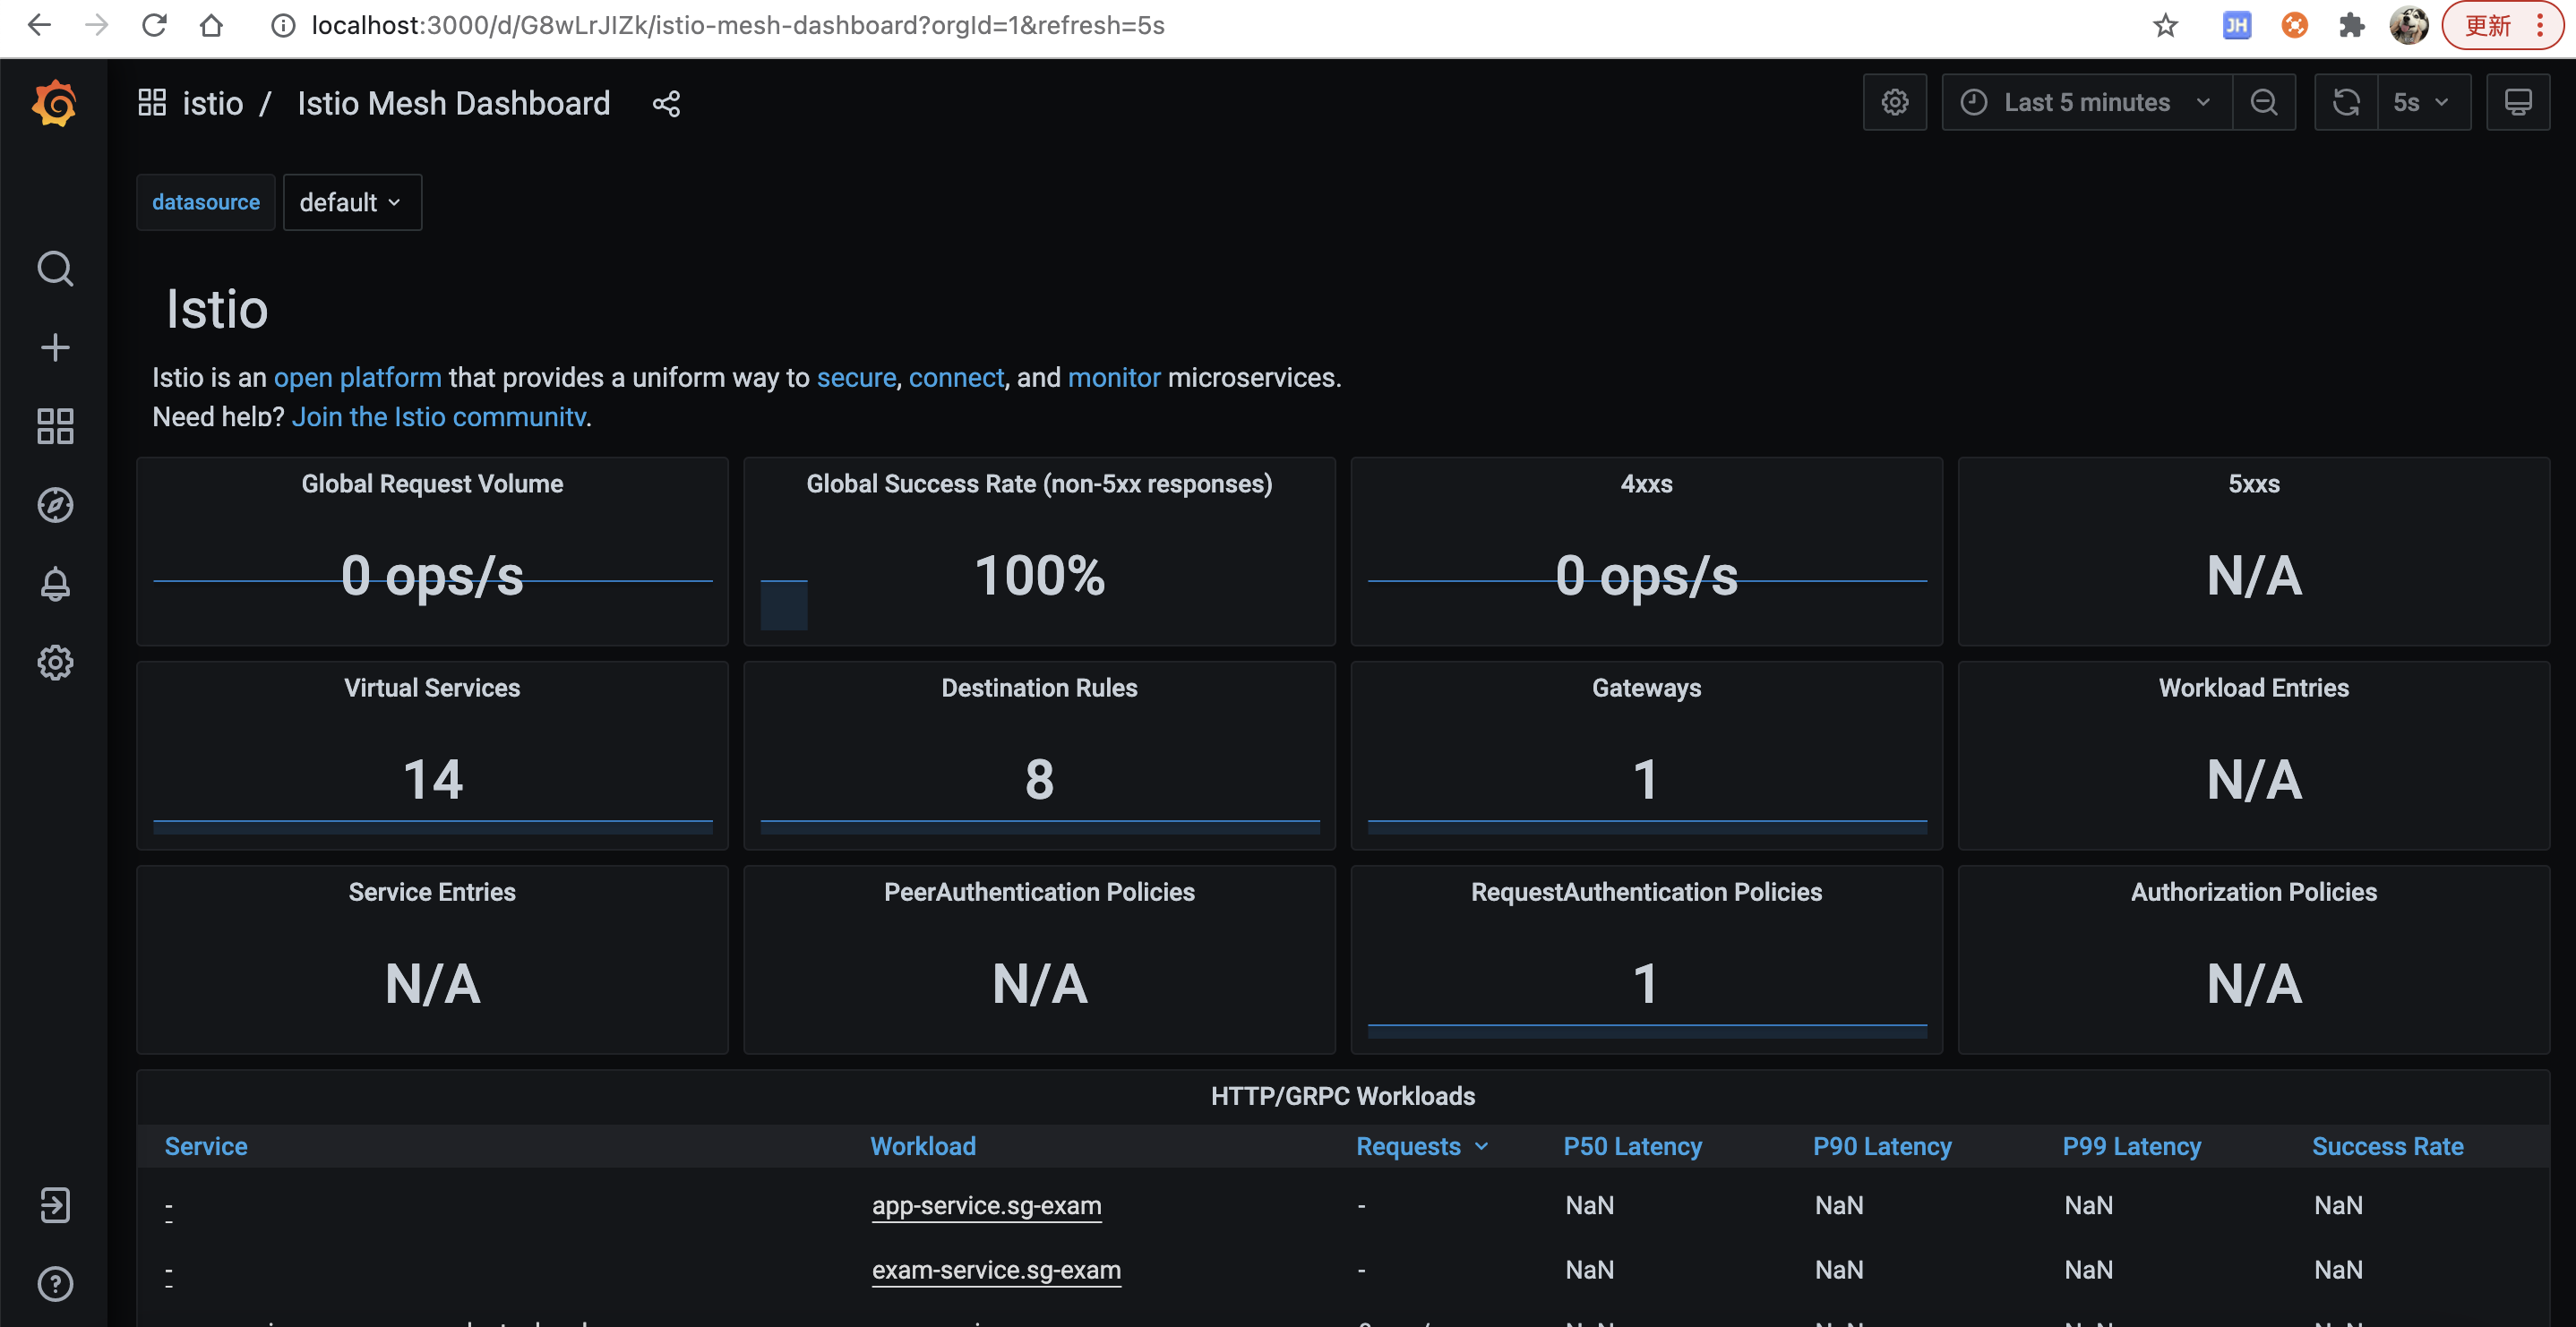
訪問[http://localhost:3000/dashboard/new?layout=list&search=open&orgId=1](http://localhost:3000/dashboard/new?layout=list&search=open&orgId=1)
可以看到服務網格的一些指標
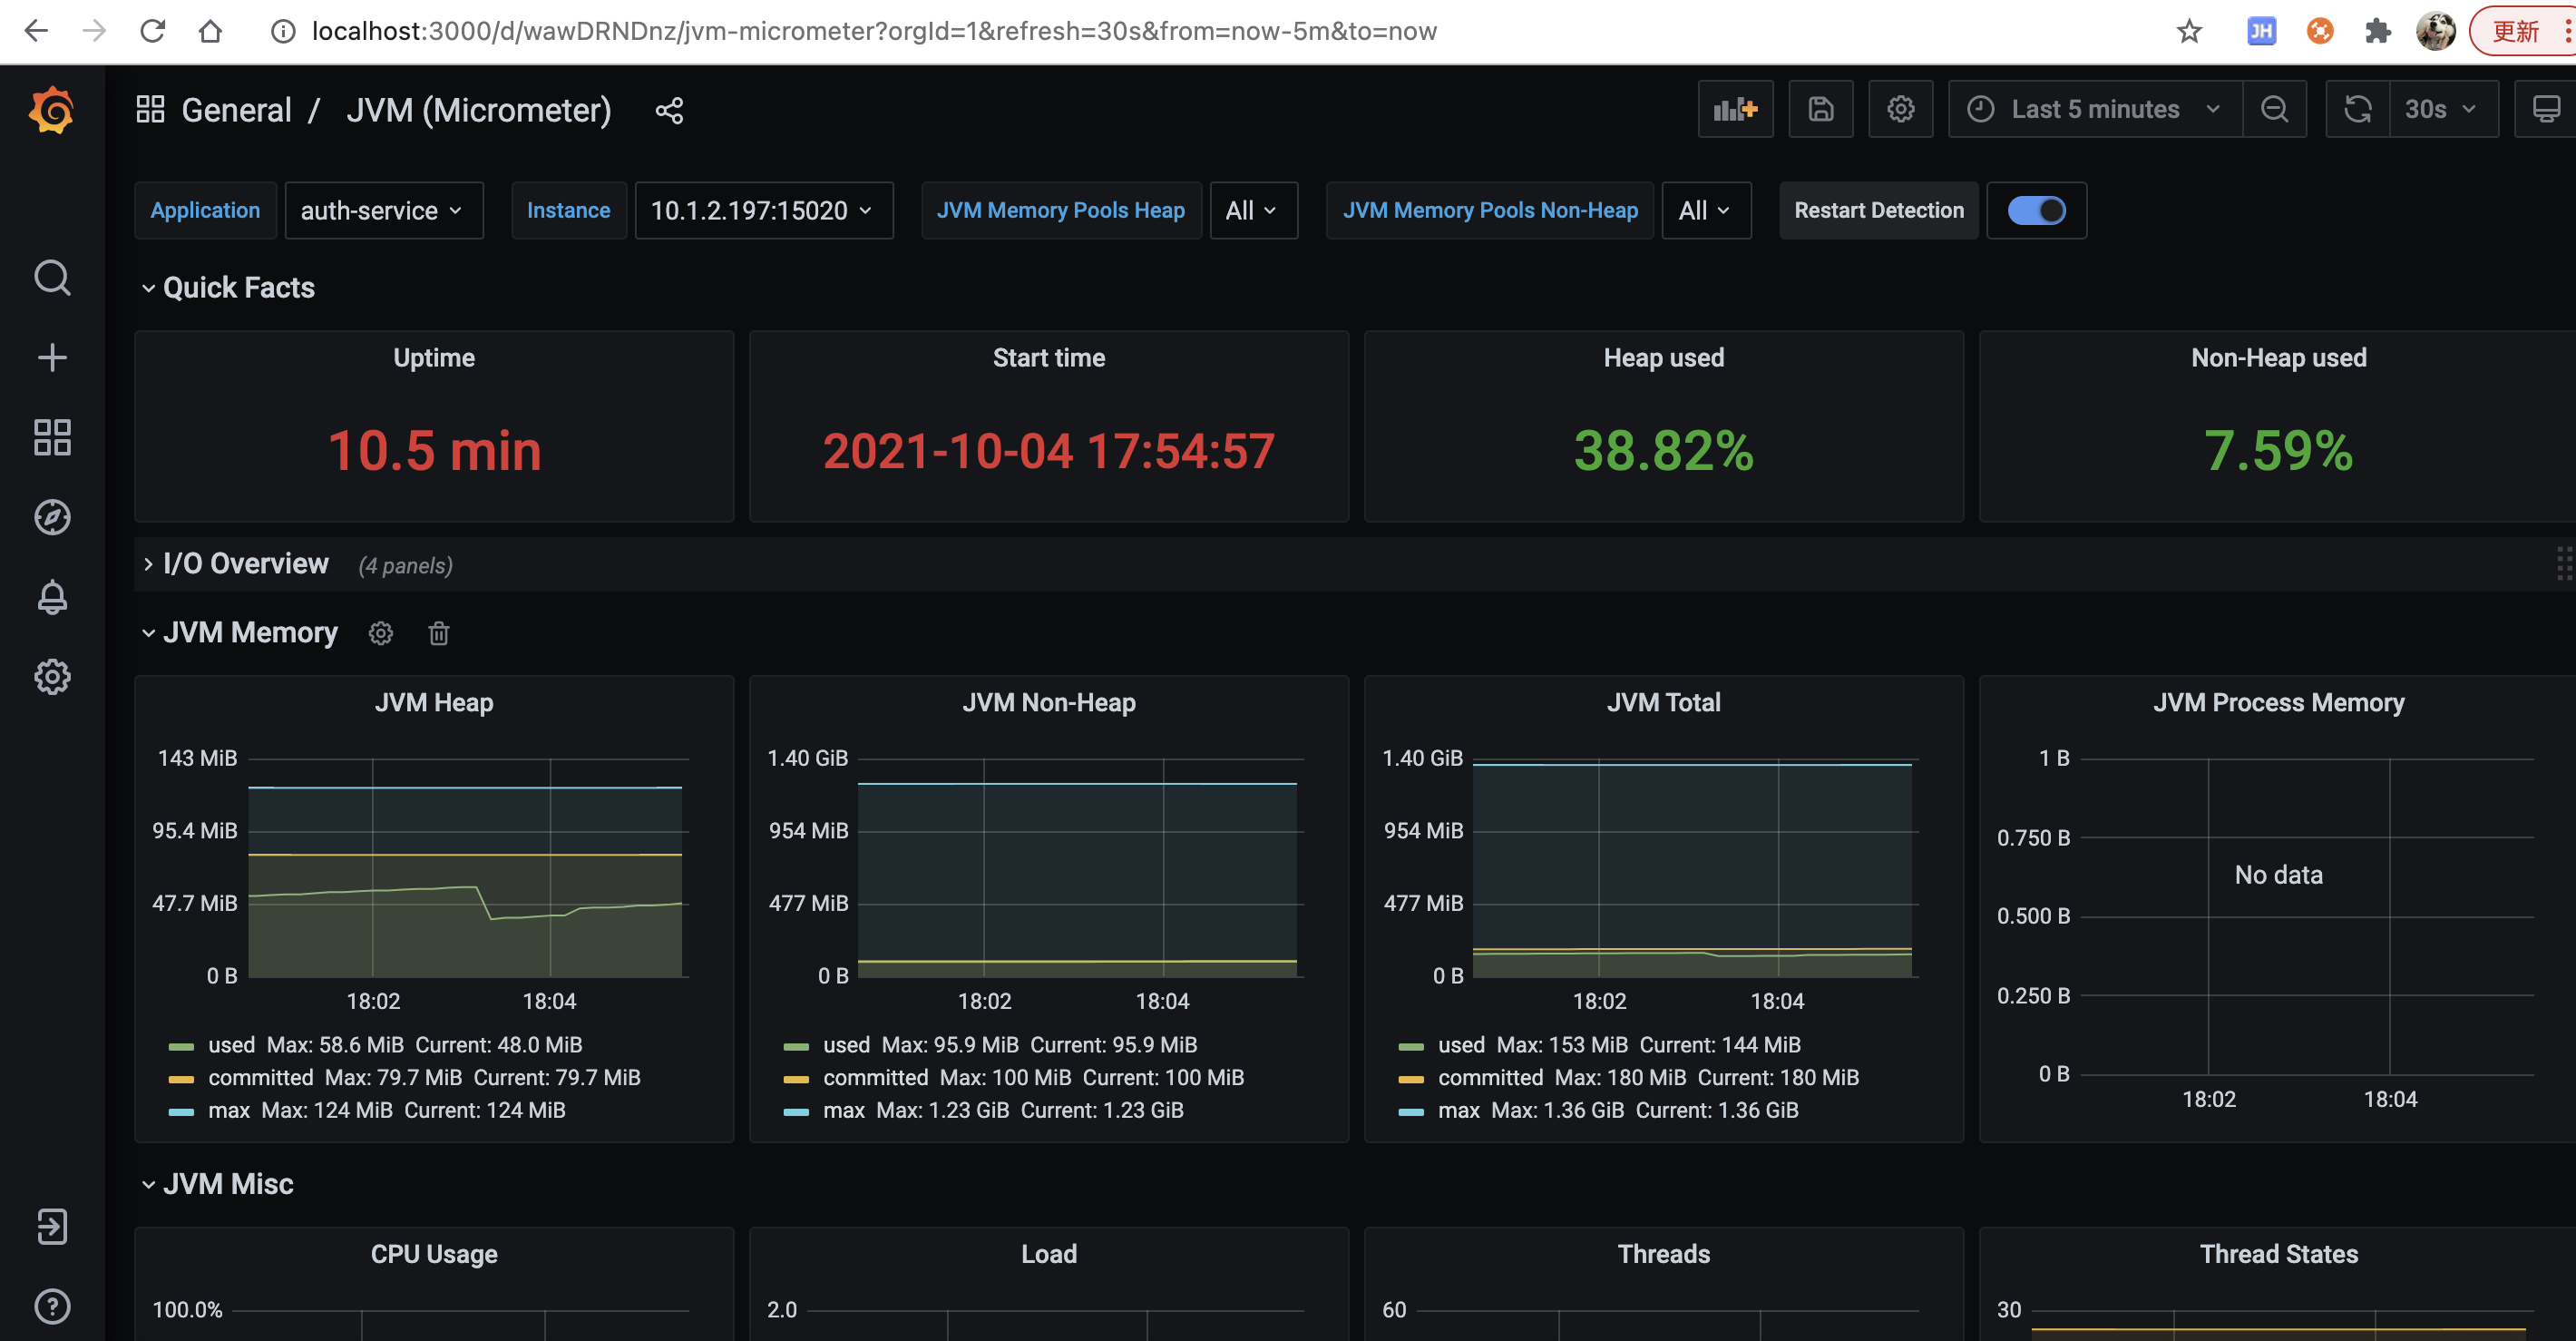
# 三、導入JVM dashboard
主要是JVM的監控dashboard
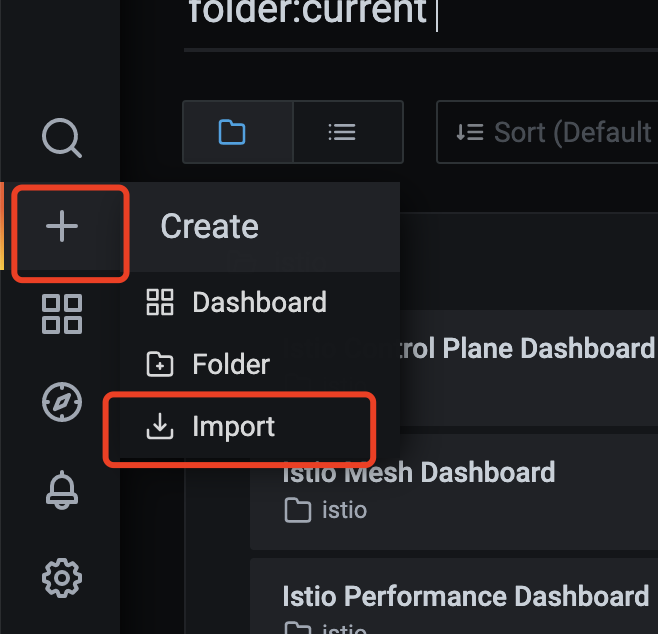
1. 點擊“+”號,選擇import
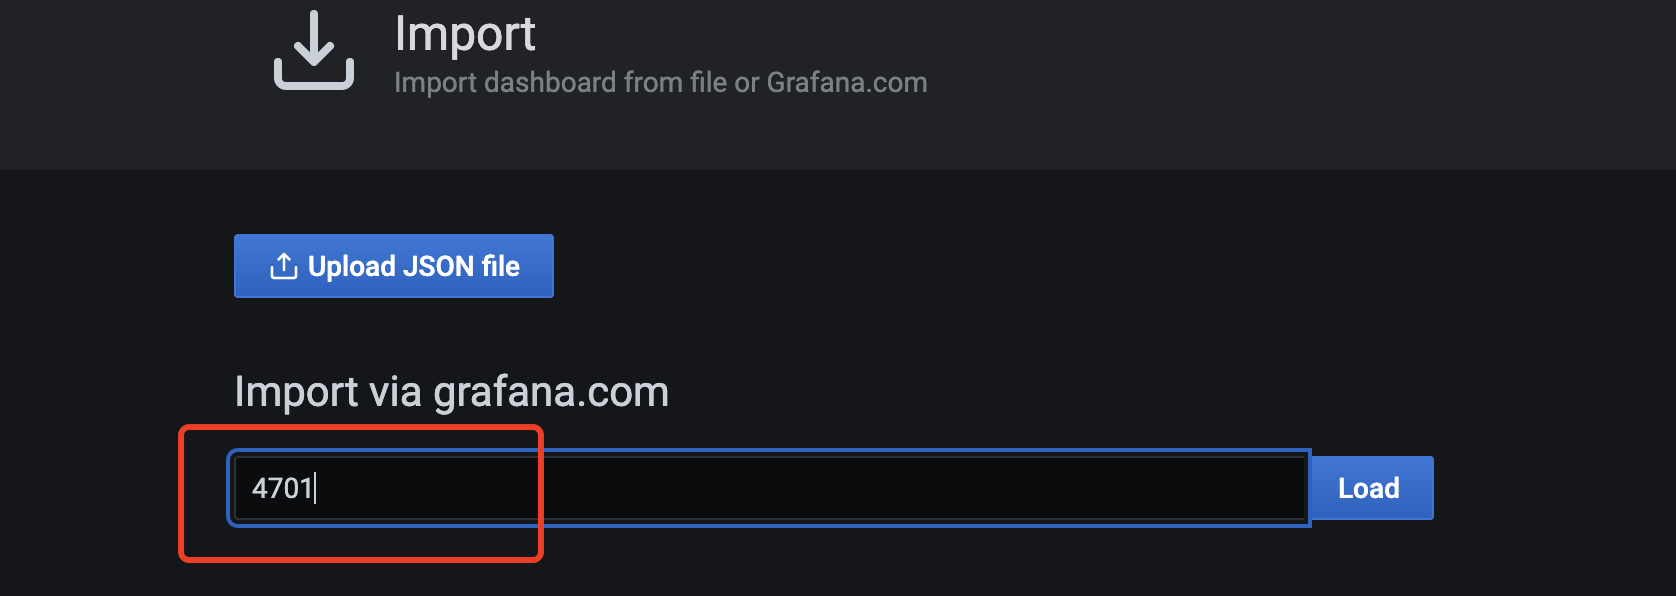
2. 輸入4701,點擊load
3. 可以看到網絡IO、JVM內存、線程等指標的監控
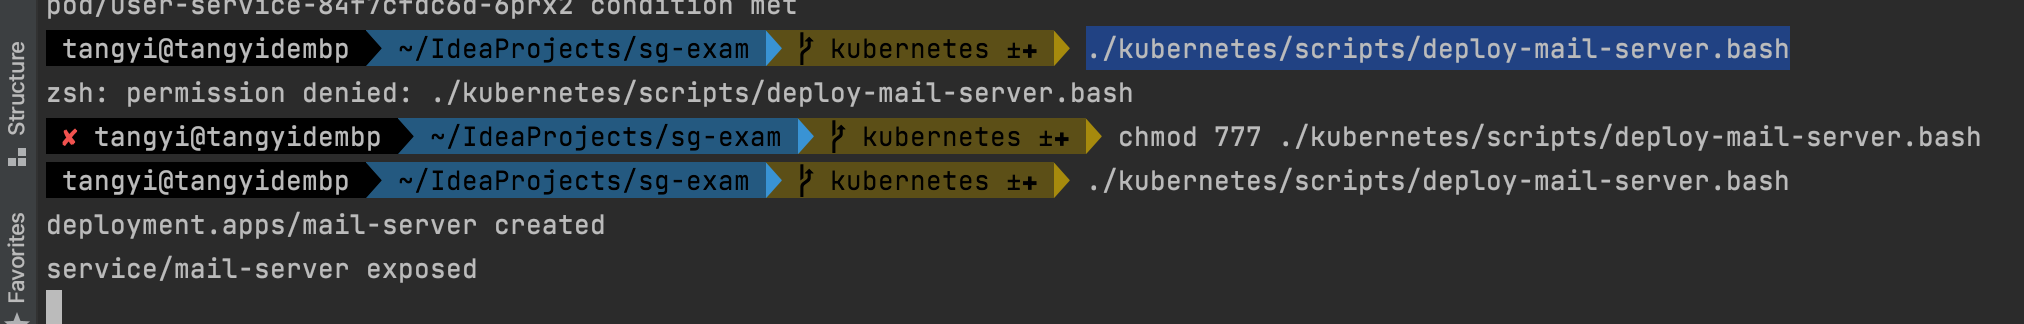
# 四、發送告警郵件
執行腳本:
```
$ ./kubernetes/scripts/deploy-mail-server.bash
```
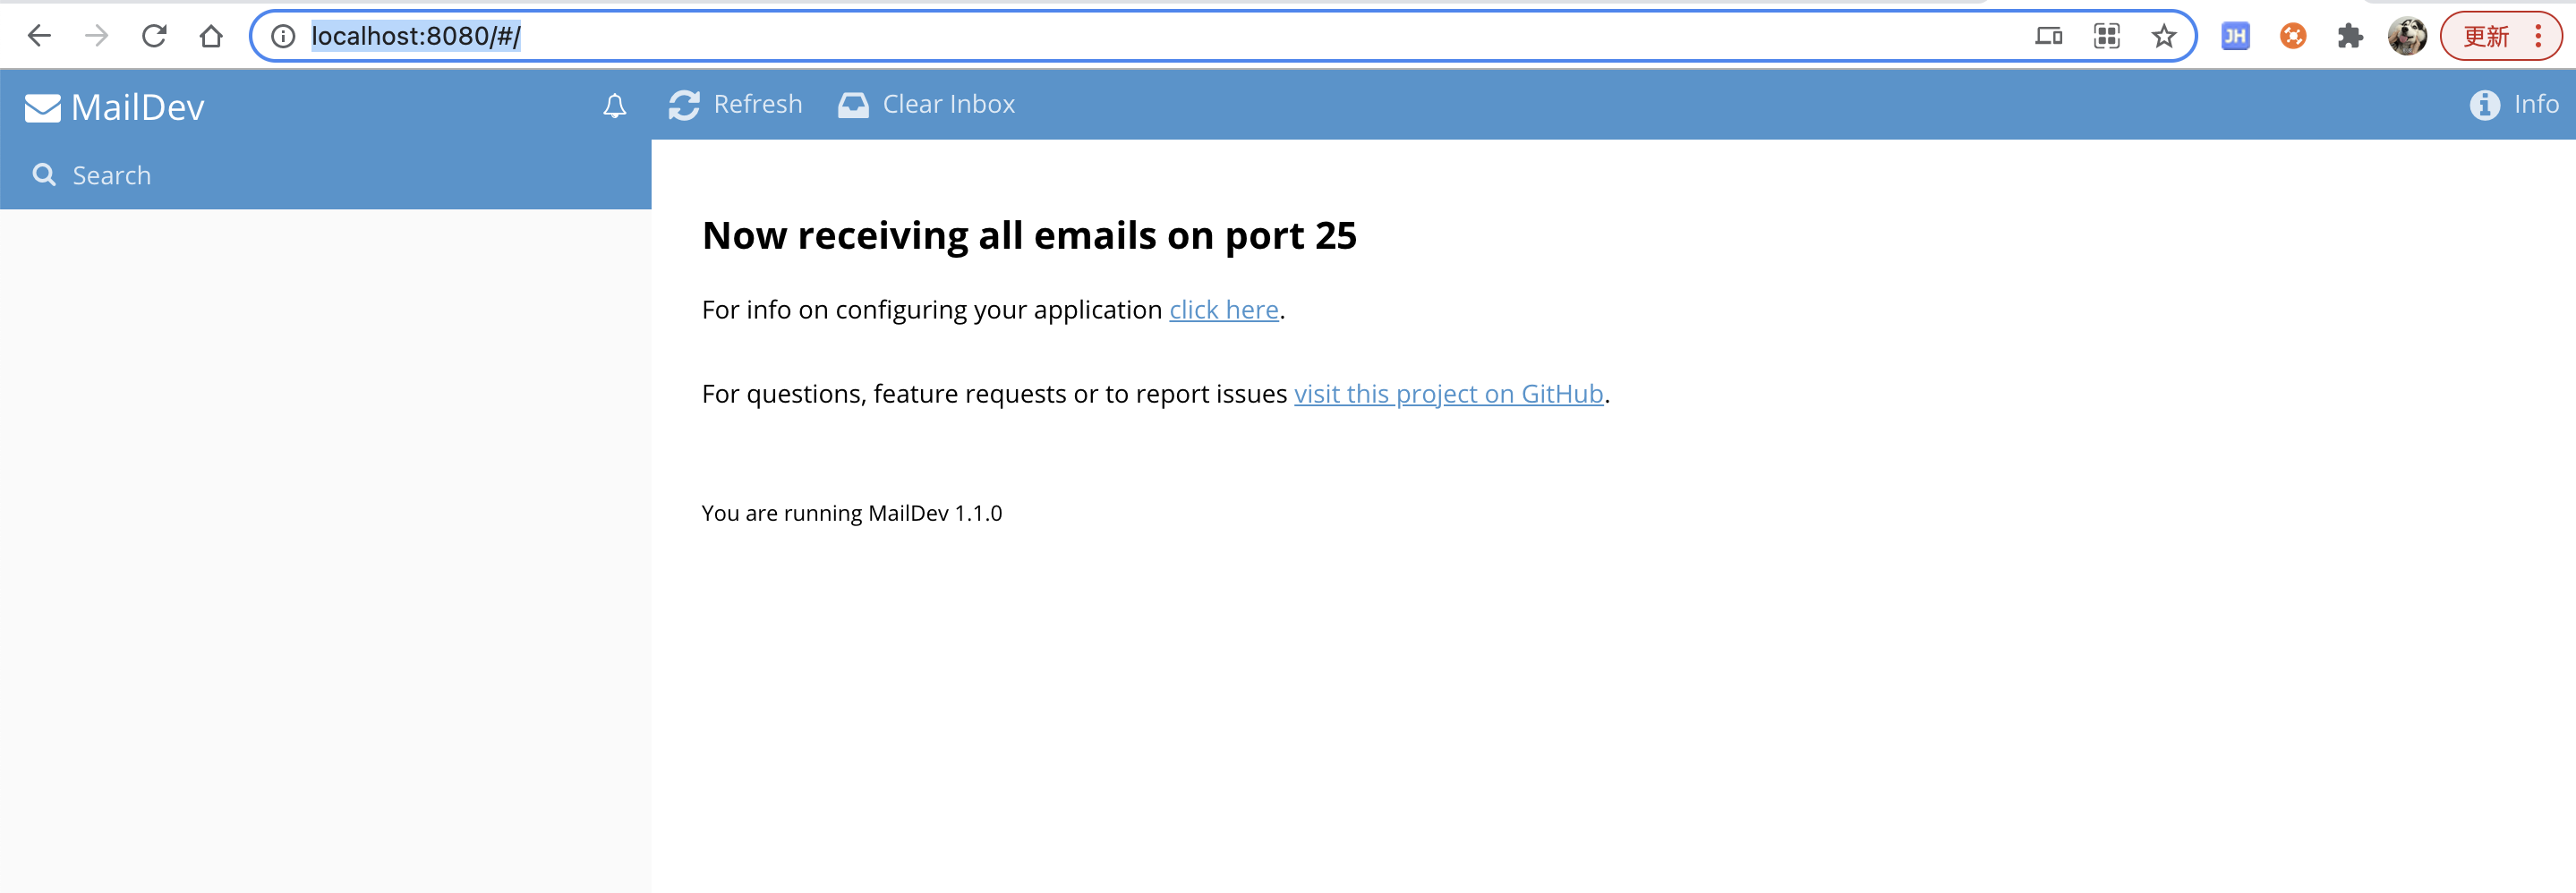
訪問`http://localhost:8080/#/`
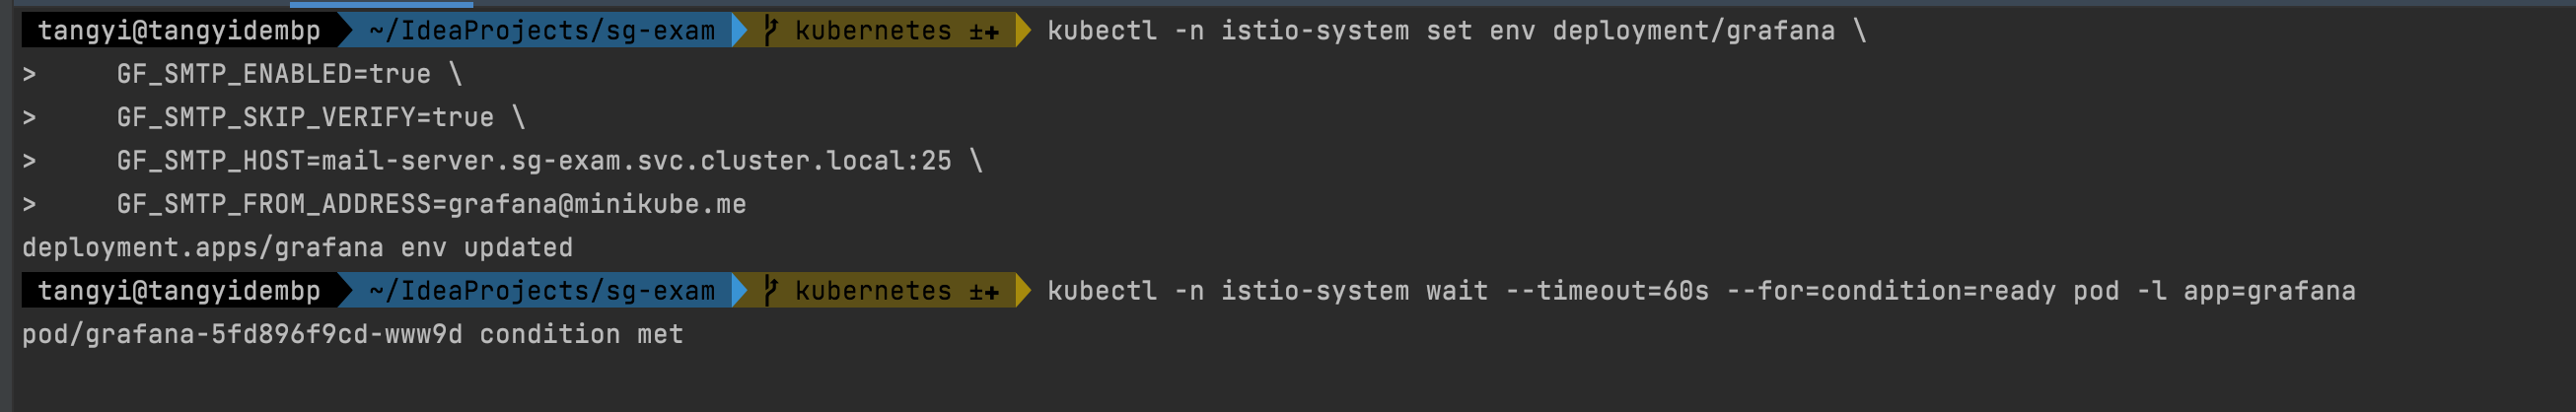
配置Grafana發送郵件到mail server,執行以下命令:
```
$ kubectl -n istio-system set env deployment/grafana \
GF_SMTP_ENABLED=true \
GF_SMTP_SKIP_VERIFY=true \
GF_SMTP_HOST=mail-server.sg-exam.svc.cluster.local:25 \
GF_SMTP_FROM_ADDRESS=grafana@minikube.me
$ kubectl -n istio-system wait --timeout=60s --for=condition=ready pod -l app=grafana
```
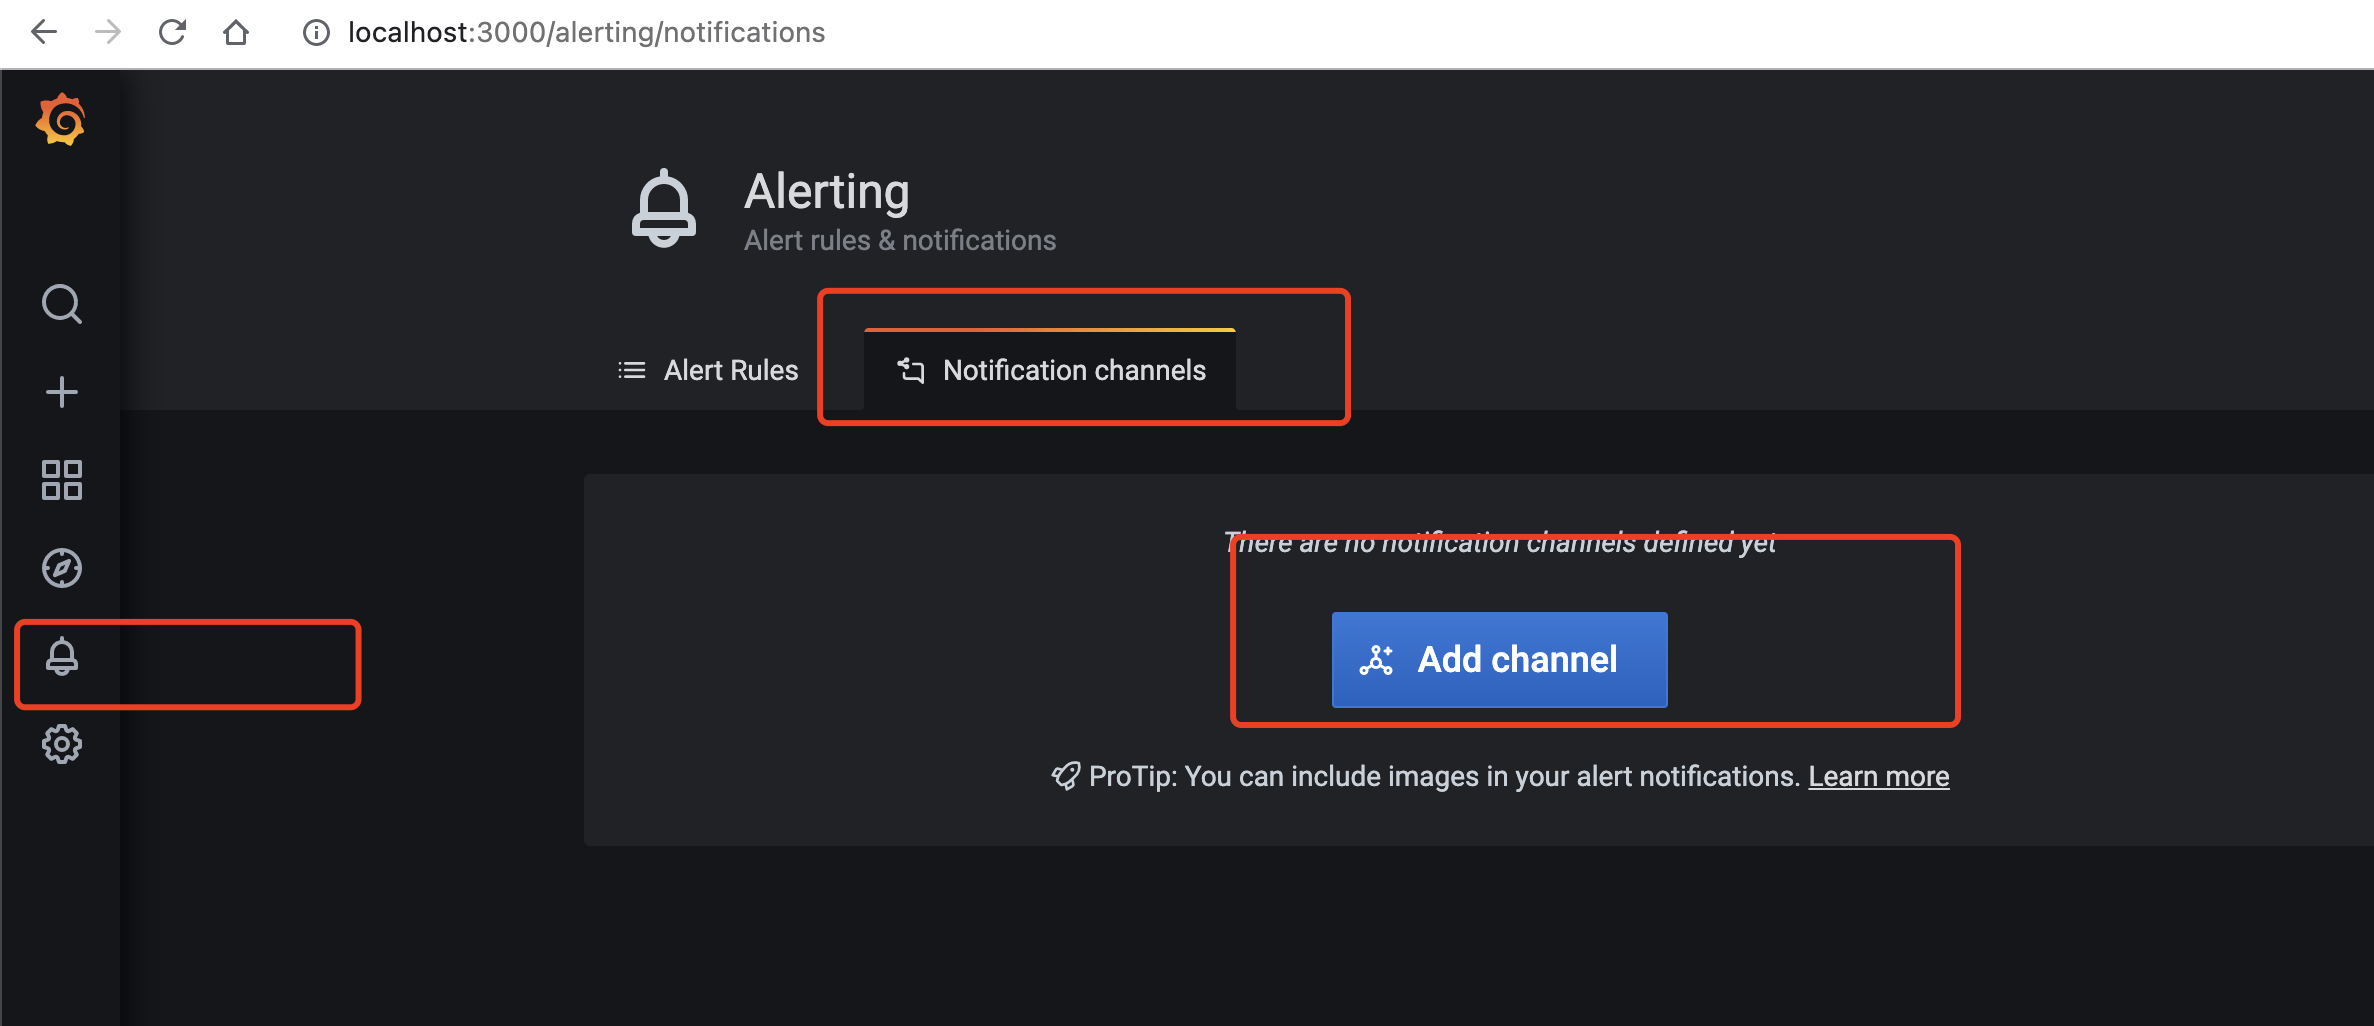
配置Grafana發送告警郵件
# 五、Elasticsearch監控
主要是監控日志收集的es集群
1. 下載并運行最新版本cerebro: [https://github.com/lmenezes/cerebro/releases](https://github.com/lmenezes/cerebro/releases)
訪問:[http://localhost:9000/](http://localhost:9000/)
2. 輸入es集群的地址
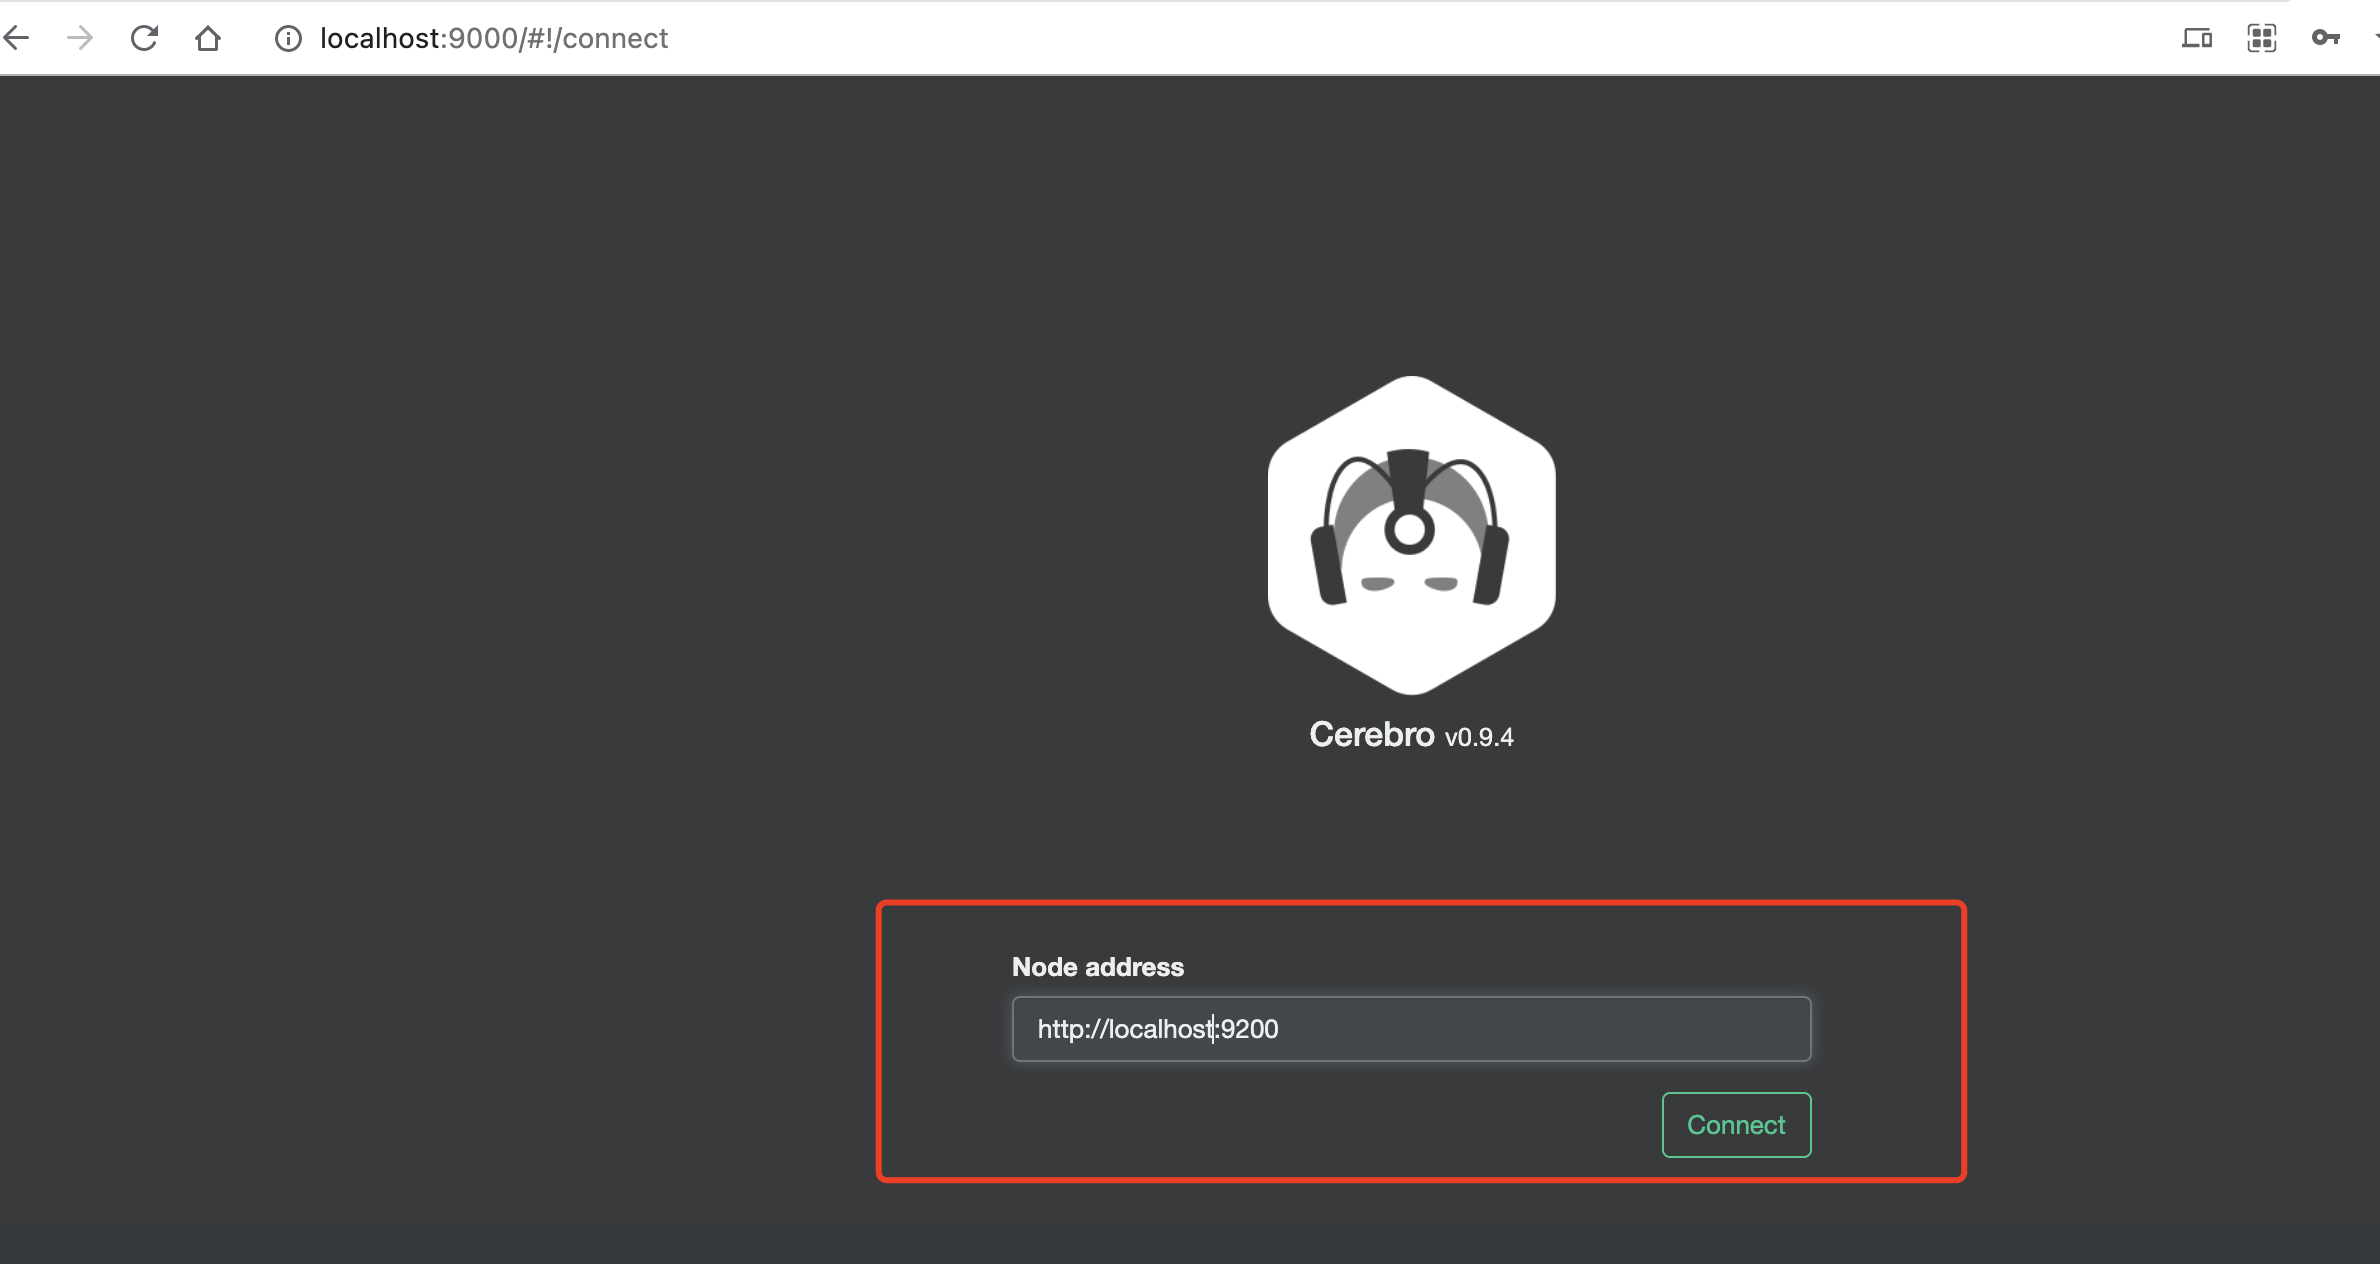
點擊connect
3. 效果
可以監控到es集群、索引等指標,cerebro還是非常強大的,其它功能的具體使用參考官方wiki
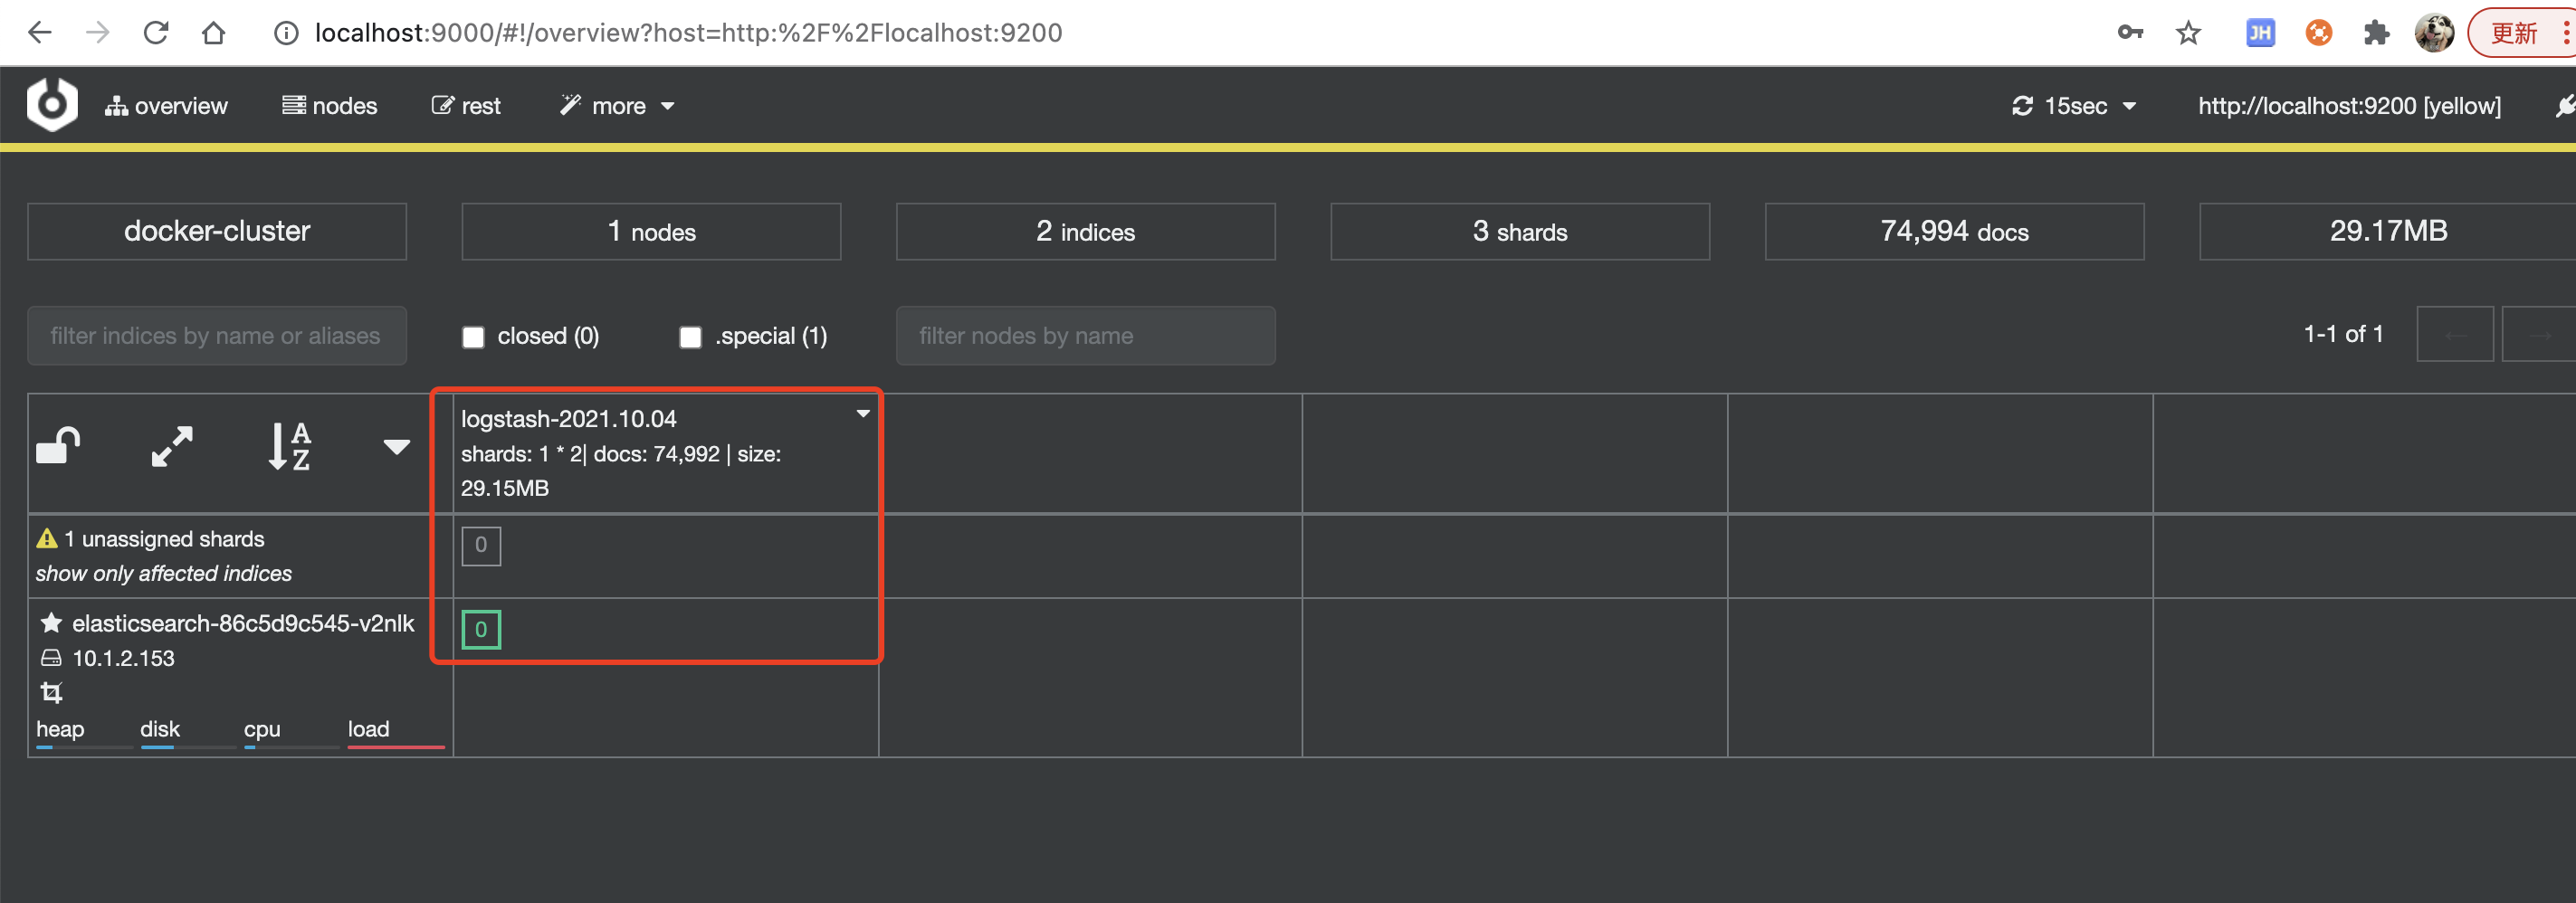
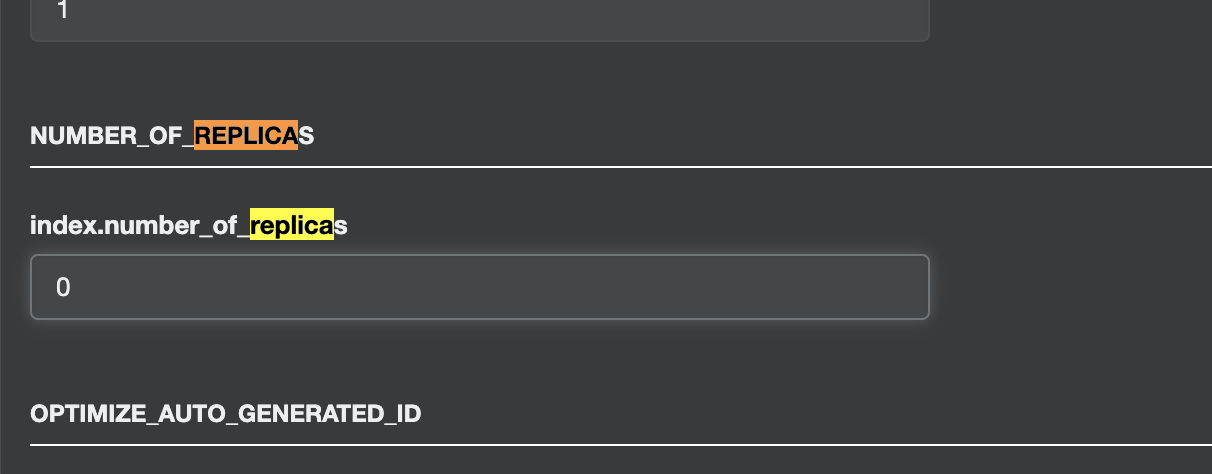
集群變黃色是因為部署的es集群為單節點,副本分片分配不了,但不影響使用,可修改副本數解決,點擊索引->index settings
修改index.number_of_replicas為0