
## JMH是什么
JMH(Java Microbenchmark Harness)是用于代碼微基準測試的工具套件,主要是基于方法層面的基準測試,精度可以達到納秒級。該工具是由 Oracle 內部實現 JIT 的大牛們編寫的,他們應該比任何人都了解 JIT 以及 JVM 對于基準測試的影響。
## 應用場景
1. 想準確地知道某個方法需要執行多長時間,以及執行時間和輸入之間的相關性
2. 對比接口不同實現在給定條件下的吞吐量
3. 查看多少百分比的請求在多長時間內完成
## 如何使用
1. 引入依賴,jdk9自帶,低于9的版本需要自行引入
~~~
<dependency>
<groupId>org.openjdk.jmh</groupId>
<artifactId>jmh-core</artifactId>
<version>1.23</version>
</dependency>
<dependency>
<groupId>org.openjdk.jmh</groupId>
<artifactId>jmh-generator-annprocess</artifactId>
<version>1.23</version>
</dependency>
~~~
2. 對比使用`+`號連接字符串和`StringBuilder.append()`連接字符串的性能
~~~
@BenchmarkMode(Mode.AverageTime)
@Warmup(iterations = 3, time = 1)
@Measurement(iterations = 5, time = 5)
@Threads(4)
@Fork(1)
@State(value = Scope.Benchmark)
@OutputTimeUnit(TimeUnit.NANOSECONDS)
public class StringConnectTest {
@Param(value = {"10", "50", "100"})
private int length;
@Benchmark
public void testStringAdd(Blackhole blackhole) {
String a = "";
for (int i = 0; i < length; i++) {
a += i;
}
blackhole.consume(a);
}
@Benchmark
public void testStringBuilderAdd(Blackhole blackhole) {
StringBuilder sb = new StringBuilder();
for (int i = 0; i < length; i++) {
sb.append(i);
}
blackhole.consume(sb.toString());
}
public static void main(String[] args) throws RunnerException {
Options opt = new OptionsBuilder()
.include(StringConnectTest.class.getSimpleName())
.result("result.json")
.resultFormat(ResultFormatType.JSON).build();
new Runner(opt).run();
}
}
~~~
3. 運行后得出如下輸出,且會保持結果數據到`result.json`中
過程信息如下:(其中一段)
```
# JMH version: 1.23
# VM version: JDK 1.8.0_221, Java HotSpot(TM) 64-Bit Server VM, 25.221-b11
# VM invoker: /Library/Java/JavaVirtualMachines/jdk1.8.0_221.jdk/Contents/Home/jre/bin/java
# VM options: -javaagent:/Applications/IntelliJ IDEA CE.app/Contents/lib/idea_rt.jar=59182:/Applications/IntelliJ IDEA CE.app/Contents/bin -Dfile.encoding=UTF-8
# Warmup: 3 iterations, 1 s each
# Measurement: 5 iterations, 5 s each
# Timeout: 10 min per iteration
# Threads: 4 threads, will synchronize iterations
# Benchmark mode: Average time, time/op
# Benchmark: org.mango.demo.mt.jmh.StringConnectTest.testStringBuilderAdd
# Parameters: (length = 100)
# Run progress: 83.33% complete, ETA 00:00:29
# Fork: 1 of 1
# Warmup Iteration 1: 2834.364 ±(99.9%) 1230.495 ns/op
# Warmup Iteration 2: 2350.791 ±(99.9%) 397.253 ns/op
# Warmup Iteration 3: 2150.000 ±(99.9%) 642.696 ns/op
Iteration 1: 2174.173 ±(99.9%) 343.439 ns/op
Iteration 2: 2256.638 ±(99.9%) 85.831 ns/op
Iteration 3: 4466.223 ±(99.9%) 161.050 ns/op
Iteration 4: 2378.494 ±(99.9%) 107.129 ns/op
Iteration 5: 2259.465 ±(99.9%) 398.071 ns/op
Result "org.mango.demo.mt.jmh.StringConnectTest.testStringBuilderAdd":
2706.999 ±(99.9%) 3797.231 ns/op [Average]
(min, avg, max) = (2174.173, 2706.999, 4466.223), stdev = 986.129
CI (99.9%): [≈ 0, 6504.229] (assumes normal distribution)
# Run complete. Total time: 00:02:55
```
結果信息輸出如下:
```
REMEMBER: The numbers below are just data. To gain reusable insights, you need to follow up on
why the numbers are the way they are. Use profilers (see -prof, -lprof), design factorial
experiments, perform baseline and negative tests that provide experimental control, make sure
the benchmarking environment is safe on JVM/OS/HW level, ask for reviews from the domain experts.
Do not assume the numbers tell you what you want them to tell.
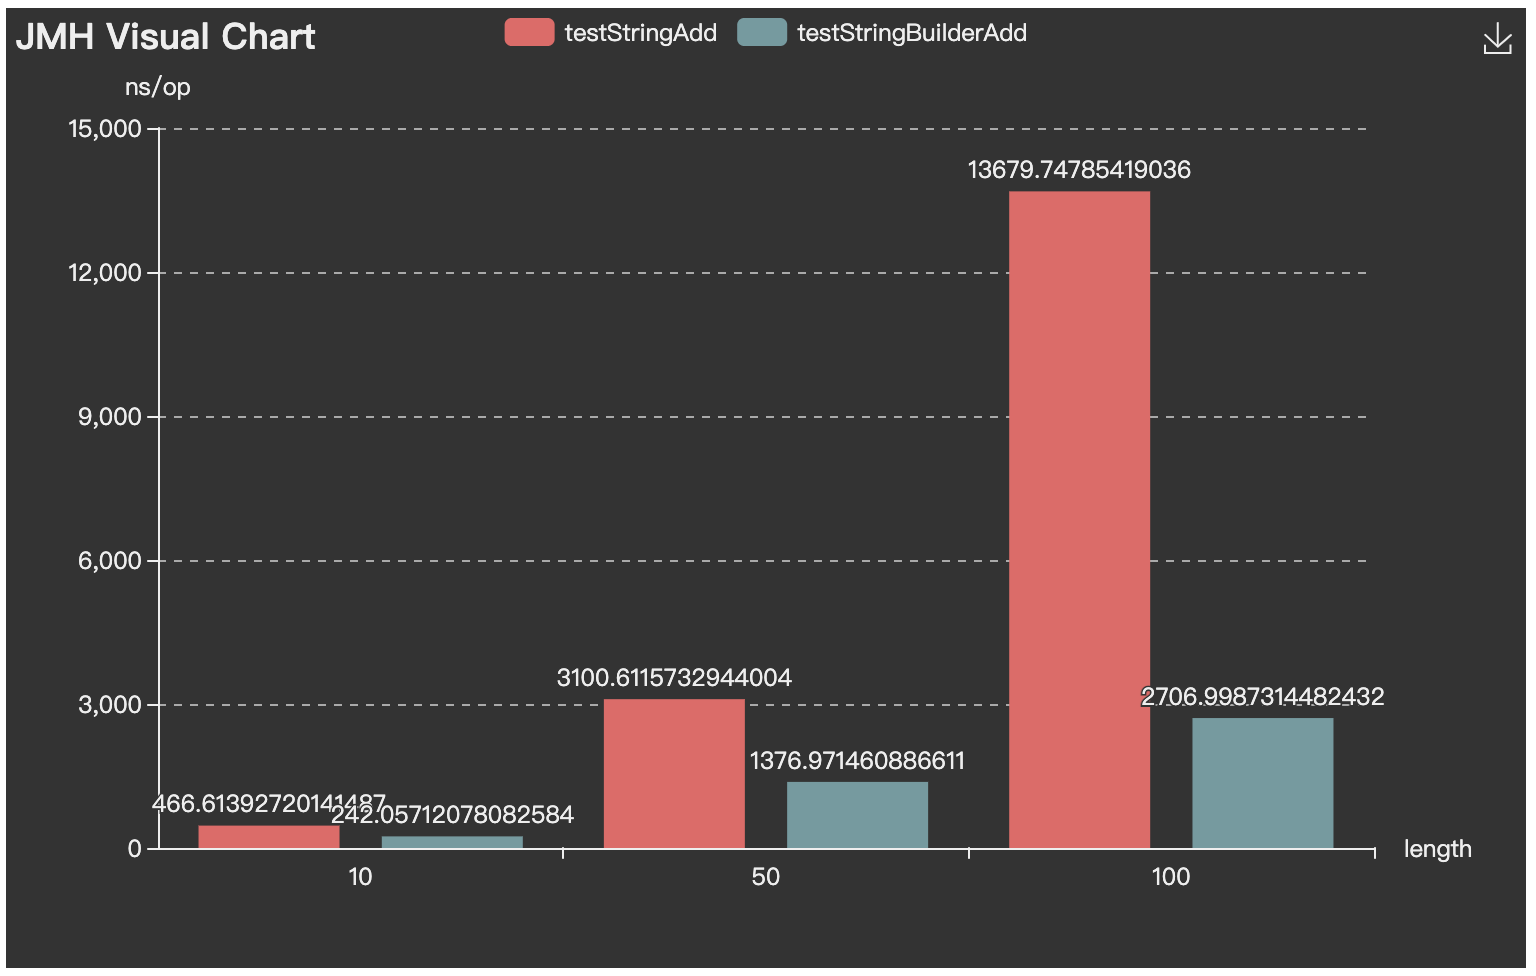
Benchmark (length) Mode Cnt Score Error Units
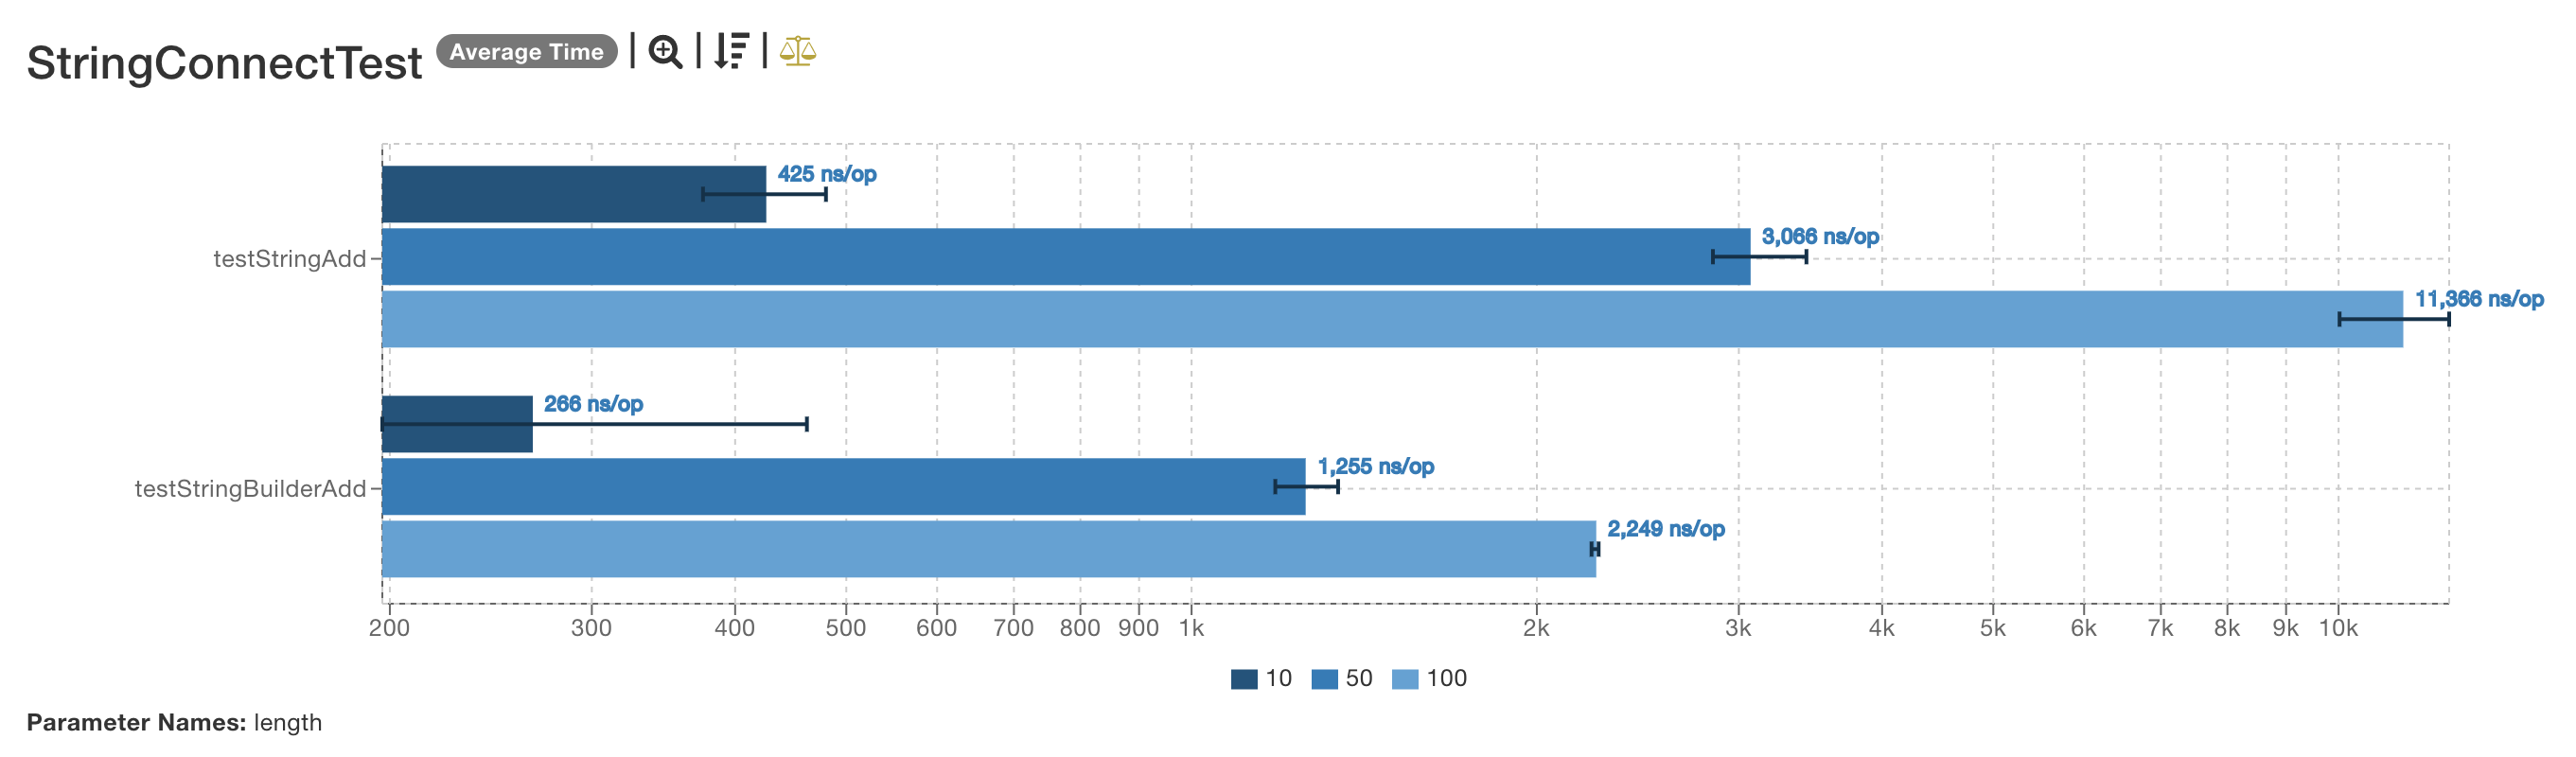
StringConnectTest.testStringAdd 10 avgt 5 466.614 ± 578.636 ns/op
StringConnectTest.testStringAdd 50 avgt 5 3100.612 ± 246.366 ns/op
StringConnectTest.testStringAdd 100 avgt 5 13679.748 ± 10239.498 ns/op
StringConnectTest.testStringBuilderAdd 10 avgt 5 242.057 ± 240.442 ns/op
StringConnectTest.testStringBuilderAdd 50 avgt 5 1376.971 ± 1211.945 ns/op
StringConnectTest.testStringBuilderAdd 100 avgt 5 2706.999 ± 3797.231 ns/op
Benchmark result is saved to result.json
```
## 結果可視化
http://deepoove.com/jmh-visual-chart/:
https://jmh.morethan.io/:
## jar包方式部署運行
小型的測試,直接本地運行Main方法測試即可;但是對于一些特定環境或者大型測試,需要放到服務器上跑才行,所以需要jar包方式運行。
使用Maven打包插件得到jar包
~~~
<plugin>
<groupId>org.apache.maven.plugins</groupId>
<artifactId>maven-shade-plugin</artifactId>
<version>2.4.1</version>
<executions>
<execution>
<phase>package</phase>
<goals>
<goal>shade</goal>
</goals>
<configuration>
<finalName>jmh-demo</finalName>
<transformers>
<transformer
implementation="org.apache.maven.plugins.shade.resource.ManifestResourceTransformer">
<mainClass>org.openjdk.jmh.Main</mainClass>
</transformer>
</transformers>
</configuration>
</execution>
</executions>
</plugin>
~~~
執行如下命令,運行測試:
```
java -jar jmh-demo.jar StringConnectTest
```
## JMH基礎
為了能夠更好地使用 JMH 的各項功能,下面對 JMH 的基本概念進行講解:
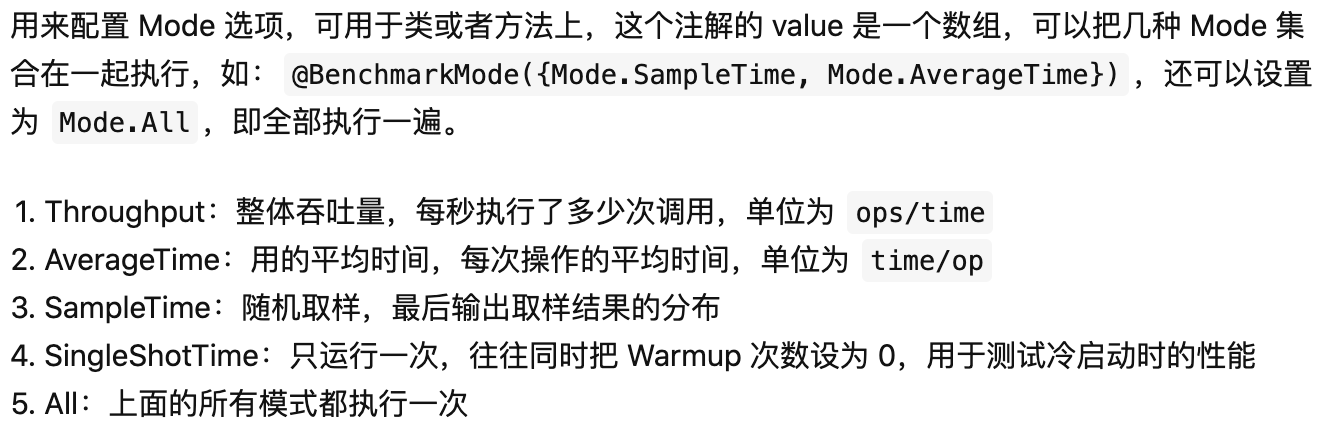
### @BenchmarkMode
### @State

### @OutputTimeUnit
為統計結果的時間單位,可用于類或者方法注解
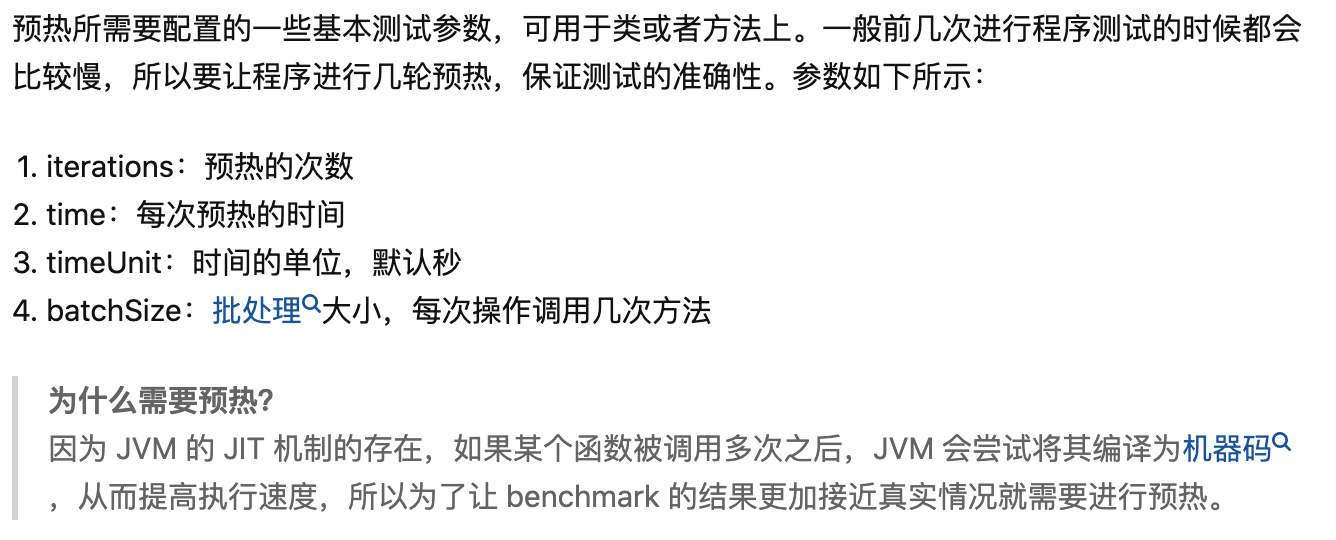
### @Warmup
### @Measurement
實際調用方法所需要配置的一些基本測試參數,可用于類或者方法上,參數和`@Warmup`相同。
### @Threads
每個進程中的測試線程,可用于類或者方法上。
### @Fork
進行 fork 的次數,可用于類或者方法上。如果 fork 數是 2 的話,則 JMH 會 fork 出兩個進程來進行測試。
### @Param
指定某項參數的多種情況,特別適合用來測試一個函數在不同的參數輸入的情況下的性能,只能作用在字段上,使用該注解必須定義 @State 注解。
## JMH插件
idea插件:https://plugins.jetbrains.com/plugin/7529-jmh-java-microbenchmark-harness
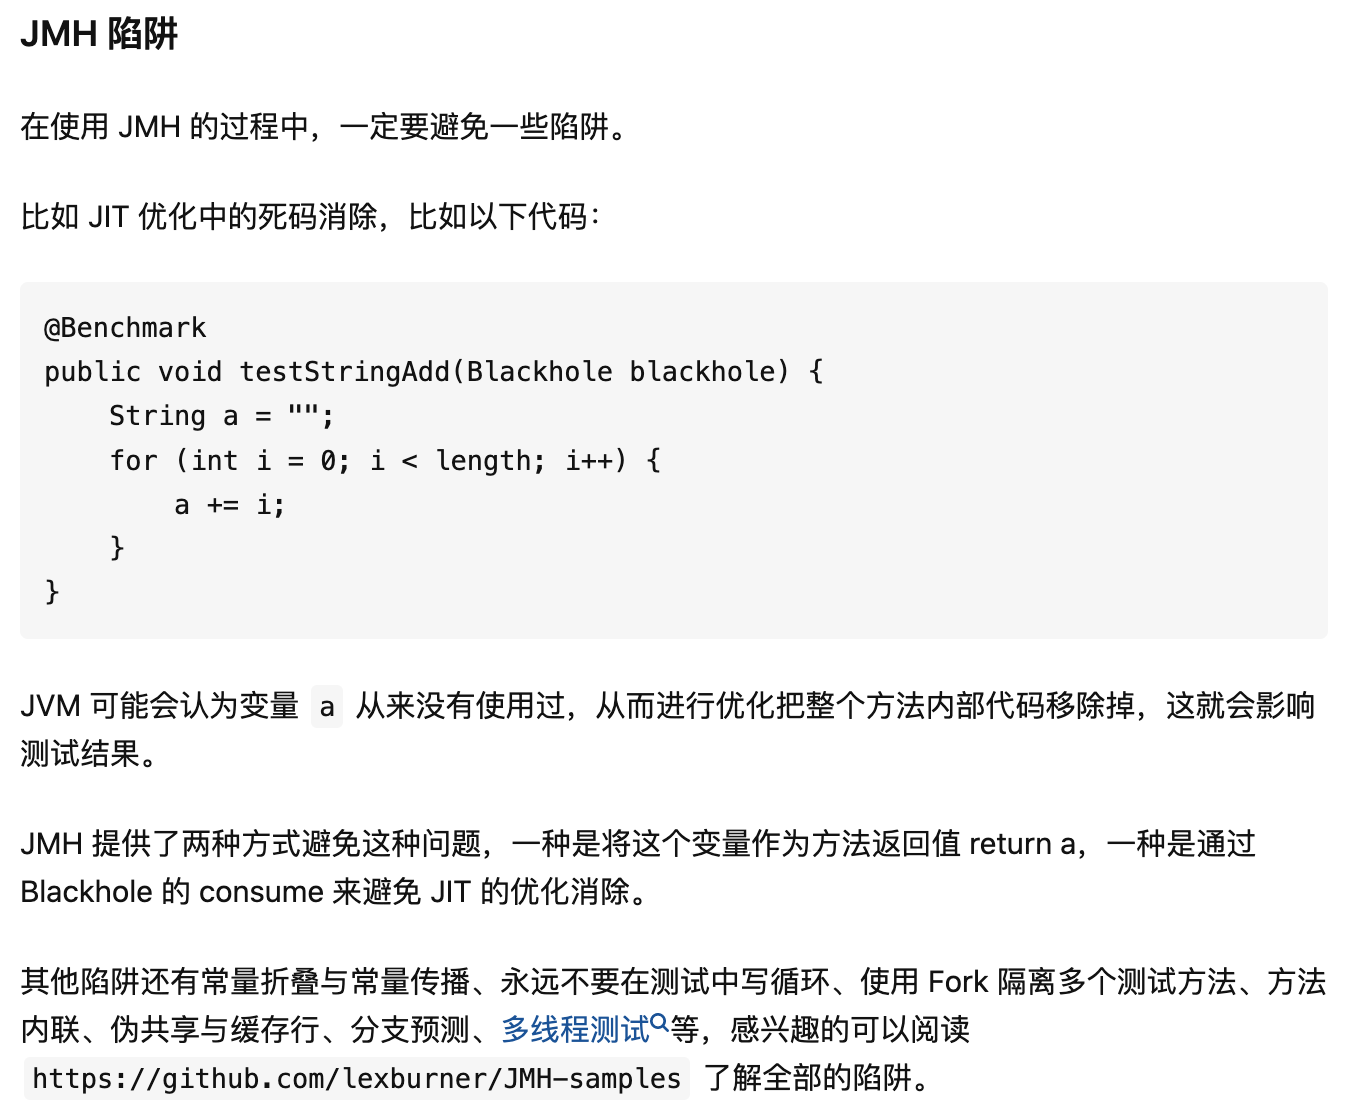
## JMH陷阱
## 參考
> 為什么要用JMH?何時應該用? - 武培軒的回答 - 知乎 https://www.zhihu.com/question/276455629/answer/1259967560
> 葛一鳴 * 《Java高并發程序設計》
- 面試突擊
- Java虛擬機
- 認識字節碼
- 000Java發展歷史
- 000Macos10.15.7上編譯OpenJDK8u
- 001熟悉Java內存區域
- 002熟悉HotSpot中的對象
- 003Java如何計算對象大小
- 004垃圾判定算法與4大引用
- 005回收堆和方法區中對象
- 006垃圾收集算法
- 007HotSpot虛擬機垃圾算法實現篇1
- 007HotSpot虛擬機垃圾算法實現篇2
- 007HotSpot虛擬機垃圾算法實現篇3
- 008垃圾收集器
- 009內存分配與回收策略
- 010Java虛擬機相關工具
- 011調優案例分析
- 012一次IDEA的啟動速度調優
- 013類文件Class的結構
- 014熟悉字節碼指令
- 015類加載機制(過程)
- 016類加載器
- IDEA的JVM參數
- Java基礎
- Java自動裝箱與拆箱
- Java基礎數據類型
- Java方法的參數傳遞
- Java并發
- 001走入并行的世界
- 002并行程序基礎
- 003熟悉Java內存模型JMM
- 004Java并發之volatile關鍵字
- 005線程池入門到精通
- 006Java多線程間的同步控制方法
- 007Java維基準測試框架JMH
- 008Java并發容器
- 009Java的線程實現
- 010Java關鍵字synchronized
- 011一些并行模式的熟悉
- 單例模式和不變模式
- 生產者消費者模式
- Future模式
- 012一些并行算法的熟悉
- 面試總結
- 長亮一面