
* **vscode**
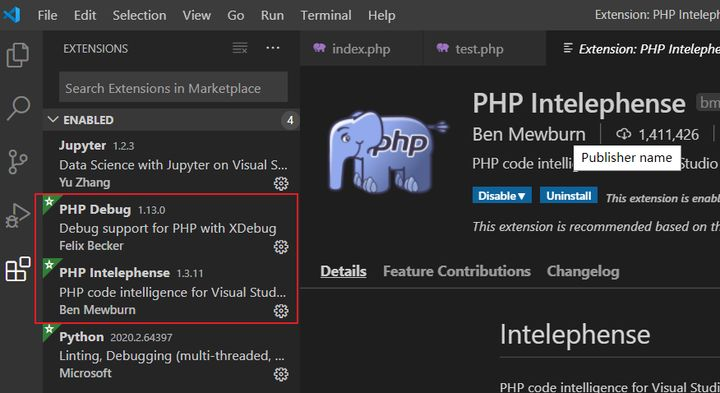
vscode安裝好后,在vscode商店中搜索安裝下面的2個插件:
Intelephense可有可無,是 PHP代碼提示工具,支付代碼提示、查找定義、類搜索等功能。
裝完插件,然后配置插件:File--Preferences--Settings--Extensions--PHP:
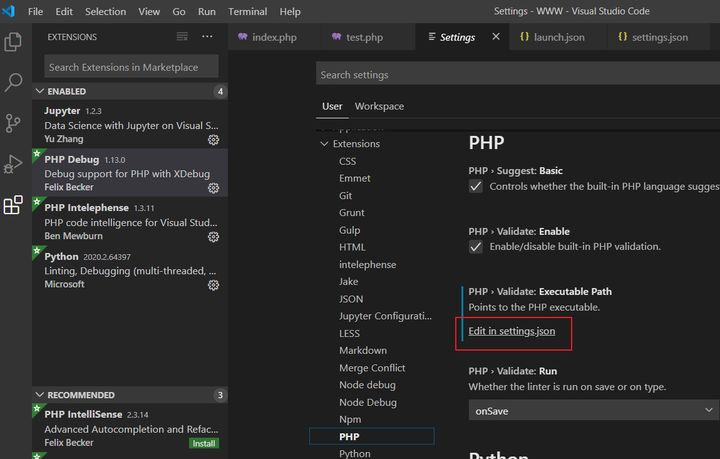
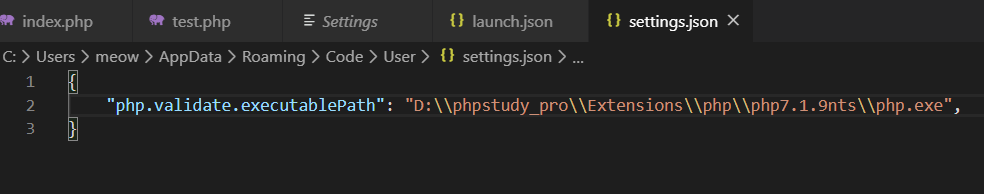
寫入你要用的php版本所在位置:
~~~text
"php.validate.executablePath": "D:\\phpstudy_pro\\Extensions\\php\\php7.1.9nts\\php.exe",
~~~
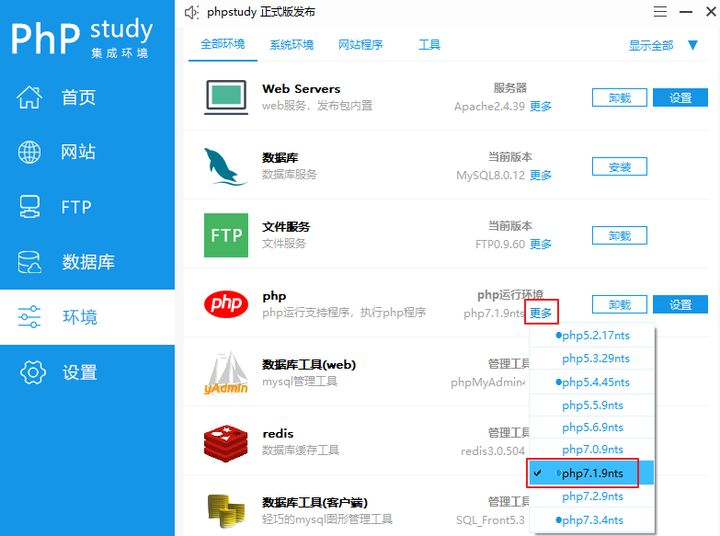
* **xdebug**
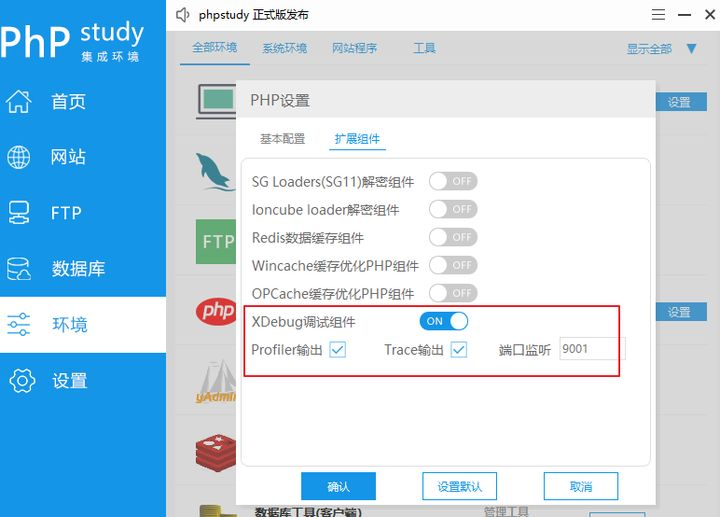
選擇phpstudy的環境,如圖我用的是7.1.9:
之后點擊旁邊的設置,打開擴展組件,做如下的配置,我用的調試端口是9001,然后點確定:
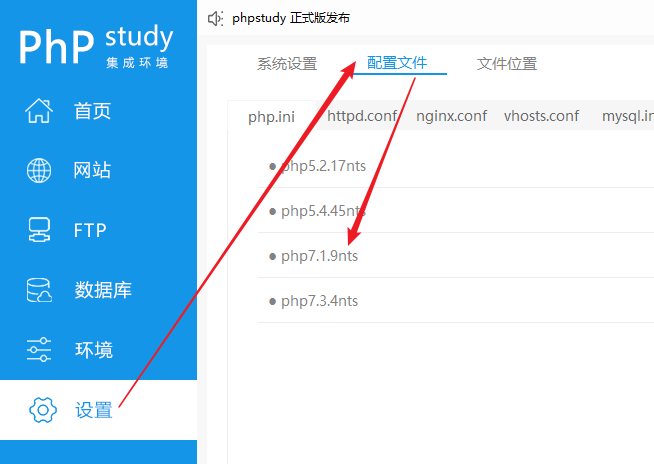
打開7.1.9的php.ini:
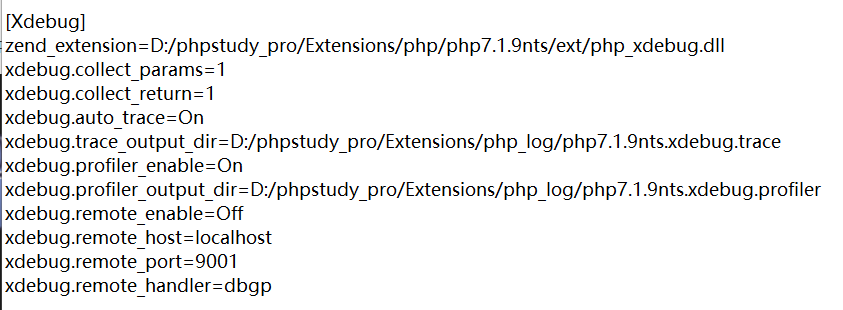
做了如上的配置后,在php.ini文件中就有Xdebug的內容:
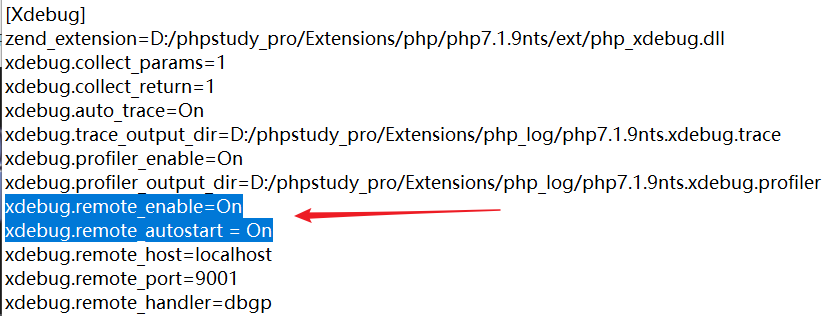
## 我遇到的坑點就在這里,導致斷點失敗。解決方法如下:
**配置文件中xdebug.remote\_enable=Off需要改為On**
**添加一行配置:xdebug.remote\_autostart = On**
保存配置文件后記得重啟一下nginx。我們去vscode中設置,填上xdebug的端口:
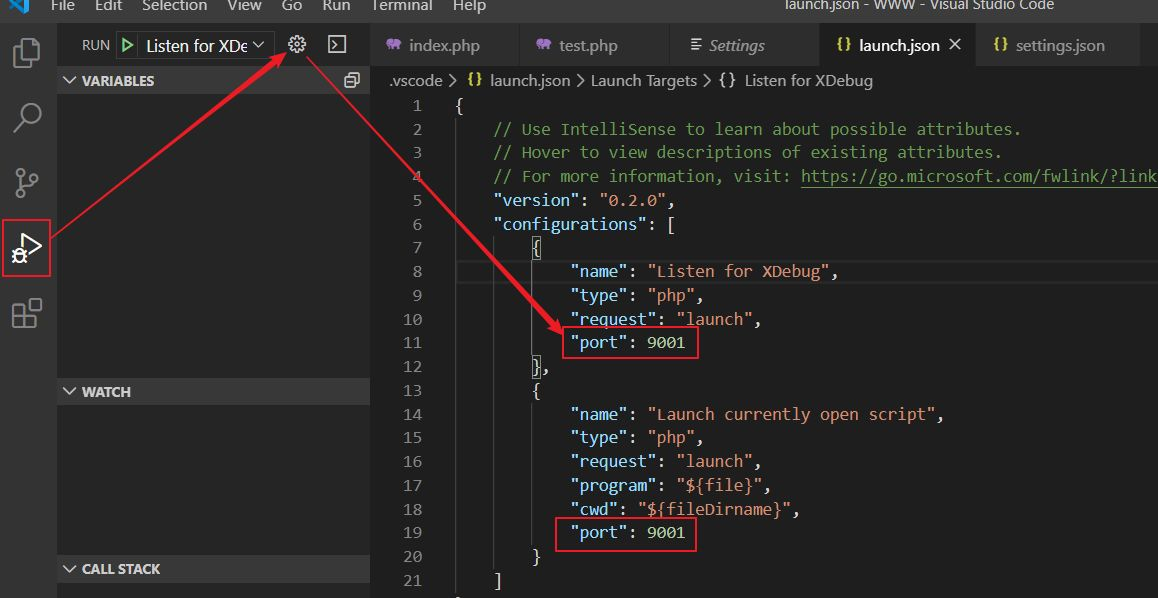
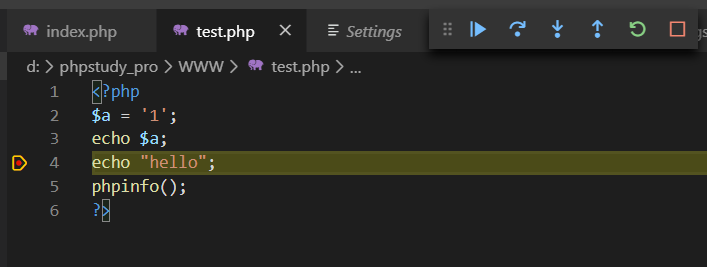
下斷點,F5啟動debug,瀏覽器訪問test.php,此時就能踩到斷點了:
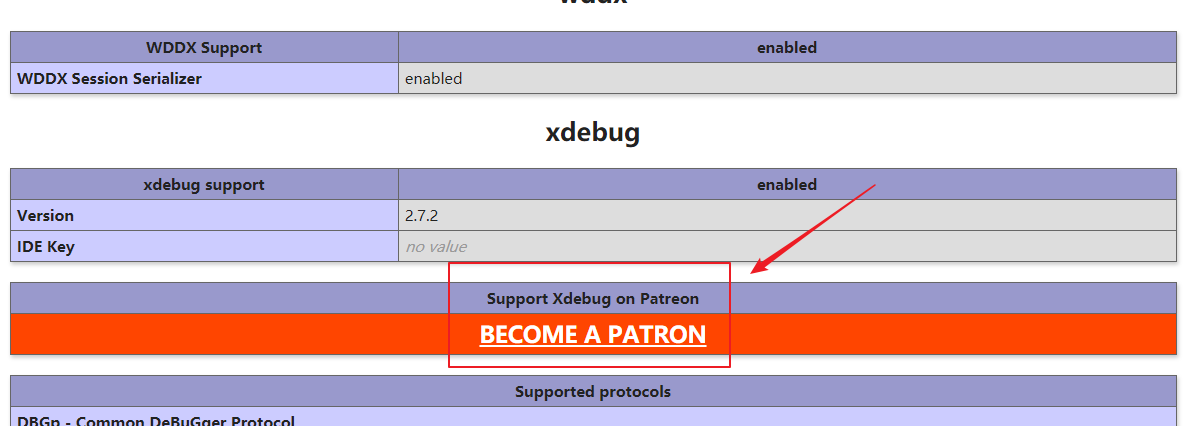
至于下圖的這個問題,不解決貌似沒啥影響。如果實在強迫癥,要解決,可以去xdebug官網下載適合你php版本的的xdebug(這一步網上也很多教程),并改掉php.ini里面的xdebug路徑指向你下載的xdebug就OK:
比如我的是這個:
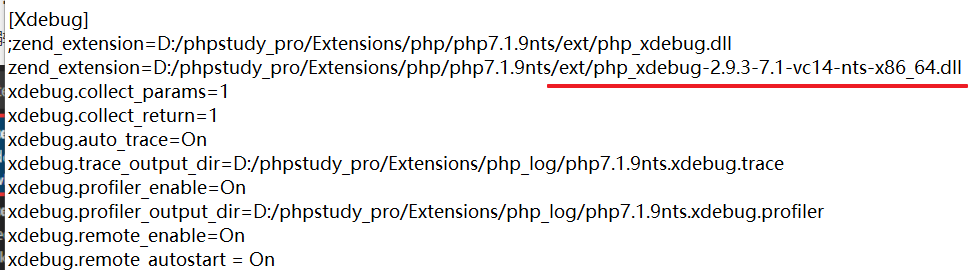
嗯,真香,沒有紅色了。
- 開發語言
- java
- Java基礎篇
- Java多線程篇
- 進程和線程的區別,進程間如何通信
- 什么是線程上下文切換
- 什么是死鎖
- 死鎖的必要條件
- Synchrpnized和lock的區別
- 什么是AQS鎖
- 為什么AQS使用的雙向鏈表
- 有哪些常見的AQS鎖
- sleep()和wait()的區別
- yield()和join()區別
- Java線程池
- SpringBoot
- spring boot 項目開發常用目錄結構
- Mybatis-Plus
- MyBatisPlus的CRUD操作
- Mybatis-Plus主鍵ID生成策略
- JVM
- JVM組成
- 字節碼文件的組成
- 類的生命周期
- JVM、JRE和JDK
- arthas
- 使用阿里arthas不停機解決線上問題
- Java IO
- php
- 安裝swoole
- composer部分
- windows安裝composer
- composer PSR-4映射
- composer 鏡像同一個版本替換
- composer官方鏡像庫
- swoole部分
- swoole安裝
- thrift部分
- linux下安裝thrift
- PHP使用Thrift
- lnmp部分
- 架構的工作原理
- tp5框架生命周期
- zookeeper部分
- zookeeper安裝
- sort
- TCP和UDP的區別
- 軟件
- xdebug
- vscode+phpstudy+xdebug無法斷點(踩坑記)
- Hyperf框架
- 注解
- 通過注解定義路由
- go
- 開發方案
- 抖音
- 抖音達人視頻發布與統計
- 安全問題
- 微信
- 微信公眾平臺怎樣實現用戶點擊鏈接向公眾號發消息
- CDN加速OSS計費說明
- 程序設計
- 正則表達式
- 面向對象
- 設計模式
- 創建型模式
- 工廠模式
- 單例模式
- 結構型模式
- 適配器模式
- 行為型模式
- 策略模式
- 觀察者模式
- 算法部分
- 位運算
- 排序算法
- 雙指針
- 貪心算法
- 動態規劃
- 二分查找
- 華為題庫
- 技術棧
- mq
- MQ 的優勢和劣勢
- rabbitmq部分
- windows安裝rabbitmq
- RabbitMQ 簡介
- 工作模式
- 高級特性-消息可靠投遞-confirm
- 高級特性-消息可靠投遞-return
- 高級特性-Consumer Ack
- 高級特性-消費端限流
- 高級特性-TTL
- 高級特性-死信隊列
- Centos7下安裝rabbitmq
- 數據庫
- MongoDB
- MongoDB 相關概念
- Mysql
- 索引總結
- MySQL架構圖
- InnoDB和MyISAM的區別
- 索引設計與優化
- 悲觀鎖和樂觀鎖
- mysql如何解除死鎖狀態
- 查詢慢
- 數據庫主鍵的優缺點
- MySQL鎖詳解
- SQL語句分類
- 開查詢賬號
- 數據庫遷移
- MySQL實戰知識點
- mysql清理binlog日志
- 面試總結
- 事務隔離
- 聚集索引與非聚集索引
- B樹和B+樹
- docker
- docker-desktop安裝的坑點
- docker在linux平臺下安裝
- Ubuntu安裝Docker
- 常用命令
- 適用于 Linux 的 Windows 子系統沒有已安裝的分發版
- docker核心架構圖
- docker安裝lnmp環境
- docker安裝redis
- dockerfile
- docker-compose
- 清除容器日志
- linux
- Ubuntu 更換國內源
- centos
- 常用命令
- virtualbox
- 關于VirtualBox安裝Ubuntu時界面顯示不全,沒有下一步選項
- linux復制當前目錄到其子目錄下
- 命令
- cat和>、>>
- crontab命令
- 空間大小查詢命令
- shell登錄和非shell登錄
- nginx
- 正向代理
- 反向代理
- 負載均衡
- 分割Nginx的access.log日志并保留30天一個月時長,自動刪除多余的日志
- linux安裝nginx
- git
- 生成秘鑰
- 常用命令
- Linux中git保存用戶名密碼
- git清除賬號密碼
- 設置git store 存儲賬號密碼
- git submodule 使用小結
- 微服務
- 微服務技術棧
- nacos
- Nacos服務分級存儲模型
- Nacos配置管理-配置熱更新
- Nacos集群搭建
- 微服務保護
- 初識Sentinel
- 隔離和降級
- es
- DSL查詢語法-相關性算法
- DSL查詢語法-FunctionScoreQuery
- DSL查詢語法-BooleanQuery
- 搜索結果處理-排序
- es深度分頁問題
- 自動補全
- elasticsearch 設置密碼
- redis
- redis簡介
- linux安裝redis
- 安裝redis擴展
- redis數據類型
- redis常見問題
- PHP 使用 Redis 實現分布式鎖
- 緩存更新策略
- [ Redis ] AOF 和 RDB 的相關介紹以及相關配置
- 分布式鎖的8大坑
- 分布式鎖-Redisson
- 內存回收
- UV統計
- Redis主從集群
- redis哨兵
- Redis安裝目錄下常見文件
- 通訊原理概述
- windows
- Win系統端口被占用
- Windows10 WSL2限制cpu和內存
- jekins
- 持續集成
- centos卸載gitlab
- jenkins搭配gitlab的webhook實現自動化部署
- 大數據
- Linux集群分發腳本xsync
- hadoop
- hadoop安裝
- hadoop配置文件
- clickhouse
- ClickHouse 安裝部署
- flink
- 數據倉庫
- zookeeper
- zookeeper分布式安裝
- ZK集群啟動停止腳本
- kafka
- kafka分布式安裝
- kafka集群啟動停止腳本
- flume
- flume分布式安裝
- Flume配置
- Flume使用
- maxwell
- Maxwell簡介
- Maxwell部署
- Maxwell使用
- MaxwellBootstrapUtility - Connections could not be acquired from the underlying database
- 線上事故