[TOC]
在Android主流三方庫源碼分析系列的前幾篇文章中,筆者已經對網絡、圖片、數據庫、響應式編程中最熱門的第三方開源框架進行了較為深入地講解,如果有朋友對這四塊感興趣的話,可以去了解下。本篇,我將會對Android中的內存泄露檢測框架Leakcanary的源碼流程進行詳細地講解。
### 一、原理概述
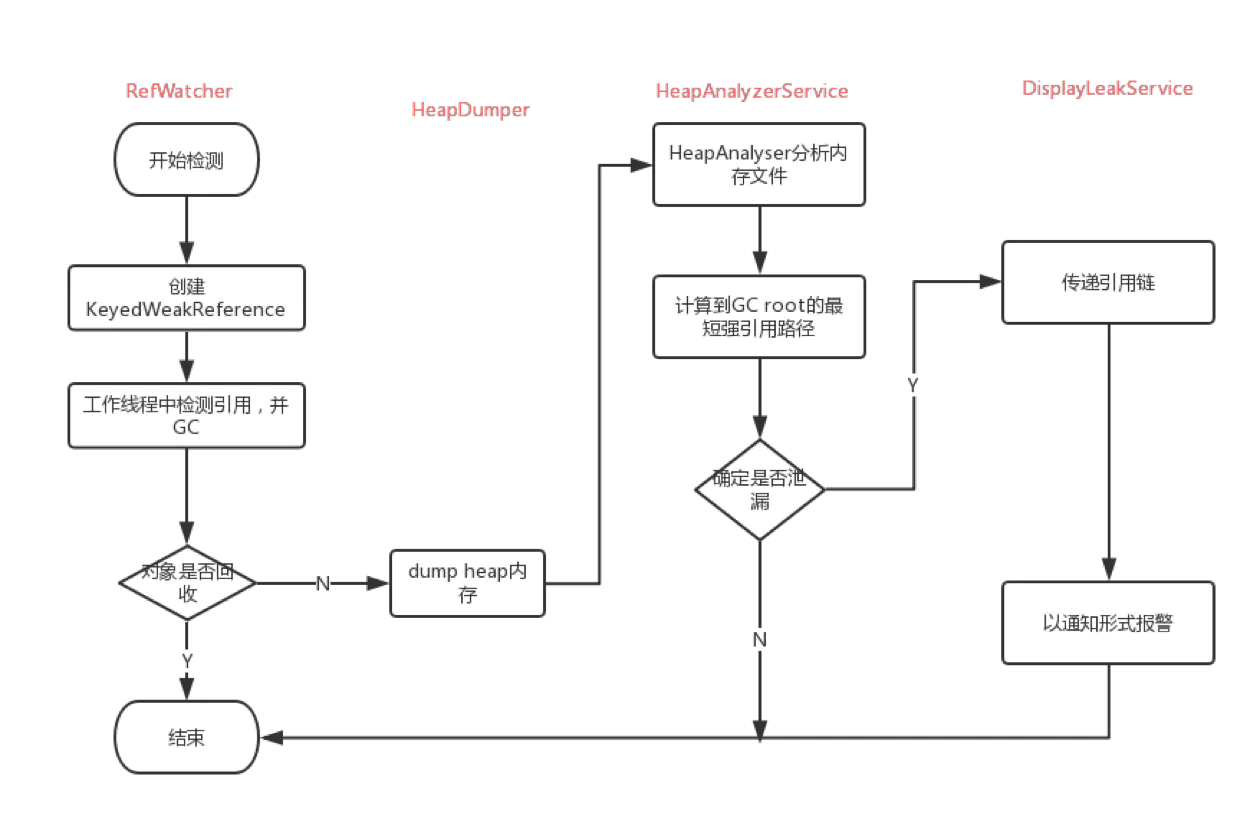
首先,筆者仔細查看了Leakcanary官方的github倉庫,最重要的便是對**Leakcanary是如何起作用的**(即原理)這一問題進行了闡述,我自己把它翻譯成了易于理解的文字,主要分為如下7個步驟:
* 1、RefWatcher.watch()創建了一個KeyedWeakReference用于去觀察對象。
* 2、然后,在后臺線程中,它會檢測引用是否被清除了,并且是否沒有觸發GC。
* 3、如果引用仍然沒有被清除,那么它將會把堆棧信息保存在文件系統中的.hprof文件里。
* 4、HeapAnalyzerService被開啟在一個獨立的進程中,并且HeapAnalyzer使用了HAHA開源庫解析了指定時刻的堆棧快照文件heap dump。
* 5、從heap dump中,HeapAnalyzer根據一個獨特的引用key找到了KeyedWeakReference,并且定位了泄露的引用。
* 6、HeapAnalyzer為了確定是否有泄露,計算了到GC Roots的最短強引用路徑,然后建立了導致泄露的鏈式引用。
* 7、這個結果被傳回到app進程中的DisplayLeakService,然后一個泄露通知便展現出來了。
官方的原理簡單來解釋就是這樣的:**在一個Activity執行完onDestroy()之后,將它放入WeakReference中,然后將這個WeakReference類型的Activity對象與ReferenceQueque關聯。這時再從ReferenceQueque中查看是否有沒有該對象,如果沒有,執行gc,再次查看,還是沒有的話則判斷發生內存泄露了。最后用HAHA這個開源庫去分析dump之后的heap內存。**
### 二、簡單示例
下面這段是Leakcanary官方倉庫的示例代碼:
首先在你項目app下的build.gradle中配置:
~~~
dependencies {
debugImplementation 'com.squareup.leakcanary:leakcanary-android:1.6.2'
releaseImplementation 'com.squareup.leakcanary:leakcanary-android-no-op:1.6.2'
// 可選,如果你使用支持庫的fragments的話
debugImplementation 'com.squareup.leakcanary:leakcanary-support-fragment:1.6.2'
}
~~~
然后在你的Application中配置:
~~~
public class WanAndroidApp extends Application {
private RefWatcher refWatcher;
public static RefWatcher getRefWatcher(Context context) {
WanAndroidApp application = (WanAndroidApp) context.getApplicationContext();
return application.refWatcher;
}
@Override public void onCreate() {
super.onCreate();
if (LeakCanary.isInAnalyzerProcess(this)) {
// 1
return;
}
// 2
refWatcher = LeakCanary.install(this);
}
}
~~~
在注釋1處,會首先判斷當前進程是否是Leakcanary專門用于分析heap內存的而創建的那個進程,即HeapAnalyzerService所在的進程,如果是的話,則不進行Application中的初始化功能。如果是當前應用所處的主進程的話,則會執行注釋2處的LeakCanary.install(this)進行LeakCanary的安裝。只需這樣簡單的幾行代碼,我們就可以在應用中檢測是否產生了內存泄露了。當然,這樣使用只會檢測Activity和標準Fragment是否發生內存泄漏,如果要檢測V4包的Fragment在執行完onDestroy()之后是否發生內存泄露的話,則需要在Fragment的onDestroy()方法中加上如下兩行代碼去監視當前的Fragment:
~~~
RefWatcher refWatcher = WanAndroidApp.getRefWatcher(_mActivity);
refWatcher.watch(this);
~~~
上面的**RefWatcher其實就是一個引用觀察者對象,是用于監測當前實例對象的引用狀態的**。從以上的分析可以了解到,核心代碼就是LeakCanary.install(this)這行代碼,接下來,就從這里出發將LeakCanary一步一步進行拆解。
### 三、源碼分析
#### 1、LeakCanary#install()
~~~
public static @NonNull RefWatcher install(@NonNull Application application) {
return refWatcher(application).listenerServiceClass(DisplayLeakService.class)
.excludedRefs(AndroidExcludedRefs.createAppDefaults().build())
.buildAndInstall();
}
~~~
在install()方法中的處理,可以分解為如下四步:
* 1、**refWatcher(application)**
* 2、**鏈式調用listenerServiceClass(DisplayLeakService.class)**
* 3、**鏈式調用excludedRefs(AndroidExcludedRefs.createAppDefaults().build())**
* 4、**鏈式調用buildAndInstall()**
首先,我們來看下第一步,這里調用了LeakCanary類的refWatcher方法,如下所示:
~~~
public static @NonNull AndroidRefWatcherBuilder refWatcher(@NonNull Context context) {
return new AndroidRefWatcherBuilder(context);
}
~~~
然后新建了一個AndroidRefWatcherBuilder對象,再看看AndroidRefWatcherBuilder這個類。
#### 2、AndroidRefWatcherBuilder
~~~
/** A {@link RefWatcherBuilder} with appropriate Android defaults. */
public final class AndroidRefWatcherBuilder extends RefWatcherBuilder<AndroidRefWatcherBuilder> {
...
AndroidRefWatcherBuilder(@NonNull Context context) {
this.context = context.getApplicationContext();
}
...
}
~~~
在AndroidRefWatcherBuilder的構造方法中僅僅是將外部傳入的applicationContext對象保存起來了。**AndroidRefWatcherBuilder是一個適配Android平臺的引用觀察者構造器對象,它繼承了RefWatcherBuilder,RefWatcherBuilder是一個負責建立引用觀察者RefWatcher實例的基類構造器**。繼續看看RefWatcherBuilder這個類。
#### 3、RefWatcherBuilder
~~~
public class RefWatcherBuilder<T extends RefWatcherBuilder<T>> {
...
public RefWatcherBuilder() {
heapDumpBuilder = new HeapDump.Builder();
}
...
}
~~~
在RefWatcher的基類構造器RefWatcherBuilder的構造方法中新建了一個HeapDump的構造器對象。其中**HeapDump就是一個保存heap dump信息的數據結構**。
接著來分析下install()方法中的鏈式調用的listenerServiceClass(DisplayLeakService.class)這部分邏輯。
#### 4、AndroidRefWatcherBuilder#listenerServiceClass()
~~~
public @NonNull AndroidRefWatcherBuilder listenerServiceClass(
@NonNull Class<? extends AbstractAnalysisResultService> listenerServiceClass) {
return heapDumpListener(new ServiceHeapDumpListener(context, listenerServiceClass));
}
~~~
在這里,傳入了一個DisplayLeakService的Class對象,它的作用是展示泄露分析的結果日志,然后會展示一個用于跳轉到顯示泄露界面DisplayLeakActivity的通知。在listenerServiceClass()這個方法中新建了一個ServiceHeapDumpListener對象,下面看看它內部的操作。
#### 5、ServiceHeapDumpListener
~~~
public final class ServiceHeapDumpListener implements HeapDump.Listener {
...
public ServiceHeapDumpListener(@NonNull final Context context,
@NonNull final Class<? extends AbstractAnalysisResultService> listenerServiceClass) {
this.listenerServiceClass = checkNotNull(listenerServiceClass, "listenerServiceClass");
this.context = checkNotNull(context, "context").getApplicationContext();
}
...
}
~~~
可以看到這里僅僅是在ServiceHeapDumpListener中保存了DisplayLeakService的Class對象和application對象。它的作用就是接收一個heap dump去分析。
然后我們繼續看install()方法鏈式調用.excludedRefs(AndroidExcludedRefs.createAppDefaults().build())的這部分代碼。先看AndroidExcludedRefs.createAppDefaults()。
#### 6、AndroidExcludedRefs#createAppDefaults()
~~~
public enum AndroidExcludedRefs {
...
public static @NonNull ExcludedRefs.Builder createAppDefaults() {
return createBuilder(EnumSet.allOf(AndroidExcludedRefs.class));
}
public static @NonNull ExcludedRefs.Builder createBuilder(EnumSet<AndroidExcludedRefs> refs) {
ExcludedRefs.Builder excluded = ExcludedRefs.builder();
for (AndroidExcludedRefs ref : refs) {
if (ref.applies) {
ref.add(excluded);
((ExcludedRefs.BuilderWithParams) excluded).named(ref.name());
}
}
return excluded;
}
...
}
~~~
先來說下**AndroidExcludedRefs**這個類,它是一個enum類,它**聲明了Android SDK和廠商定制的SDK中存在的內存泄露的case**,根據AndroidExcludedRefs這個類的類名就可看出這些case**都會被Leakcanary的監測過濾掉**。目前這個版本是有**46種**這樣的**case**被包含在內,后續可能會一直增加。然后EnumSet.allOf(AndroidExcludedRefs.class)這個方法將會返回一個包含AndroidExcludedRefs元素類型的EnumSet。Enum是一個抽象類,在這里具體的實現類是**通用正規型的RegularEnumSet,如果Enum里面的元素個數大于64,則會使用存儲大數據量的JumboEnumSet**。最后,在createBuilder這個方法里面構建了一個排除引用的建造器excluded,將各式各樣的case分門別類地保存起來再返回出去。
最后,我們看到鏈式調用的最后一步buildAndInstall()。
#### 7、AndroidRefWatcherBuilder#buildAndInstall()
~~~
private boolean watchActivities = true;
private boolean watchFragments = true;
public @NonNull RefWatcher buildAndInstall() {
// 1
if (LeakCanaryInternals.installedRefWatcher != null) {
throw new UnsupportedOperationException("buildAndInstall() should only be called once.");
}
// 2
RefWatcher refWatcher = build();
if (refWatcher != DISABLED) {
// 3
LeakCanaryInternals.setEnabledAsync(context, DisplayLeakActivity.class, true);
if (watchActivities) {
// 4
ActivityRefWatcher.install(context, refWatcher);
}
if (watchFragments) {
// 5
FragmentRefWatcher.Helper.install(context, refWatcher);
}
}
// 6
LeakCanaryInternals.installedRefWatcher = refWatcher;
return refWatcher;
}
~~~
首先,在注釋1處,會判斷LeakCanaryInternals.installedRefWatcher是否已經被賦值,如果被賦值了,則會拋出異常,警告 buildAndInstall()這個方法應該僅僅只調用一次,在此方法結束時,即在注釋6處,該LeakCanaryInternals.installedRefWatcher才會被賦值。再來看注釋2處,調用了AndroidRefWatcherBuilder其基類RefWatcherBuilder的build()方法,我們它是如何建造的。
#### 8、RefWatcherBuilder#build()
~~~
public final RefWatcher build() {
if (isDisabled()) {
return RefWatcher.DISABLED;
}
if (heapDumpBuilder.excludedRefs == null) {
heapDumpBuilder.excludedRefs(defaultExcludedRefs());
}
HeapDump.Listener heapDumpListener = this.heapDumpListener;
if (heapDumpListener == null) {
heapDumpListener = defaultHeapDumpListener();
}
DebuggerControl debuggerControl = this.debuggerControl;
if (debuggerControl == null) {
debuggerControl = defaultDebuggerControl();
}
HeapDumper heapDumper = this.heapDumper;
if (heapDumper == null) {
heapDumper = defaultHeapDumper();
}
WatchExecutor watchExecutor = this.watchExecutor;
if (watchExecutor == null) {
watchExecutor = defaultWatchExecutor();
}
GcTrigger gcTrigger = this.gcTrigger;
if (gcTrigger == null) {
gcTrigger = defaultGcTrigger();
}
if (heapDumpBuilder.reachabilityInspectorClasses == null) {
heapDumpBuilder.reachabilityInspectorClasses(defa ultReachabilityInspectorClasses());
}
return new RefWatcher(watchExecutor, debuggerControl, gcTrigger, heapDumper, heapDumpListener,
heapDumpBuilder);
}
~~~
可以看到,**RefWatcherBuilder包含了以下7個組成部分:**
* 1、**excludedRefs : 記錄可以被忽略的泄漏路徑**。
* 2、**heapDumpListener : 轉儲堆信息到hprof文件,并在解析完 hprof 文件后進行回調,最后通知 DisplayLeakService 彈出泄漏提醒**。
* 3、debuggerControl : 判斷是否處于調試模式,調試模式中不會進行內存泄漏檢測。為什么呢?因為**在調試過程中可能會保留上一個引用從而導致錯誤信息上報**。
* 4、**heapDumper : 堆信息轉儲者,負責dump 內存泄漏處的 heap 信息到 hprof 文件**。
* 5、**watchExecutor : 線程控制器,在 onDestroy() 之后并且在主線程空閑時執行內存泄漏檢測**。
* 6、**gcTrigger : 用于 GC,watchExecutor 首次檢測到可能的內存泄漏,會主動進行 GC,GC 之后會再檢測一次,仍然泄漏的判定為內存泄漏,最后根據heapDump信息生成相應的泄漏引用鏈**。
* 7、**reachabilityInspectorClasses : 用于要進行可達性檢測的類列表。**
最后,會使用建造者模式將這些組成部分構建成一個新的RefWatcher并將其返回。
我們繼續看回到AndroidRefWatcherBuilder的注釋3處的 LeakCanaryInternals.setEnabledAsync(context, DisplayLeakActivity.class, true)這行代碼。
#### 9、LeakCanaryInternals#setEnabledAsync()
~~~
public static void setEnabledAsync(Context context, final Class<?> componentClass,
final boolean enabled) {
final Context appContext = context.getApplicationContext();
AsyncTask.THREAD_POOL_EXECUTOR.execute(new Runnable() {
@Override public void run() {
setEnabledBlocking(appContext, componentClass, enabled);
}
});
}
~~~
在這里直接使用了**AsyncTask內部自帶的THREAD\_POOL\_EXECUTOR線程池**進行阻塞式地顯示DisplayLeakActivity。
然后我們再繼續看AndroidRefWatcherBuilder的注釋4處的代碼。
#### 10、ActivityRefWatcher#install()
~~~
public static void install(@NonNull Context context, @NonNull RefWatcher refWatcher) {
Application application = (Application) context.getApplicationContext();
// 1
ActivityRefWatcher activityRefWatcher = new ActivityRefWatcher(application, refWatcher);
// 2
application.registerActivityLifecycleCallbacks(activityRefWatcher.lifecycleCallbacks);
}
~~~
可以看到,在注釋1處創建一個自己的activityRefWatcher實例,并在注釋2處調用了application的registerActivityLifecycleCallbacks()方法,這樣就能夠監聽activity對應的生命周期事件了。繼續看看activityRefWatcher.lifecycleCallbacks里面的操作。
~~~
private final Application.ActivityLifecycleCallbacks lifecycleCallbacks =
new ActivityLifecycleCallbacksAdapter() {
@Override public void onActivityDestroyed(Activity activity) {
refWatcher.watch(activity);
}
};
public abstract class ActivityLifecycleCallbacksAdapter
implements Application.ActivityLifecycleCallbacks {
}
~~~
很明顯,這里**實現并重寫了Application的ActivityLifecycleCallbacks的onActivityDestroyed()方法,這樣便能在所有Activity執行完onDestroyed()方法之后調用 refWatcher.watch(activity)這行代碼進行內存泄漏的檢測了**。
我們再看到注釋5處的FragmentRefWatcher.Helper.install(context, refWatcher)這行代碼,
#### 11、FragmentRefWatcher.Helper#install()
~~~
public interface FragmentRefWatcher {
void watchFragments(Activity activity);
final class Helper {
private static final String SUPPORT_FRAGMENT_REF_WATCHER_CLASS_NAME =
"com.squareup.leakcanary.internal.SupportFragmentRefWatcher";
public static void install(Context context, RefWatcher refWatcher) {
List<FragmentRefWatcher> fragmentRefWatchers = new ArrayList<>();
// 1
if (SDK_INT >= O) {
fragmentRefWatchers.add(new AndroidOFragmentRefWatcher(refWatcher));
}
// 2
try {
Class<?> fragmentRefWatcherClass = Class.forName(SUPPORT_FRAGMENT_REF_WATCHER_CLASS_NAME);
Constructor<?> constructor =
fragmentRefWatcherClass.getDeclaredConstructor(RefWatcher.class);
FragmentRefWatcher supportFragmentRefWatcher =
(FragmentRefWatcher) constructor.newInstance(refWatcher);
fragmentRefWatchers.add(supportFragmentRefWatcher);
} catch (Exception ignored) {
}
if (fragmentRefWatchers.size() == 0) {
return;
}
Helper helper = new Helper(fragmentRefWatchers);
// 3
Application application = (Application) context.getApplicationContext();
application.registerActivityLifecycleCallbacks(helper.activityLifecycleCallbacks);
}
...
}
~~~
這里面的邏輯很簡單,首先在注釋1處將Android標準的Fragment的RefWatcher類,即AndroidOfFragmentRefWatcher添加到新創建的fragmentRefWatchers中。在注釋2處**使用反射將leakcanary-support-fragment包下面的SupportFragmentRefWatcher添加進來,如果你在app的build.gradle下沒有添加下面這行引用的話,則會拿不到此類,即LeakCanary只會檢測Activity和標準Fragment這兩種情況**。
~~~
debugImplementation 'com.squareup.leakcanary:leakcanary-support-fragment:1.6.2'
~~~
繼續看到注釋3處helper.activityLifecycleCallbacks里面的代碼。
~~~
private final Application.ActivityLifecycleCallbacks activityLifecycleCallbacks =
new ActivityLifecycleCallbacksAdapter() {
@Override public void onActivityCreated(Activity activity, Bundle savedInstanceState) {
for (FragmentRefWatcher watcher : fragmentRefWatchers) {
watcher.watchFragments(activity);
}
}
};
~~~
可以看到,在Activity執行完onActivityCreated()方法之后,會調用指定watcher的watchFragments()方法,注意,這里的watcher可能有兩種,但不管是哪一種,都會使用當前傳入的activity獲取到對應的FragmentManager/SupportFragmentManager對象,調用它的registerFragmentLifecycleCallbacks()方法,在對應的onDestroyView()和onDestoryed()方法執行完后,分別使用refWatcher.watch(view)和refWatcher.watch(fragment)進行內存泄漏的檢測,代碼如下所示。
~~~
@Override public void onFragmentViewDestroyed(FragmentManager fm, Fragment fragment) {
View view = fragment.getView();
if (view != null) {
refWatcher.watch(view);
}
}
@Override
public void onFragmentDestroyed(FragmentManagerfm, Fragment fragment) {
refWatcher.watch(fragment);
}
~~~
注意,下面到真正關鍵的地方了,接下來分析refWatcher.watch()這行代碼。
#### 12、RefWatcher#watch()
~~~
public void watch(Object watchedReference, String referenceName) {
if (this == DISABLED) {
return;
}
checkNotNull(watchedReference, "watchedReference");
checkNotNull(referenceName, "referenceName");
final long watchStartNanoTime = System.nanoTime();
// 1
String key = UUID.randomUUID().toString();
// 2
retainedKeys.add(key);
// 3
final KeyedWeakReference reference =
new KeyedWeakReference(watchedReference, key, referenceName, queue);
// 4
ensureGoneAsync(watchStartNanoTime, reference);
}
~~~
注意到在注釋1處**使用隨機的UUID保證了每個檢測對象對應 key 的唯一性**。在注釋2處將生成的key添加到類型為CopyOnWriteArraySet的Set集合中。在注釋3處新建了一個自定義的弱引用KeyedWeakReference,看看它內部的實現。
#### 13、KeyedWeakReference
~~~
final class KeyedWeakReference extends WeakReference<Object> {
public final String key;
public final String name;
KeyedWeakReference(Object referent, String key, String name,
ReferenceQueue<Object> referenceQueue) {
// 1
super(checkNotNull(referent, "referent"), checkNotNull(referenceQueue, "referenceQueue"));
this.key = checkNotNull(key, "key");
this.name = checkNotNull(name, "name");
}
}
~~~
可以看到,**在KeyedWeakReference內部,使用了key和name標識了一個被檢測的WeakReference對象**。在注釋1處,**將弱引用和引用隊列 ReferenceQueue 關聯起來,如果弱引用reference持有的對象被GC回收,JVM就會把這個弱引用加入到與之關聯的引用隊列referenceQueue中。即 KeyedWeakReference 持有的 Activity 對象如果被GC回收,該對象就會加入到引用隊列 referenceQueue 中**。
接著我們回到RefWatcher.watch()里注釋4處的ensureGoneAsync()方法。
#### 14、RefWatcher#ensureGoneAsync()
~~~
private void ensureGoneAsync(final long watchStartNanoTime, final KeyedWeakReference reference) {
// 1
watchExecutor.execute(new Retryable() {
@Override public Retryable.Result run() {
// 2
return ensureGone(reference watchStartNanoTime);
}
});
}
~~~
在ensureGoneAsync()方法中,在注釋1處使用 watchExecutor 執行了注釋2處的 ensureGone 方法,watchExecutor 是 AndroidWatchExecutor 的實例。
下面看看watchExecutor內部的邏輯。
#### 15、AndroidWatchExecutor
~~~
public final class AndroidWatchExecutor implements WatchExecutor {
...
public AndroidWatchExecutor(long initialDelayMillis) {
mainHandler = new Handler(Looper.getMainLooper());
HandlerThread handlerThread = new HandlerThread(LEAK_CANARY_THREAD_NAME);
handlerThread.start();
// 1
backgroundHandler = new Handler(handlerThread.getLooper());
this.initialDelayMillis = initialDelayMillis;
maxBackoffFactor = Long.MAX_VALUE / initialDelayMillis;
}
@Override public void execute(@NonNull Retryable retryable) {
// 2
if (Looper.getMainLooper().getThread() == Thread.currentThread()) {
waitForIdle(retryable, 0);
} else {
postWaitForIdle(retryable, 0);
}
}
...
}
~~~
在注釋1處**AndroidWatchExecutor的構造方法**中,注意到這里**使用HandlerThread的looper新建了一個backgroundHandler**,后面會用到。在注釋2處,會判斷當前線程是否是主線程,如果是,則直接調用waitForIdle()方法,如果不是,則調用postWaitForIdle(),來看看這個方法。
~~~
private void postWaitForIdle(final Retryable retryable, final int failedAttempts) {
mainHandler.post(new Runnable() {
@Override public void run() {
waitForIdle(retryable, failedAttempts);
}
});
}
~~~
很清晰,這里使用了在構造方法中用主線程looper構造的mainHandler進行post,那么waitForIdle()最終也會在主線程執行。接著看看waitForIdle()的實現。
~~~
private void waitForIdle(final Retryable retryable, final int failedAttempts) {
Looper.myQueue().addIdleHandler(new MessageQueue.IdleHandler() {
@Override public boolean queueIdle() {
postToBackgroundWithDelay(retryable, failedAttempts);
return false;
}
});
}
~~~
這里**MessageQueue.IdleHandler()回調方法的作用是當 looper 空閑的時候,會回調 queueIdle 方法,利用這個機制我們可以實現第三方庫的延遲初始化**,然后執行內部的postToBackgroundWithDelay()方法。接下來看看它的實現。
~~~
private void postToBackgroundWithDelay(final Retryable retryable, final int failedAttempts) {
long exponentialBackoffFactor = (long) Math.min(Math.pow(2, failedAttempts), maxBackoffFactor);
// 1
long delayMillis = initialDelayMillis * exponentialBackoffFactor;
// 2
backgroundHandler.postDelayed(new Runnable() {
@Override public void run() {
// 3
Retryable.Result result = retryable.run();
// 4
if (result == RETRY) {
postWaitForIdle(retryable, failedAttempts + 1);
}
}
}, delayMillis);
}
~~~
先看到注釋4處,可以明白,postToBackgroundWithDelay()是一個遞歸方法,如果result 一直等于RETRY的話,則會一直執行postWaitForIdle()方法。在回到注釋1處,這里initialDelayMillis 的默認值是 5s,因此delayMillis就是5s。在注釋2處,使用了在構造方法中用HandlerThread的looper新建的backgroundHandler進行異步延時執行retryable的run()方法。這個run()方法里執行的就是RefWatcher的ensureGoneAsync()方法中注釋2處的ensureGone()這行代碼,繼續看它內部的邏輯。
#### 16、RefWatcher#ensureGone()
~~~
Retryable.Result ensureGone(final KeyedWeakReference reference, final long watchStartNanoTime) {
long gcStartNanoTime = System.nanoTime();
long watchDurationMs = NANOSECONDS.toMillis(gcStartNanoTime - watchStartNanoTime);
// 1
removeWeaklyReachableReferences();
// 2
if (debuggerControl.isDebuggerAttached()) {
// The debugger can create false leaks.
return RETRY;
}
// 3
if (gone(reference)) {
return DONE;
}
// 4
gcTrigger.runGc();
removeWeaklyReachableReferences();
// 5
if (!gone(reference)) {
long startDumpHeap = System.nanoTime();
long gcDurationMs = NANOSECONDS.toMillis(startDumpHeap - gcStartNanoTime);
File heapDumpFile = heapDumper.dumpHeap();
if (heapDumpFile == RETRY_LATER) {
// Could not dump the heap.
return RETRY;
}
long heapDumpDurationMs = NANOSECONDS.toMillis(System.nanoTime() - startDumpHeap);
HeapDump heapDump = heapDumpBuilder.heapDumpFile(heapDumpFile).referenceKey(reference.key)
.referenceName(reference.name)
.watchDurationMs(watchDurationMs)
.gcDurationMs(gcDurationMs)
.heapDumpDurationMs(heapDumpDurationMs)
.build();
heapdumpListener.analyze(heapDump);
}
return DONE;
}
~~~
在注釋1處,執行了removeWeaklyReachableReferences()這個方法,接下來分析下它的含義。
~~~
private void removeWeaklyReachableReferences() {
KeyedWeakReference ref;
while ((ref = (KeyedWeakReference) queue.poll()) != null) {
retainedKeys.remove(ref.key);
}
}
~~~
這里使用了while循環遍歷 ReferenceQueue ,并從 retainedKeys中移除對應的Reference。
再看到注釋2處,**當Android設備處于debug狀態時,會直接返回RETRY進行延時重試檢測的操作**。在注釋3處,我們看看gone(reference)這個方法的邏輯。
~~~
private boolean gone(KeyedWeakReference reference) {
return !retainedKeys.contains(reference.key);
}
~~~
這里會**判斷 retainedKeys 集合中是否還含有 reference,若沒有,證明已經被回收了,若含有,可能已經發生內存泄露(或Gc還沒有執行回收)**。前面的分析中我們知道了 **reference 被回收的時候,會被加進 referenceQueue 里面,然后我們會調用removeWeaklyReachableReferences()遍歷 referenceQueue 移除掉 retainedKeys 里面的 refrence**。
接著我們看到注釋4處,執行了gcTrigger的runGc()方法進行垃圾回收,然后使用了removeWeaklyReachableReferences()方法移除已經被回收的引用。這里我們再深入地分析下runGc()的實現。
~~~
GcTrigger DEFAULT = new GcTrigger() {
@Override public void runGc() {
// Code taken from AOSP FinalizationTest:
// https://android.googlesource.com/platform/libc ore/+/master/support/src/test/java/libcore/
// java/lang/ref/FinalizationTester.java
// System.gc() does not garbage collect every time. Runtime.gc() is
// more likely to perform a gc.
Runtime.getRuntime().gc();
enqueueReferences();
System.runFinalization();
}
private void enqueueReferences() {
// Hack. We don't have a programmatic way to wait for the reference queue daemon to move
// references to the appropriate queues.
try {
Thread.sleep(100);
} catch (InterruptedException e) {
throw new AssertionError();
}
}
};
~~~
這里并沒有使用System.gc()方法進行回收,因為**system.gc()并不會每次都執行**。而是**從AOSP中拷貝一段GC回收的代碼,從而相比System.gc()更能夠保證垃圾回收的工作**。
最后我們分析下注釋5處的代碼處理。首先會判斷activity是否被回收,如果還沒有被回收,則證明發生內存泄露,進行if判斷里面的操作。在里面先調用堆信息轉儲者heapDumper的dumpHeap()生成相應的 hprof 文件。這里的heapDumper是一個HeapDumper接口,具體的實現是AndroidHeapDumper。我們分析下AndroidHeapDumper的dumpHeap()方法是如何生成hprof文件的。
~~~
public File dumpHeap() {
File heapDumpFile = leakDirectoryProvider.newHeapDumpFile();
if (heapDumpFile == RETRY_LATER) {
return RETRY_LATER;
}
...
try {
Debug.dumpHprofData(heapDumpFile.getAbsolutePath());
...
return heapDumpFile;
} catch (Exception e) {
...
// Abort heap dump
return RETRY_LATER;
}
}
~~~
這里的核心操作就是**調用了Android SDK的API Debug.dumpHprofData() 來生成 hprof 文件**。
如果這個文件等于RETRY\_LATER則表示生成失敗,直接返回RETRY進行延時重試檢測的操作。如果不等于的話,則表示生成成功,最后會**執行heapdumpListener的analyze()對新創建的HeapDump對象進行泄漏分析**。由前面對AndroidRefWatcherBuilder的listenerServiceClass()的分析可知,heapdumpListener的實現 就是ServiceHeapDumpListener,接著看到ServiceHeapDumpListener的analyze方法。
#### 17、ServiceHeapDumpListener#analyze()
~~~
@Override public void analyze(@NonNull HeapDump heapDump) {
checkNotNull(heapDump, "heapDump");
HeapAnalyzerService.runAnalysis(context, heapDump, listenerServiceClass);
}
~~~
可以看到,這里**執行了HeapAnalyzerService的runAnalysis()方法,為了避免降低app進程的性能或占用內存,這里將HeapAnalyzerService設置在了一個獨立的進程中**。接著繼續分析runAnalysis()方法里面的處理。
~~~
public final class HeapAnalyzerService extends ForegroundService
implements AnalyzerProgressListener {
...
public static void runAnalysis(Context context, HeapDump heapDump,
Class<? extends AbstractAnalysisResultService> listenerServiceClass) {
...
ContextCompat.startForegroundService(context, intent);
}
...
@Override protected void onHandleIntentInForeground(@Nullable Intent intent) {
...
// 1
HeapAnalyzer heapAnalyzer =
new HeapAnalyzer(heapDump.excludedRefs, this, heapDump.reachabilityInspectorClasses);
// 2
AnalysisResult result = heapAnalyzer.checkForLeak(heapDump.heapDumpFile, heapDump.referenceKey,
heapDump.computeRetainedHeapSize);
// 3
AbstractAnalysisResultService.sendResultToListener(this, listenerClassName, heapDump, result);
}
...
}
~~~
這里的HeapAnalyzerService實質是一個類型為IntentService的ForegroundService,執行startForegroundService()之后,會回調onHandleIntentInForeground()方法。注釋1處,首先會新建一個**HeapAnalyzer**對象,顧名思義,它就是**根據RefWatcher生成的heap dumps信息來分析被懷疑的泄漏是否是真的**。在注釋2處,然后會**調用它的checkForLeak()方法去使用haha庫解析 hprof文件**,如下所示:
~~~
public @NonNull AnalysisResult checkForLeak(@NonNull File heapDumpFile,
@NonNull String referenceKey,
boolean computeRetainedSize) {
...
try {
listener.onProgressUpdate(READING_HEAP_DUMP_FILE);
// 1
HprofBuffer buffer = new MemoryMappedFileBuffer(heapDumpFile);
// 2
HprofParser parser = new HprofParser(buffer);
listener.onProgressUpdate(PARSING_HEAP_DUMP);
Snapshot snapshot = parser.parse();
listener.onProgressUpdate(DEDUPLICATING_GC_ROOTS);
// 3
deduplicateGcRoots(snapshot);
listener.onProgressUpdate(FINDING_LEAKING_REF);
// 4
Instance leakingRef = findLeakingReference(referenceKey, snapshot);
// 5
if (leakingRef == null) {
return noLeak(since(analysisStartNanoTime));
}
// 6
return findLeakTrace(analysisStartNanoTime, snapshot, leakingRef, computeRetainedSize);
} catch (Throwable e) {
return failure(e, since(analysisStartNanoTime));
}
}
~~~
在注釋1處,會新建一個**內存映射緩存文件buffer**。在注釋2處,會**使用buffer新建一個HprofParser解析器去解析出對應的引用內存快照文件snapshot**。在注釋3處,**為了減少在Android 6.0版本中重復GCRoots帶來的內存壓力的影響,使用deduplicateGcRoots()刪除了gcRoots中重復的根對象RootObj**。在注釋4處,**調用了findLeakingReference()方法將傳入的referenceKey和snapshot對象里面所有類實例的字段值對應的keyCandidate進行比較,如果沒有相等的,則表示沒有發生內存泄漏**,直接調用注釋5處的代碼返回一個沒有泄漏的分析結果AnalysisResult對象。**如果找到了相等的,則表示發生了內存泄漏**,執行注釋6處的代碼findLeakTrace()方法返回一個有泄漏分析結果的AnalysisResult對象。
最后,我們來分析下HeapAnalyzerService中注釋3處的AbstractAnalysisResultService.sendResultToListener()方法,很明顯,這里AbstractAnalysisResultService的實現類就是我們剛開始分析的用于展示泄漏路徑信息的DisplayLeakService對象。在里面直接**創建一個由PendingIntent構建的泄漏通知用于供用戶點擊去展示詳細的泄漏界面DisplayLeakActivity**。核心代碼如下所示:
~~~
public class DisplayLeakService extends AbstractAnalysisResultService {
@Override
protected final void onHeapAnalyzed(@NonNull AnalyzedHeap analyzedHeap) {
...
boolean resultSaved = false;
boolean shouldSaveResult = result.leakFound || result.failure != null;
if (shouldSaveResult) {
heapDump = renameHeapdump(heapDump);
// 1
resultSaved = saveResult(heapDump, result);
}
if (!shouldSaveResult) {
...
showNotification(null, contentTitle, contentText);
} else if (resultSaved) {
...
// 2
PendingIntent pendingIntent =
DisplayLeakActivity.createPendingIntent(this, heapDump.referenceKey);
...
showNotification(pendingIntent, contentTitle, contentText);
} else {
onAnalysisResultFailure(getString(R.string.leak_canary_could_not_save_text));
}
...
}
@Override protected final void onAnalysisResultFailure(String failureMessage) {
super.onAnalysisResultFailure(failureMessage);
String failureTitle = getString(R.string.leak_canary_result_failure_title);
showNotification(null, failureTitle, failureMessage);
}
~~~
可以看到,只要當分析的堆信息文件保存成功之后,即在注釋1處返回的resultSaved為true時,才會執行注釋2處的邏輯,即創建一個供用戶點擊跳轉到DisplayLeakActivity的延時通知。最后給出一張源碼流程圖用于回顧本篇文章中LeakCanary的運作流程:
### 四、總結
性能優化一直是Android中進階和深入的方向之一,而內存泄漏一直是性能優化中比較重要的一部分,Android Studio自身提供了MAT等工具去分析內存泄漏,但是分析起來比較耗時耗力,因而才誕生了LeakCanary,它的使用非常簡單,但是經過對它的深入分析之后,才發現,**簡單的API后面往往藏著許多復雜的邏輯處理,嘗試去領悟它們,你可能會發現不一樣的世界**。
##### 參考鏈接:
* * *
1、LeakCanary V1.6.2 源碼
2、[一步步拆解 LeakCanary](https://mp.weixin.qq.com/s?__biz=MzA5MzI3NjE2MA==&mid=2650243402&idx=1&sn=e7632788e8e147320b26a1b006cabf4c&chksm=88637025bf14f933dcf90fbd1d7f9090e3802dd37759cac014ac1ed73c455fb9b5d9953bb89f&scene=38#wechat_redirect)
3、[深入理解 Android 之 LeakCanary 源碼解析](https://allenwu.itscoder.com/leakcanary-source)
鏈接:https://juejin.im/post/5e5330f8e51d4526d43f30ef
