
Hystrix提供了<mark>準實時的調用監控(Hystrix Dashboard)</mark>,Hystrix會持續地記錄所有<mark>通過Hystrix發起的請求</mark>的執行信息,<mark>并以統計報表和圖形的形式展示給用戶</mark>,包括每秒執行多少次請求,有多少次成功,多少次失敗等。
<br/>
Netflix通過 hystrix-metrics-event-stream 項目實現了對以上指標的監控。Spring Cloud也提供了Hystrix Dashboard的整合,對監控內容轉化成可視化界面。
<br/>
實現 Hystrix Dashboard 服務監控的步驟如下:
**1. 構建Hystrix監控模塊:cloud-comsumer-hystrix-dashboard9001**
**2. 在當前模塊的`pom.xml`中添加 Hystrix 相關依賴**
```xml
<dependencies>
<dependency>
<groupId>org.springframework.cloud</groupId>
<artifactId>spring-cloud-starter-netflix-hystrix-dashboard</artifactId>
</dependency>
<dependency>
<groupId>org.springframework.cloud</groupId>
<artifactId>spring-cloud-starter-netflix-hystrix</artifactId>
</dependency>
<dependency>
<groupId>org.springframework.boot</groupId>
<artifactId>spring-boot-starter-web</artifactId>
</dependency>
<dependency>
<groupId>org.springframework.boot</groupId>
<artifactId>spring-boot-starter-actuator</artifactId>
</dependency>
<dependency>
<groupId>org.springframework.boot</groupId>
<artifactId>spring-boot-starter-test</artifactId>
<scope>test</scope>
</dependency>
...
</dependencies>
```
**3. 當前模塊的`resources/application.yml`**
```yml
server:
port: 9001
spring:
application:
name: cloud-consumer-hystrix-dashboard
```
**4. 在當前模塊的啟動類上添加注解`@EnableHystrixDashboard`**
```java
@SpringBootApplication
@EnableHystrixDashboard
public class DashboardMain9001 {
public static void main(String[] args) {
SpringApplication.run(DashboardMain9001.class, args);
}
}
```
**5. 驗證當前模塊是否構建成功**
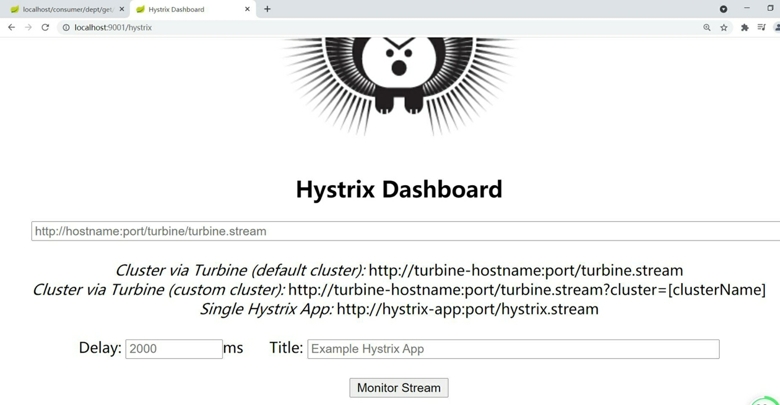
啟動當前模塊,然后訪問 http://localhost:9001/hystrix ,顯示如下頁面則構建成功!
**6. 在需要被監控的模塊的`pom.xml`中添加 actuator 和 hystrix 相關依賴**
<mark>只有添加了 Hystrix 依賴的模塊才能被監控</mark>。如何構建 Hystrix 模塊參考【服務熔斷->Hystrix服務端構建】小節。
```
下面將監控模塊:cloud-provider-hystrix-payment8001
```
**7. 驗證 cloud-provider-hystrix-payment8001 能否被 hystrix-dashborad 監控**
啟動被監控模塊 cloud-provider-hystrix-payment8001 與 監控模塊 cloud-comsumer-hystrix-dashboard9001。
(1)訪問 http://localhost:8001/payment/hystrix/circuit/10 測試被監控模塊是否成功啟動。
(2)訪問 http://localhost:8001/hystrix.stream 測試被監控是否被監控到,得到如下類似響應信息則是被監控到了。
```
data: {"type":"HystrixCommand","name":"paymentCircuitBreaker","group":"PaymentServiceImpl",
"currentTime":1636957796450,"isCircuitBreakerOpen":false,"errorPercentage":0,"errorCount":0,
"requestCount":0,"rollingCountBadRequests":0,"rollingCountCollapsedRequests":0,"rollingCountEmit":0,
"rollingCountExceptionsThrown":0,"rollingCountFailure":0,"rollingCountFallbackEmit":0,
"rollingCountFallbackFailure":0,"rollingCountFallbackMissing":0,
"rollingCountFallbackRejection":0,...
```
**8. 通過圖形化查看被監控模塊的情況**
(1)訪問 hystrix-dashboard 監控端 http://localhost:9001/hystrix 。
(2)將被監控模塊的監控地址 [http://localhost:8001/hystrix.stream](http://localhost:8001/hystrix.stream) 填寫到 hystrix-dashboard 監控端。
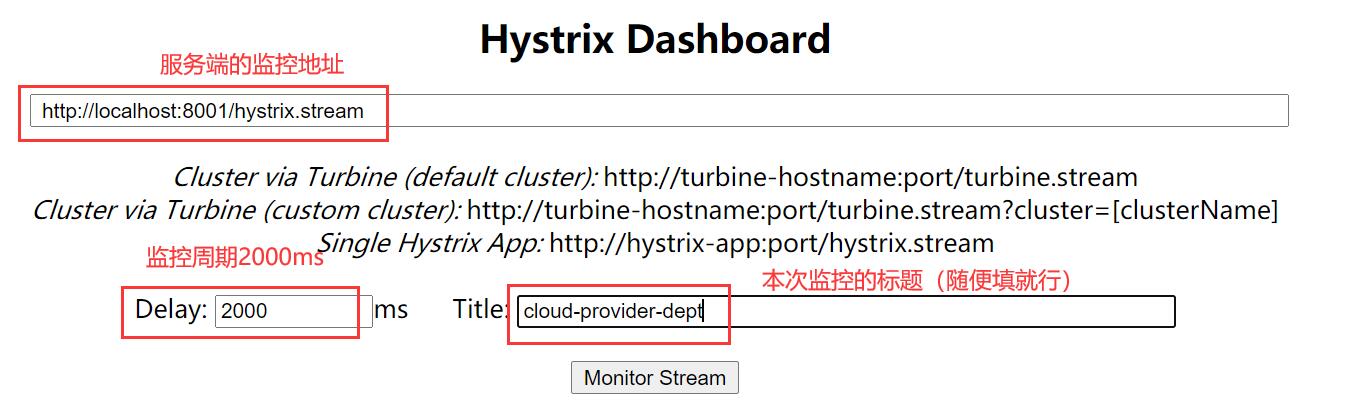
`Delay`:該參數用來控制服務器上輪詢監控信息的延遲時間,默認為2000毫秒,可以通過配置該屬性來降低客戶端的網絡和CPU消耗。
(3)點擊 【Monitor Stream】 按鈕后出現如界面。
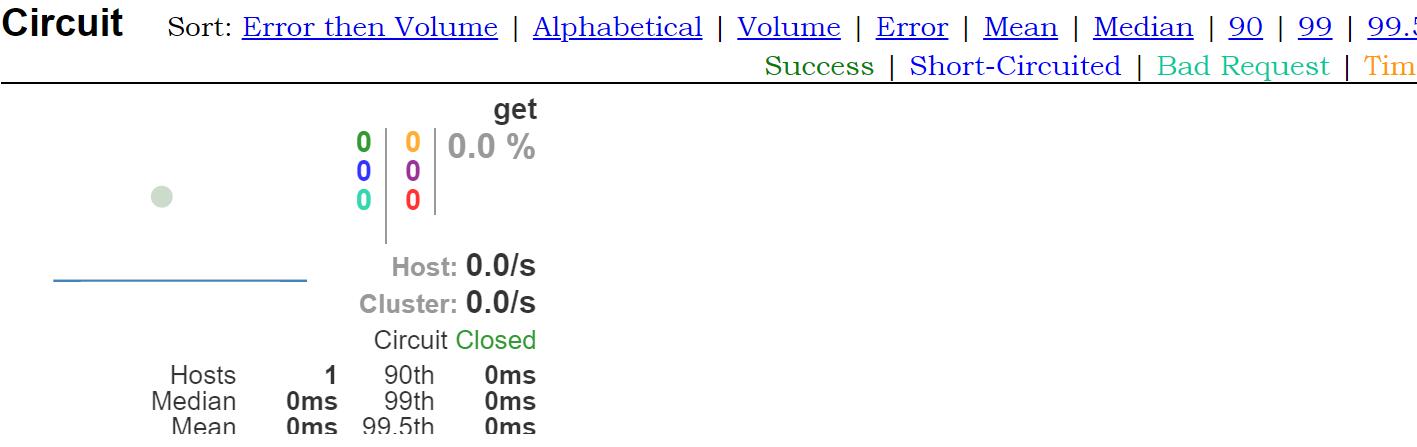
多刷新幾次 http://localhost:8001/payment/hystrix/circuit/10 ,模擬訪問被監控端,圖形就會有波動了。
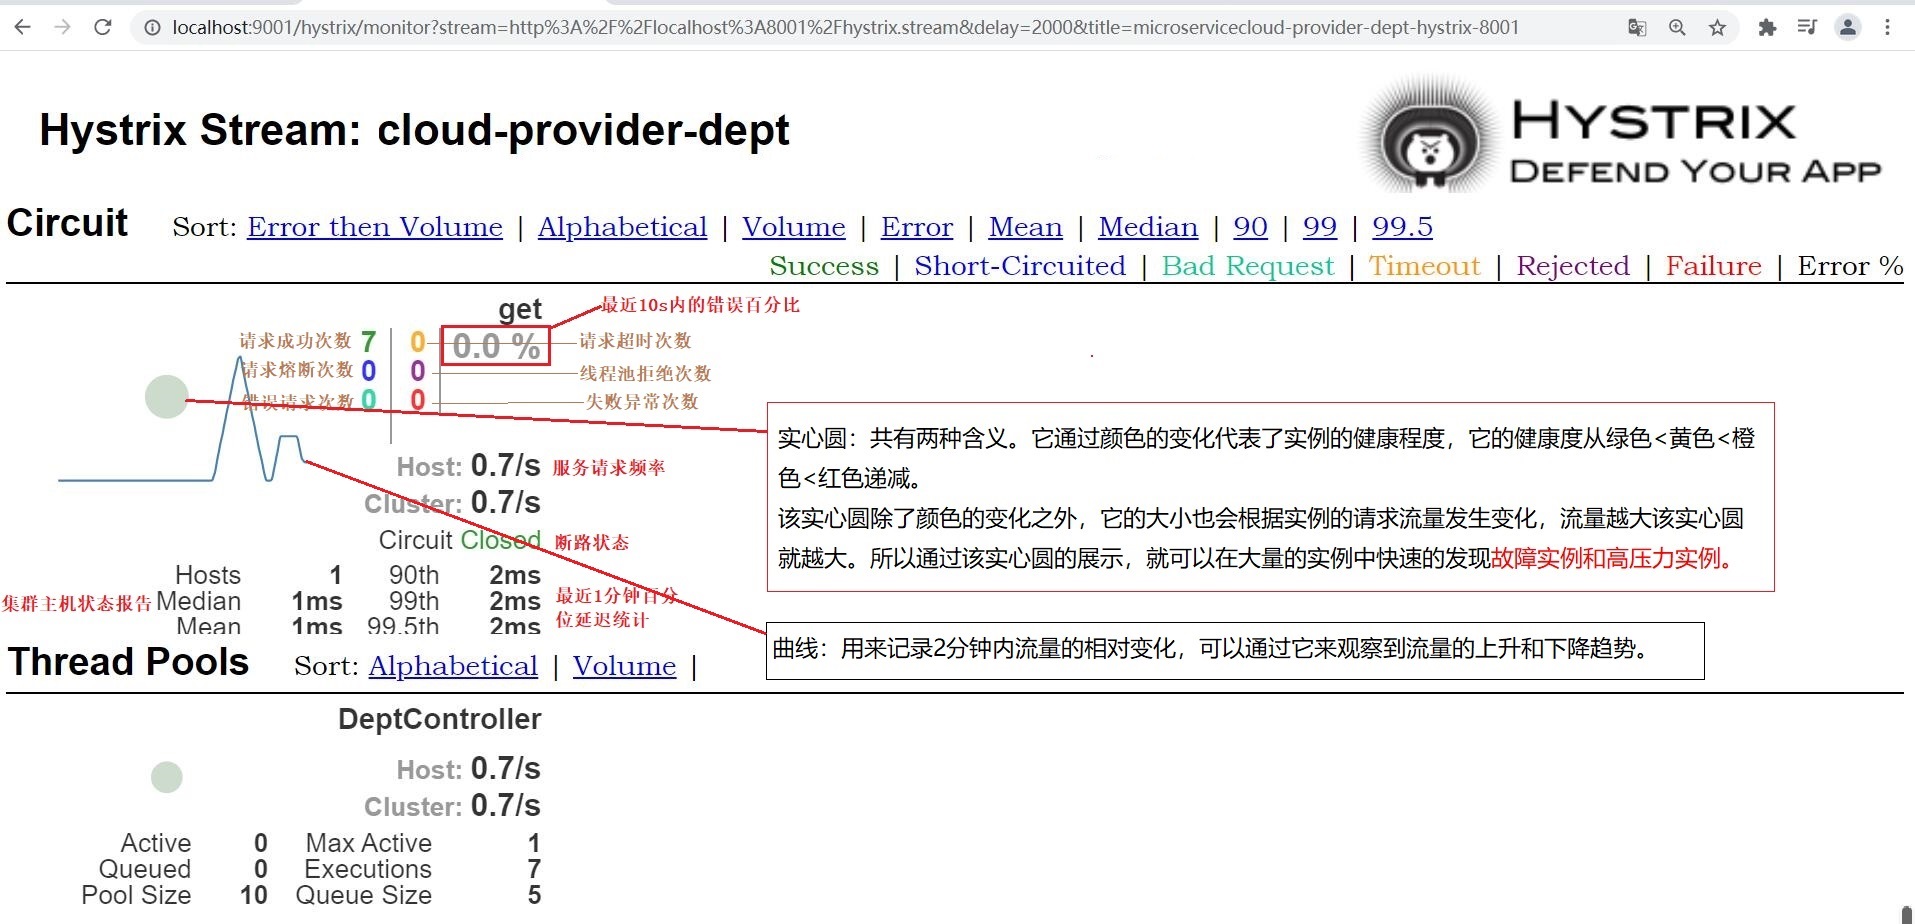
(4)讀圖。
- 微服務
- 微服務是什么?
- 微服務架構
- 微服務優缺點
- 微服務技術棧
- 微服務框架對比
- SpringCloud
- SpringCloud是什么
- SpringCloud與SpringBoot對比
- SpringCloud與Dubbo對比
- Rest微服務案例
- 總體介紹
- 父工程構建步驟
- 公共模塊構建步驟
- 服務端模塊構建步驟
- 消費端模塊構建步驟
- Eureka服務注冊與發現
- Eureka是什么
- Eureka原理
- Eureka注冊服務中心構建
- 向Eureka注冊已有微服務
- Eureka的自我保護機制
- Eureka服務發現
- Eureka集群配置
- Eureka與Zookeeper對比
- Ribbon負載均衡
- Ribbon是什么
- Ribbon負載均衡演示
- 構建服務端模塊
- 構建消費端模塊
- Ribbon核心組件IRule
- 自定義負載均衡策略
- Ribbon均衡策略優先級
- 輪詢策略算法
- OpenFeign負載均衡
- OpenFeign是什么
- 負載均衡演示
- 日志打印功能
- 導出功能
- Hystrix斷路器
- Hystrix是什么
- 服務熔斷
- Hystrix服務端構建
- 服務熔斷演示
- 服務熔斷類型
- HystrixProperty配置匯總
- 服務降級
- Hystrix客戶端構建
- 服務降級演示
- fallbackFactory
- 熔斷與降級
- 服務監控
- 網關服務Zuul
- Zuul是什么
- Zuul路由服務構建
- 設置訪問映射規則
- Config分布式配置中心
- Config分布式配置中心是什么
- Config服務端與Git通信
- Config客戶端獲取配置
- Config客戶端動態刷新
- Bus消息總線
- Bus消息總線是什么
- Bus消息總線原理
- 廣播通知設計思想
- 廣播通知演示
- 定點通知演示
- Stream消息驅動
- 為什么要引入Stream
- Stream消息驅動是什么
- Stream設計思想
- Stream流程和注解
- Stream案例演示
- 重復消費問題
- 消息持久化
- Sleuth分布式鏈路跟蹤
- Sleuth是什么
- 搭建鏈路監控
- SpringCloud Alibaba
- Nacos注冊與配置中心
- Nacos是什么
- 安裝并運行Nacos
- Nacos注冊中心
- 服務端入住Nacos
- 消費端入住Nacos
- Nacos負載均衡演示
- 服務注冊中心對比
- Nacos的AP和CP轉化
- Nacos配置中心
- 基礎配置演示
- Nacos分類配置
- Nacos集群搭建
- Sentinel實現熔斷與限流
- Sentinel是什么
- Sentinel環境搭建
- Sentinel監控微服務演示
- Sentinel流控規則
- 流量監控的作用
- 設置流控規則
- Sentinel降級規則
- 熔斷降級作用
- 設置降級規則
- Sentinel熱點限流
- 什么是熱點
- 設置熱點限流
- Sentinel系統限流
- @SentinelResource
- @SentinelResource屬性
- @SentinelResource限流演示
- @SentinelResource熔斷演示
- 規則持久化
- 熔斷框架比較
- Seata分布式事務
- 分布式事務問題
- Seata是什么
- Seata分布式事務過程
- Seata環境搭建
- 演示示例
- 業務說明
- 數據庫環境準備
- 微服務環境準備
- 測試
- Consul服務注冊與發現
- Consul是什么
- Consul能做什么
- 環境搭建
- Windows平臺
- 服務端入住Consul
- 消費端入住Consul
- 注冊中心對比
- Zookeeper服務注冊與發現
- Zookeeper是什么
- 環境搭建
- 服務端入住Zookeeper
- 消費端入住Zookeeper
- 網關服務Gateway
- Gateway是什么
- Gateway能做什么
- Gateway對比Zuul
- 三大核心概念
- Gateway工作流
- 環境搭建
- 網關路由配置方式
- 配置文件配置
- 代碼中配置
- 動態路由
- Predicate斷言
- 斷言是什么
- 常用斷言
- Filter過濾器
- 過濾器是什么
- 過濾器種類
- 自定義過濾器