
文件路徑:D:\ireport365\ireport365.war.bk\js\enduser\designer\vs-component-echarts.js
一 添加桑基圖
```
{
name: "",
type: "sanKey",
coverImage: contextPath + "/images/componenttypes/" + locale + "/echarts/zh\_pictogram.png",
coverImageWidth: a,
data: true,
dimensions: 2,
measures: 1,
tip: "桑基圖"
}
```
二 添加 option對象 搜索dynamicBarOptionTemplate 在下面添加下面代碼
```
// 桑基圖 對象 start
var SankeysourceData = [{name:'市直歸集',value:286.29},{name:'省級回流',value:286.29},{name:'五區歸集',value:286.29},{name:'數據中心',value:286.29},{name:'綜合治稅',value:286.29,},{name:'市場監管',value:286.29},{name:'公共信用',value:286.29},{name:'數據開放',value:286.29}];
var Sankeylinks = [{source:'市直歸集',target:'數據中心',value:6},{source:'省級回流',target:'數據中心',value:3},{source:'五區歸集',target:'數據中心',value:3},{source:'數據中心',target:'綜合治稅',value:5},{source:'數據中心',target:'市場監管',value:2},{source:'數據中心',target:'公共信用',value:3},{source:'數據中心',target:'數據開放',value:2}];
var SankeyOptionTemplate = {
tooltip: {
show: true,
trigger: "item",
formatter: "{b} : {c}",
axisPointer: {
type: "shadow"
}
},
series: [{
type: 'sankey',
layout: 'none',
top:"12%",
bottom: '21%',
left:'3%',
focusNodeAdjacency: 'allEdges',
draggable: false,//禁止拖拽
data: SankeysourceData,
links: Sankeylinks,
label: {
normal:{
color:"#333",
fontSize:14,
rich:{
white:{
fontSize:12,
padding:[10,0,0,0]
}
}
}
},
lineStyle: {
normal: {
color: 'source',
curveness: 0.5
}
},
itemStyle: {
normal: {
borderWidth: 1,
borderColor: 'transparent'
}
}
}],
color:colorValueSeries
}
// 桑基圖 對象 end
```
三 copy 對象模板
如圖位置

```
case "sanKey":
option = angular.copy(SankeyOptionTemplate);
break;
```
四 搜索 getThresholdCategoryName 和 isShowEventCategory 分別添加下面代碼
如圖
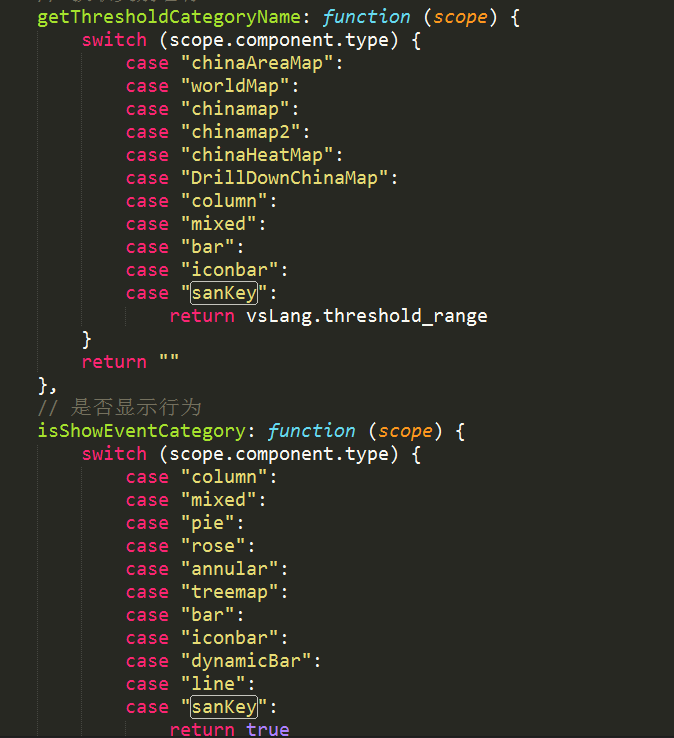
```
case "sanKey":
```
五 添加數據處理函數 搜索 internalRefreshAnnularModelData 在下面添加下面代碼
```
var internalRefreshSanKeyModelData = function () {
var option = component.config.chartConfig;
var dimensions = component.config.datasourceConfig.dimensions;
var measures = component.config.datasourceConfig.measures;
var data = component.context.data;
if(data == null || data.length < 1){
return;
}
var measureIdx = 0;
if (component.config.receiveMeasureLink != null && component.config.receiveMeasureLink === true) {
var newMeasures = scope.getSelectedLinkMeasure(component, component.config.datasourceConfig.measures);
for (var i = 0; i < measures.length; i++) {
if (newMeasures[i] != null) {
measureIdx = i;
break
}
}
}
if (dimensions.length >= 2 && measures.length > 0) {
var links = new Array();
var dataObj = {};
var dataNames = new Array();
for (var i in data) {
var link = {
source:data[i][dimensions[dimensions.length - 2].name],
target:data[i][dimensions[dimensions.length - 1].name],
value:data[i][measures[measures.length - 1].name]
};
links.push(link);
if (null == dataObj[link.source]) {
dataObj[link.source] = 1;
dataNames.push({name:link.source});
}
if (null == dataObj[link.target]) {
dataObj[link.target] = 1;
dataNames.push({name:link.target});
}
}
option.series[0].links = links;
option.series[0].data = dataNames;
option.series[0].name = measures[measureIdx].label;
option.series[0].seriesIndex = measureIdx;
}
// 重新繪制圖形并清除以前的
setTimeout(function () {
component.context.chart.setOption(option, true)
})
if (component.config["measureAlias_" + measureIdx] != null && component.config["measureAlias_" + measureIdx].length > 0) {
option.series[0].name = component.config["measureAlias_" + measureIdx]
}
// 谷建文 2019.11.19
option.tooltip.formatter = function (p) {
if (component.config.tooltipStatus != null && component.config.tooltipStatus === "hide") {
return ""
}
var seriesIndex = option.series[0].seriesIndex;
if (!VSUtils.isEmpty(component.config.tooltipValueScript)) {
try {
var f = eval("(function(name, params, VSUtils){ " + Base64.decode(component.config.tooltipValueScript) + "})");
return f.call(null, p.name, p, VSUtils)
} catch (e) {
console.log(e)
}
}
var unit = component.config["unit_" + seriesIndex];
if (unit == null) {
unit = ""
}
var displayValue = $vsUtils.processValue(p.value, component.config["digit_" + seriesIndex]);
var str = p.name + "<br/>" + p.seriesName + ": " + $vsUtils.comdifyValue(displayValue) + "" + unit;
if(displayValue == 0){
str = ''
}
var measures = scope.component.config.datasourceConfig.measures;
var _data = scope.component.context.data;
if (_data != null) {
for (var m = 1; m < measures.length; m++) {
var seriesIdx = m;
var value = _data[p.dataIndex][measures[m].name];
var unit = component.config["unit_" + seriesIdx];
if (unit == null) {
unit = ""
}
if (component.config["valueType_" + seriesIdx] != null && component.config["valueType_" + seriesIdx] === "percent") {
value = value * 100;
unit = "%"
}
value = $vsUtils.processValue(value, component.config["digit_" + seriesIdx]);
var _label = measures[m].label;
if (component.config["measureAlias_" + m] != null && component.config["measureAlias_" + m].length > 0) {
_label = component.config["measureAlias_" + m]
}
str += "<br/>" + _label + " : " + $vsUtils.comdifyValue(value) + unit
}
}
return str
};
// end
rebuildPieChart(scope, element, option);
if (component.config.hideOnFirstShow && !component.context.firstShowTooltip) {
component.context.firstShowTooltip = true;
return
}
};
```
六 添加數據方法調用 如圖位置
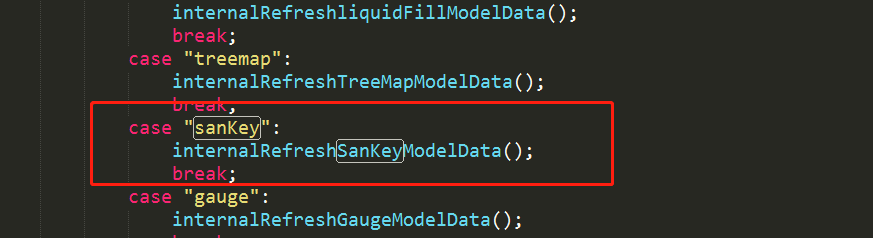
```
case "sanKey":
internalRefreshSanKeyModelData();
break;
```
七 添加 圖形維度數量 搜索 case "dynamicBar": 位置如圖
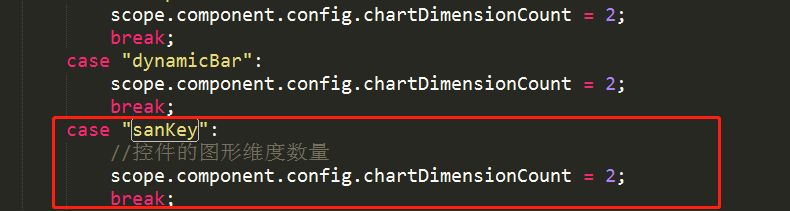
```
case "sanKey":
//控件的圖形維度數量
scope.component.config.chartDimensionCount = 2;
break;
```
八 添加 色塊配置項 搜索case "dynamicBar": 如圖位置
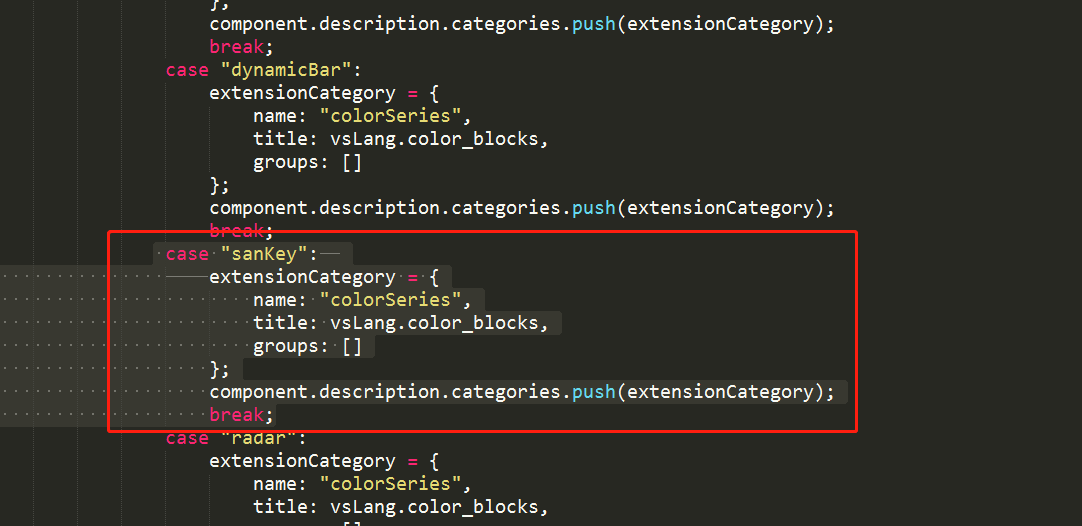
```
case "sanKey":
extensionCategory = {
name: "colorSeries",
title: vsLang.color_blocks,
groups: []
};
component.description.categories.push(extensionCategory);
break;
```
九 添加配置項 搜索 case "treemap": 在樹圖的配置項下面添加
如圖
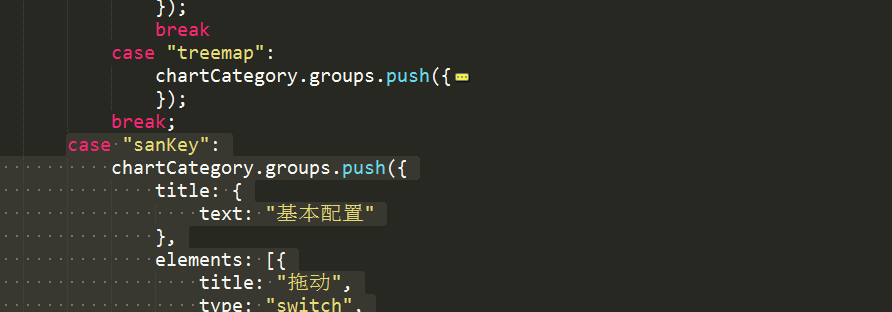
```
case "sanKey":
chartCategory.groups.push({
title: {
text: "基本配置"
},
elements: [{
title: "拖動",
type: "switch",
bind: "draggable",
on: vsLang.on,
off: vsLang.off
},{
title: "字體顏色",
type: "colorpicker",
bind: "FontColor"
}, {
title: "字體大小",
type: "configSlide",
bind: "FontSize",
config: {
slideEnd: 100
}
},{
title: "邊框顏色",
type: "colorpicker",
bind: "borderColor"
}, {
title: "邊框寬度",
type: "configSlide",
bind: "borderWidth",
config: {
slideEnd: 100
}
}]
});
//監聽draggabler屬性
scope.$watch('component.config.draggable', function(newValue, oldValue){
if(newValue != null && (oldValue == null || oldValue !== newValue)){
var option = component.config.chartConfig;
option.series[0].draggable = newValue;
scope.component.context.chart.setOption(option, true)
}
});
//監聽FontColor屬性
scope.$watch('component.config.FontColor', function(newValue, oldValue){
if(newValue != null && (oldValue == null || oldValue !== newValue)){
var option = component.config.chartConfig;
option.series[0].label.normal.color = newValue;
scope.component.context.chart.setOption(option, true)
}
});
//監聽FontSize屬性
scope.$watch('component.config.FontSize', function(newValue, oldValue){
if(newValue != null && (oldValue == null || oldValue !== newValue)){
var option = component.config.chartConfig;
option.series[0].label.normal.fontSize = newValue;
scope.component.context.chart.setOption(option, true)
}
});
//監聽borderColor屬性
scope.$watch('component.config.borderColor', function(newValue, oldValue){
if(newValue != null && (oldValue == null || oldValue !== newValue)){
var option = component.config.chartConfig;
option.series[0].itemStyle.normal.borderColor = newValue;
scope.component.context.chart.setOption(option, true)
}
});
//監聽borderWidth屬性
scope.$watch('component.config.borderWidth', function(newValue, oldValue){
if(newValue != null && (oldValue == null || oldValue !== newValue)){
var option = component.config.chartConfig;
option.series[0].itemStyle.normal.borderWidth = newValue;
scope.component.context.chart.setOption(option, true)
}
});
break;
```
十 添加提示框 代碼 搜索 vsLang.tooltip_window 在上面添加下面代碼
如圖位置

```
case "sanKey":
```
十一 添加提示框配置的監聽 搜索 component.config.tooltipBgColor 在上面添加代碼
如圖位置
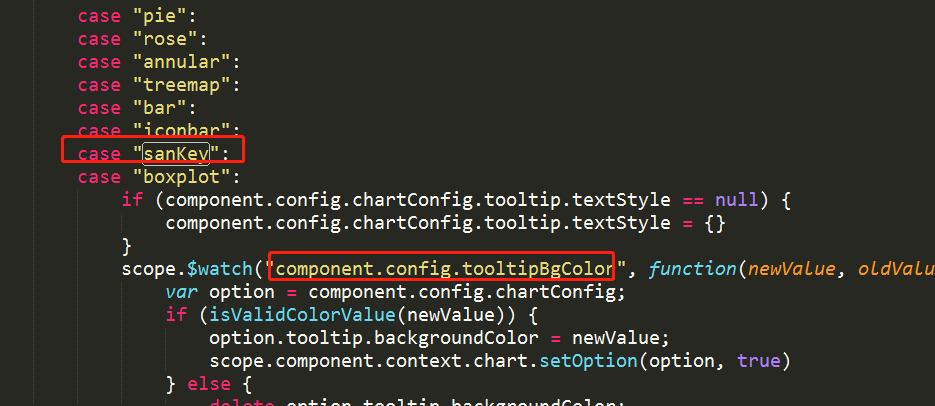
```
case "sanKey":
```
十二 添加 色塊 配置項 搜索 case "dynamicBar":
如圖位置

```
case "sanKey":
extensionCategory.groups.push({
title: {
text: vsLang.color_series
},
elements: [{
title: vsLang.color_series,
type: "colorSeries",
bind: "colorSeries"
}]
});
component.config.colorSeries = option.color;
break;
```
十三 添加色塊監聽 搜索 case "dynamicBar": 在下面添加 位置如圖
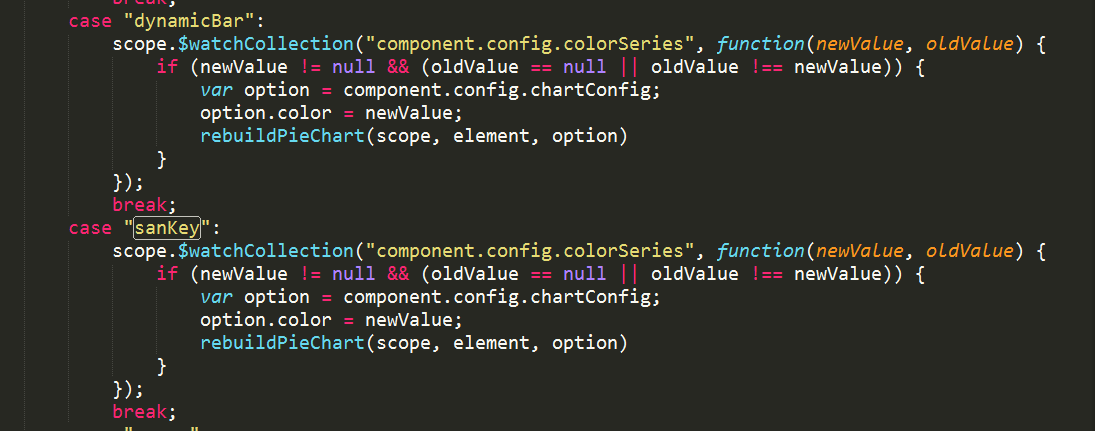
```
case "sanKey":
scope.$watchCollection("component.config.colorSeries", function(newValue, oldValue) {
if (newValue != null && (oldValue == null || oldValue !== newValue)) {
var option = component.config.chartConfig;
option.color = newValue;
rebuildPieChart(scope, element, option)
}
});
break;
```
# **分享頁 design.js**
一 搜索 internalRefreshdynamicBarChartModelData 在下面添加代碼
```
var internalRefreshSanKeyModelData = function () {
var option = component.config.chartConfig;
var dimensions = component.config.datasourceConfig.dimensions;
var measures = component.config.datasourceConfig.measures;
var data = component.context.data;
if(data == null || data.length < 1){
return;
}
var measureIdx = 0;
if (component.config.receiveMeasureLink != null && component.config.receiveMeasureLink === true) {
var newMeasures = scope.getSelectedLinkMeasure(component, component.config.datasourceConfig.measures);
for (var i = 0; i < measures.length; i++) {
if (newMeasures[i] != null) {
measureIdx = i;
break
}
}
}
if (dimensions.length >= 2 && measures.length > 0) {
var links = new Array();
var dataObj = {};
var dataNames = new Array();
for (var i in data) {
var link = {
source:data[i][dimensions[dimensions.length - 2].name],
target:data[i][dimensions[dimensions.length - 1].name],
value:data[i][measures[measures.length - 1].name]
};
links.push(link);
if (null == dataObj[link.source]) {
dataObj[link.source] = 1;
dataNames.push({name:link.source});
}
if (null == dataObj[link.target]) {
dataObj[link.target] = 1;
dataNames.push({name:link.target});
}
}
option.series[0].links = links;
option.series[0].data = dataNames;
option.series[0].name = measures[measureIdx].label;
option.series[0].seriesIndex = measureIdx;
}
// 重新繪制圖形并清除以前的
setTimeout(function () {
component.context.chart.setOption(option, true)
})
if (component.config["measureAlias_" + measureIdx] != null && component.config["measureAlias_" + measureIdx].length > 0) {
option.series[0].name = component.config["measureAlias_" + measureIdx]
}
// 谷建文 2019.11.20
option.tooltip.formatter = function (p) {
if (component.config.tooltipStatus != null && component.config.tooltipStatus === "hide") {
return ""
}
var seriesIndex = option.series[0].seriesIndex;
if (!VSUtils.isEmpty(component.config.tooltipValueScript)) {
try {
var f = eval("(function(name, params, VSUtils){ " + Base64.decode(component.config.tooltipValueScript) + "})");
return f.call(null, p.name, p, VSUtils)
} catch (e) {
console.log(e)
}
}
var unit = component.config["unit_" + seriesIndex];
if (unit == null) {
unit = ""
}
var displayValue = $vsUtils.processValue(p.value, component.config["digit_" + seriesIndex]);
var str = p.name + "<br/>" + p.seriesName + ": " + $vsUtils.comdifyValue(displayValue) + "" + unit;
if(displayValue == 0){
str = ''
}
var measures = scope.component.config.datasourceConfig.measures;
var _data = scope.component.context.data;
if (_data != null) {
for (var m = 1; m < measures.length; m++) {
var seriesIdx = m;
var value = _data[p.dataIndex][measures[m].name];
var unit = component.config["unit_" + seriesIdx];
if (unit == null) {
unit = ""
}
if (component.config["valueType_" + seriesIdx] != null && component.config["valueType_" + seriesIdx] === "percent") {
value = value * 100;
unit = "%"
}
value = $vsUtils.processValue(value, component.config["digit_" + seriesIdx]);
var _label = measures[m].label;
if (component.config["measureAlias_" + m] != null && component.config["measureAlias_" + m].length > 0) {
_label = component.config["measureAlias_" + m]
}
str += "<br/>" + _label + " : " + $vsUtils.comdifyValue(value) + unit
}
}
return str
};
// end
rebuildPieChart(scope, element, option);
if (component.config.hideOnFirstShow && !component.context.firstShowTooltip) {
component.context.firstShowTooltip = true;
return
}
};
```
二 搜索 case "dynamicBar": 在下面添加頂用處理數據的方法
如圖位置
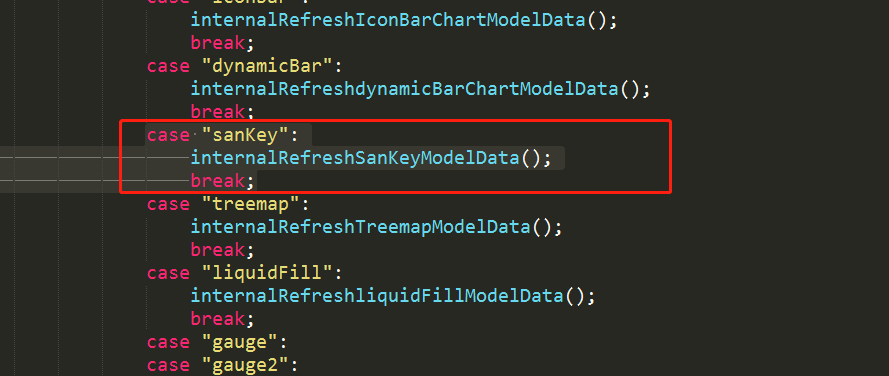
```
case "sanKey":
internalRefreshSanKeyModelData();
break;
```
三 搜索 case "iconbar": 在下面添加下面代碼
如圖位置
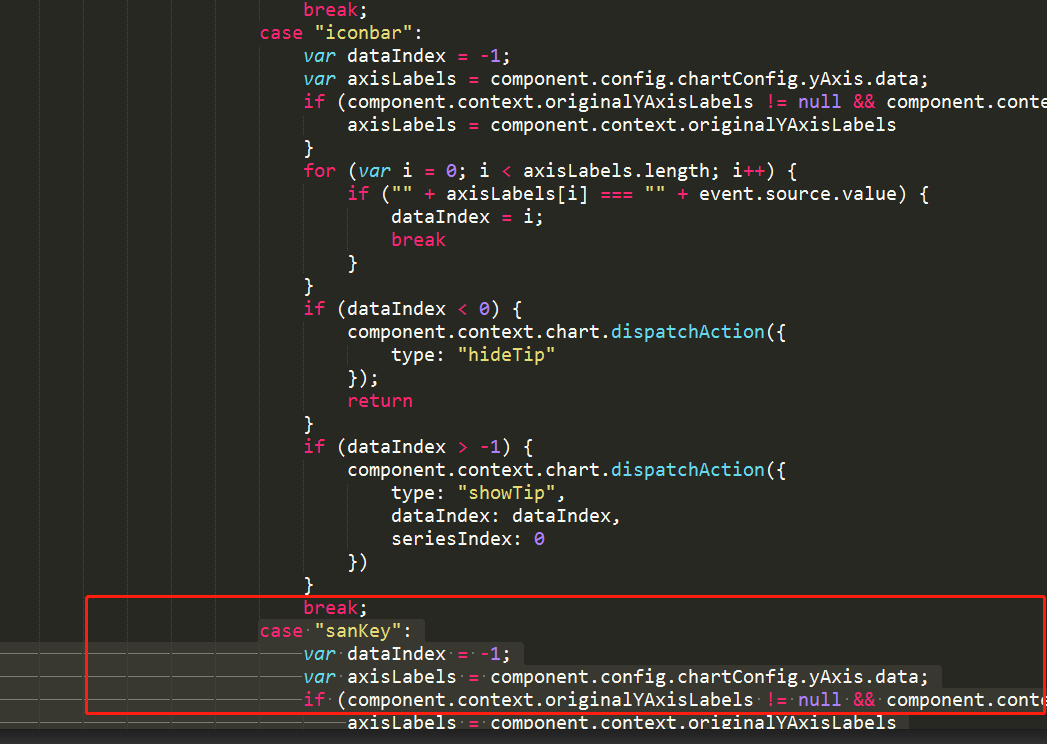
```
case "sanKey":
var dataIndex = -1;
var axisLabels = component.config.chartConfig.yAxis.data;
if (component.context.originalYAxisLabels != null && component.context.originalYAxisLabels.length > dataIndex) {
axisLabels = component.context.originalYAxisLabels
}
for (var i = 0; i < axisLabels.length; i++) {
if ("" + axisLabels[i] === "" + event.source.value) {
dataIndex = i;
break
}
}
if (dataIndex < 0) {
component.context.chart.dispatchAction({
type: "hideTip"
});
return
}
if (dataIndex > -1) {
component.context.chart.dispatchAction({
type: "showTip",
dataIndex: dataIndex,
seriesIndex: 0
})
}
break;
```
四 搜索 case "iconbar": 在下面添加 代碼
如圖位置
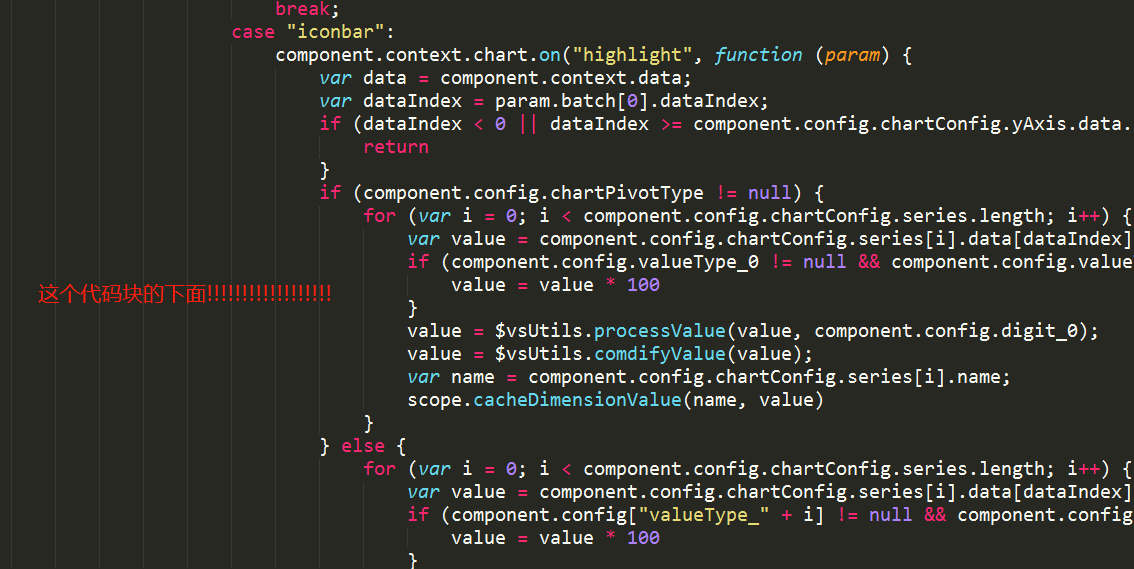
```
case "sanKey":
component.context.chart.on("highlight", function (param) {
var dataIndex = param.batch[0].dataIndex;
if (dataIndex < 0 || dataIndex >= component.config.chartConfig.yAxis.data.length) {
return
}
if (component.config.chartPivotType != null) {
for (var i = 0; i < component.config.chartConfig.series.length; i++) {
var value = component.config.chartConfig.series[i].data[dataIndex];
if (component.config.valueType_0 != null && component.config.valueType_0 === "percent") {
value = value * 100
}
value = $vsUtils.processValue(value, component.config.digit_0);
value = $vsUtils.comdifyValue(value);
var name = component.config.chartConfig.series[i].name;
scope.cacheDimensionValue(name, value)
}
} else {
for (var i = 0; i < component.config.chartConfig.series.length; i++) {
var value = component.config.chartConfig.series[i].data[dataIndex];
if (component.config["valueType_" + i] != null && component.config["valueType_" + i] === "percent") {
value = value * 100
}
value = $vsUtils.processValue(value, component.config["digit_" + i]);
value = $vsUtils.comdifyValue(value);
if (component.config.datasourceConfig.measures != null) {
var name = component.config.datasourceConfig.measures[0].label;
scope.cacheDimensionValue(name, value)
}
}
}
var value = component.config.chartConfig.yAxis.data[dataIndex];
if (component.context.originalYAxisLabels != null && component.context.originalYAxisLabels.length > dataIndex) {
value = component.context.originalYAxisLabels[dataIndex]
}
if (component.context.tooltipDataValue != null && "" + component.context.tooltipDataValue === "" + value) {
return
}
component.context.tooltipDataValue = value;
scope.notifyDimensionValueChange(null, scope.getLastDimension(), value)
});
break;
```
- video
- treemap
- mian.html文件注釋
- 配置項tab
- 配置項屬性
- internalRefreshAxisMdelData函數梳理
- 函數配置項-engine文件
- 替換數據源流程
- design.js
- 樹圖
- 下鉆 廢棄
- 人體圖
- 下鉆地圖
- 行列互轉
- 預覽樣式
- logo旁邊的報表名
- echarts 組件生成圖片
- 數據集樣式
- 頭部 黑色head
- 手機 ipad 圖片
- k線圖部分
- 平臺管理css樣式
- 目錄css和平板的邊距
- 設計頁-數據源-目錄
- 數據集 - 查看數據表 -按鈕和目錄樣式
- 報表列表頁按鈕css
- 角色管理頁按鈕css
- 推送通知按鈕css
- 子賬號按鈕css
- 數據連接
- openlayers地圖線路圖
- openlayers4_map_designer.js
- openlayers4_map_view.js
- 說明
- 常用圖標小bug
- echarts 氣泡地圖
- echarts 線路軌跡圖
- 導出pdf
- 可視化sql--css
- 表格滾動
- 主題色
- 時間軸
- 分享彈框
- 管理平臺header和菜單
- 報表平臺和菜單
- 初始化組件顏色
- 其他彈框
- olap分析樣式-廢棄
- 3d地圖柱狀圖
- 關系圖
- olap分析
- 地區地圖
- k線圖相關屬性設置
- 世界地圖
- 時間軸(new)
- 選擇省份下轉地圖
- 選擇省市飛線地圖
- 面積預警地圖默認顏色
- 組件覆層開關組件
- 汽車儀表盤bug
- 雷達圖bug修復不能分享的問題
- 餅狀 條形圖 自動播放
- 臨時用
- 自動輪播
- 方形元素 按鈕浮動報錯
- 面積預警地圖整合可選擇省市區
- 下鉆地圖添加返回按鈕
- 下鉆地圖修復預警bug
- 基本時間組件
- 添加時鐘組件
- 3d地球組件
- 盒須圖
- 組件加載動畫
- 報表背景漸變色
- 主題模板
- 沒用
- 3機房第三方組件
- 設計
- 分享
- 3d機房需要的靜態資源
- cesium地球需要的文件以及樣式
- cesium地球
- 設計頁
- 分享頁
- 圖標條形圖
- 世豪-前端代碼整理
- component.css 文件新添加
- 雜項
- index.jsp
- designer.css 樣式暫時不整理 里面比較雜
- vs-common.js 新加生成html2canvas pdf
- vs-component-basic.js 完
- vs-component-datasource.js 完
- vs-component-engine.js 完
- vs-component-widget-grid.js 完
- vs-component-widget-square.js 完
- vs-designer.js 完
- vs-designer-component.js 完
- vs-designer-report.js 完
- vs-designer-reportpage.js 完
- vs-component-echarts.js 完
- main.html 完
- component.html 新加組件設置頁模板
- 以前的報表頁設置控制器---做個記錄
- 大概修改過的代碼
- 2019-5-8 修改皮膚控制器
- 選擇模板
- 桑基圖2019-11-20
- bug 修正 2019-11-21
- 插圖柱狀圖
- cesiumchart組件
- gis 地圖 聯動 彈框 圖標
- 動態面積圖添加按鈕類配置項
- 玫瑰圖形組件
- cesium 圖形 和three.js 沖突的bug
- gis 地圖 默認圖層
- 網格標簽
- gis 點圖 值域
- gis 面圖 值域
- 按鈕圖標添加提示框
- 百度地圖
- 剩余的組件
- gulp說明文檔
- 色斑圖加透明