
### 2.4.1. 重塑 reshape
```
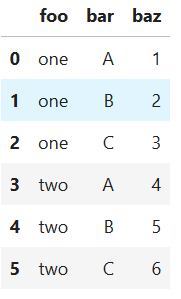
df = pd.DataFrame({'foo': ['one','one','one','two','two','two'],
'bar': ['A', 'B', 'C', 'A', 'B', 'C'],
'baz': [1, 2, 3, 4, 5, 6]})
df
```
```
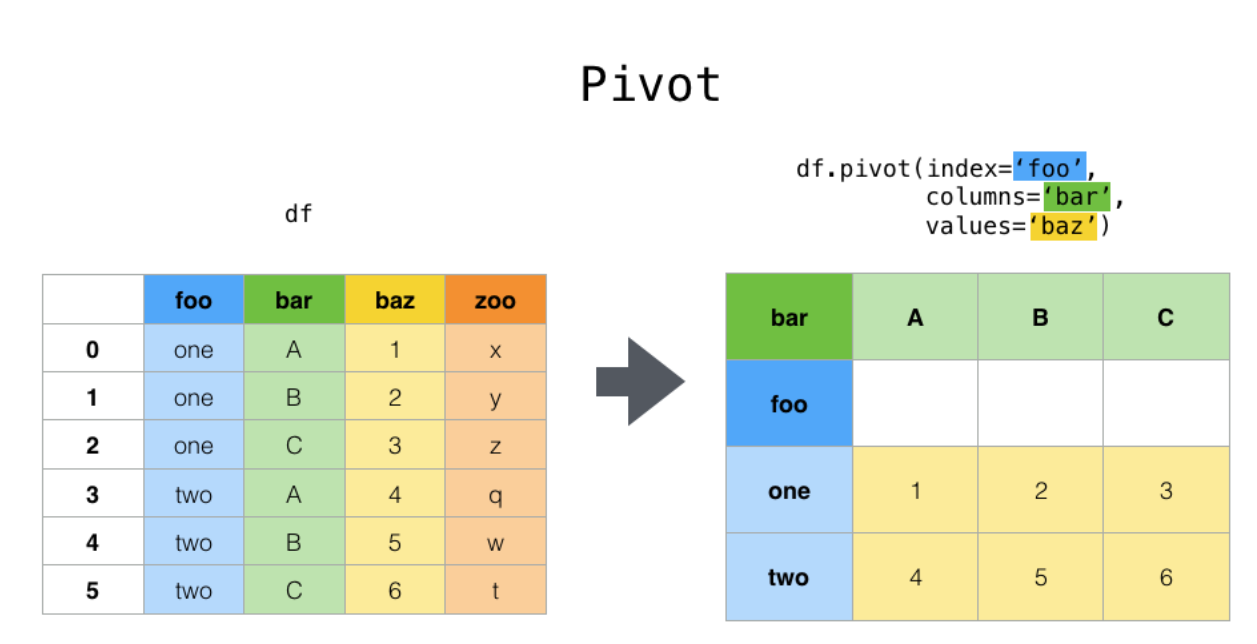
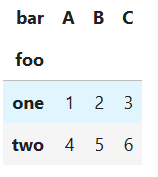
#pivot將foo列不重復的值變為索引列。bar列不重復的值變為列名。使用pivot index和columns列組合不能有重復的。兩列的唯一組合對應同行的數據值
df.pivot(index='foo', columns='bar', values='baz')
```
*****
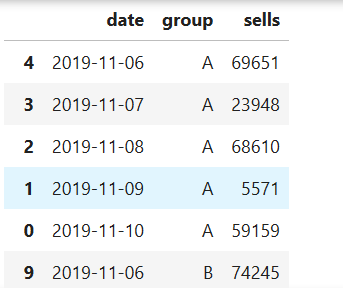
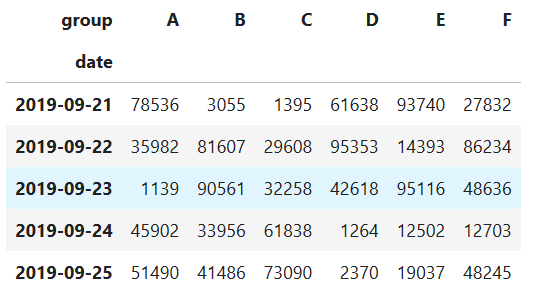
最常用的地方是時間序列數據:
* date:代表日期
* group:代表銷售小組
* sells:銷售小組的業績
index是日期用來表示每一條觀測值,columns就是唯一的變量!
```
from datetime import datetime,timedelta
today = datetime.now().date()
#獲取從今天到4天前的5個日期,把這五個值復制6遍放入一個列表中
date = [today - timedelta(days = i) for i in range(5)] * 6
# a,b,c,d,e,f各復制5次放到一個列表中。列表可以通過+拼接到一起
group = ['A']*5 + ['B'] * 5 + ['C']*5 + ['D'] * 5 +['E']*5 +['F']*5
# 生成1000到100000的30個值,放到一個列表中
sells = np.random.randint(1000,100000,size = (30,)).tolist()
#創建字典
data = {"date":date,"group":group,"sells":sells}
#根據字典生成dataFrame
df_pivot = pd.DataFrame(data)
# dataFrame值排序,先按組排,組內再按日期排
df_pivot.sort_values(['group','date'])
```
*****
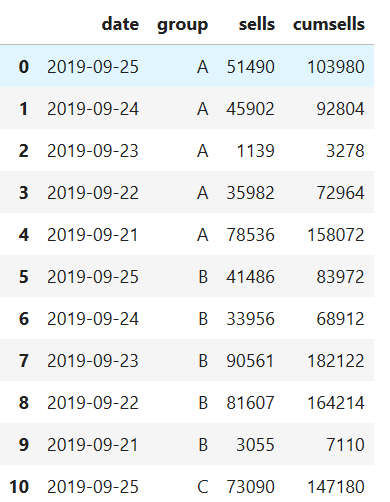
```
df_pivot.pivot(index='date',columns='group',values='sells')
```
*****
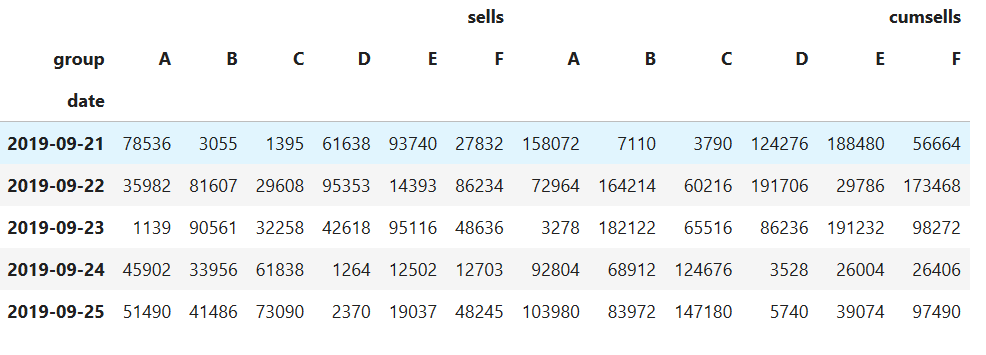
如果沒有指定values參數,程序會計算出所有可被計算的列,并在最上方形成多層索引
```
df_pivot['cumsells'] = df_pivot['sells']*2+1000
df_pivot
```
```
#多個列的值被計算顯示出來,并在最上方形成多層索引
df_pivot.pivot(index='date',columns='group')
```
*****
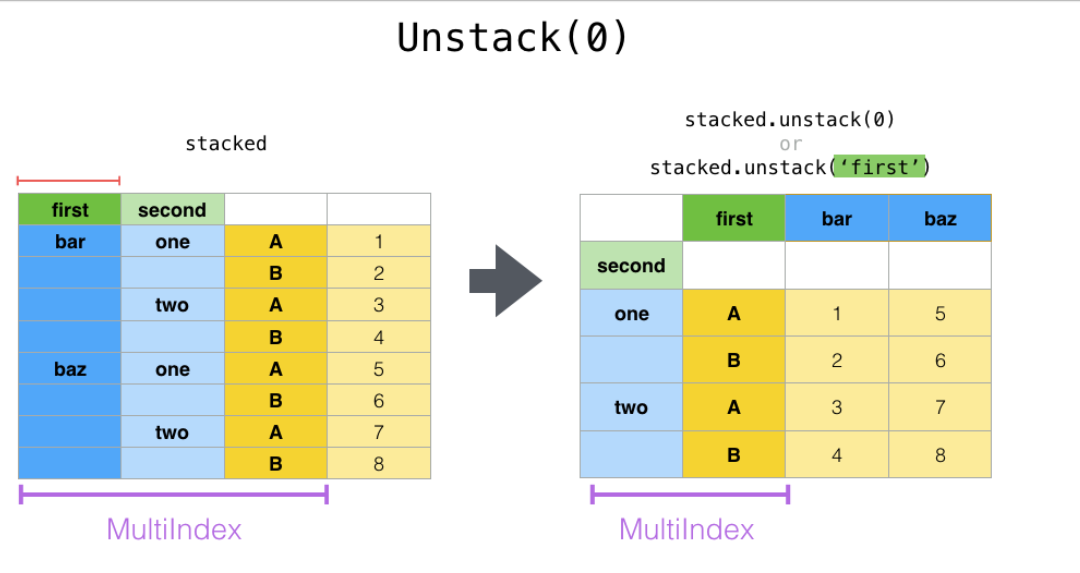
**STACK**
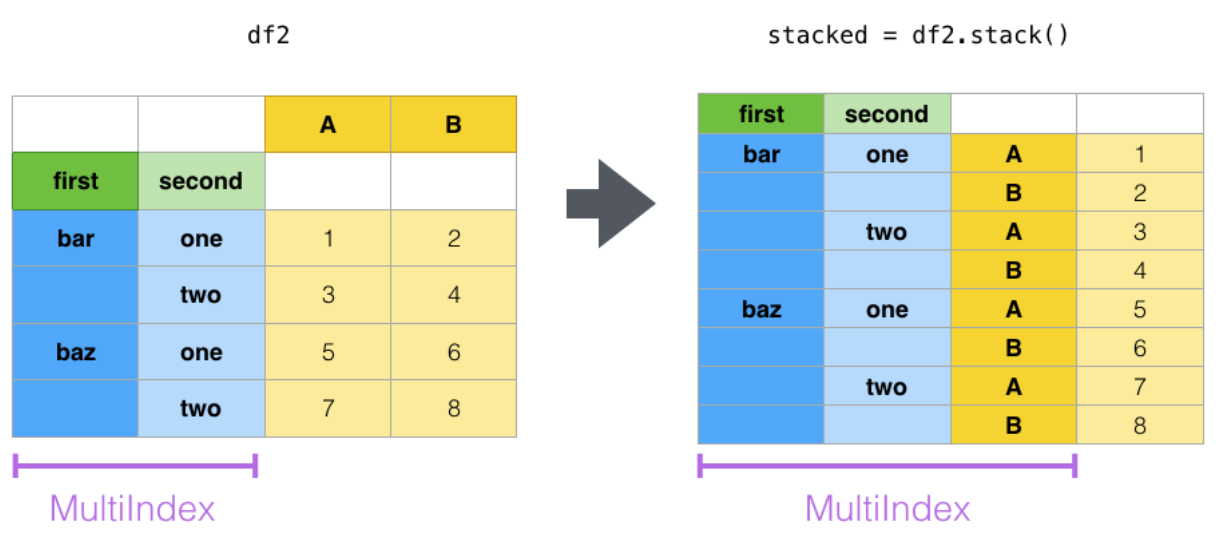
**stack()與 unstack()** 函數都是用于多重索引的
* stack():column轉換成index
* unstack():index轉換成column
```
# 將列表變成元組
tuples = list(zip(*[['bar', 'bar', 'baz', 'baz',
'foo', 'foo', 'qux', 'qux'],
['one', 'two', 'one', 'two',
'one', 'two', 'one', 'two']]))
#根據元組創建多層索引,第一二層分別命名為first second
index = pd.MultiIndex.from_tuples(tuples, names=['first', 'second'])
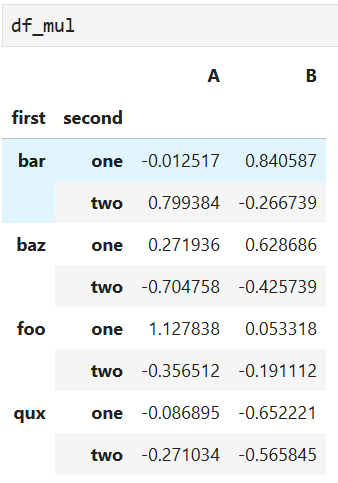
# 隨機生成8*2的數,index作為索引,初始化列名
df_mul = pd.DataFrame(np.random.randn(8, 2), index=index, columns=['A', 'B'])
```
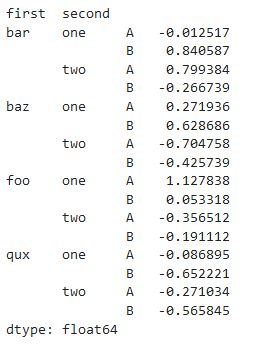
```
# 把列名也變成索引,由索引和列對應的值轉換為每個值可以由索引直接確定
df_mul.stack()
```
新生成的數據集會形成多少行呢?
* m : 行數
* n: 列數
* 總數量:m * n
*****
stack()和unstack()可以看做互逆過程。unstack將由多層索引可以直接確定的值轉換為有多層索引和列名確定一個值
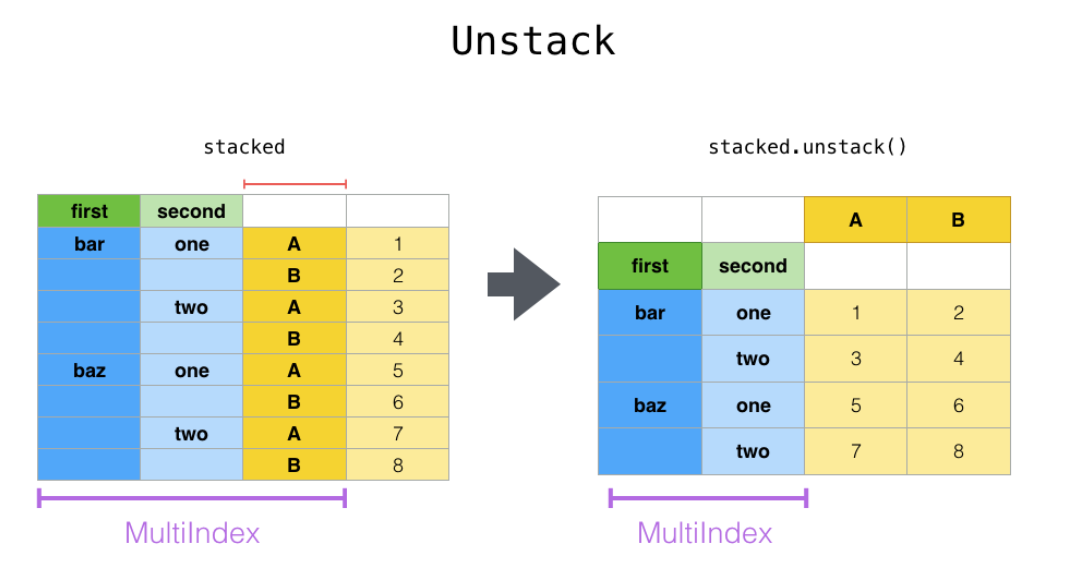
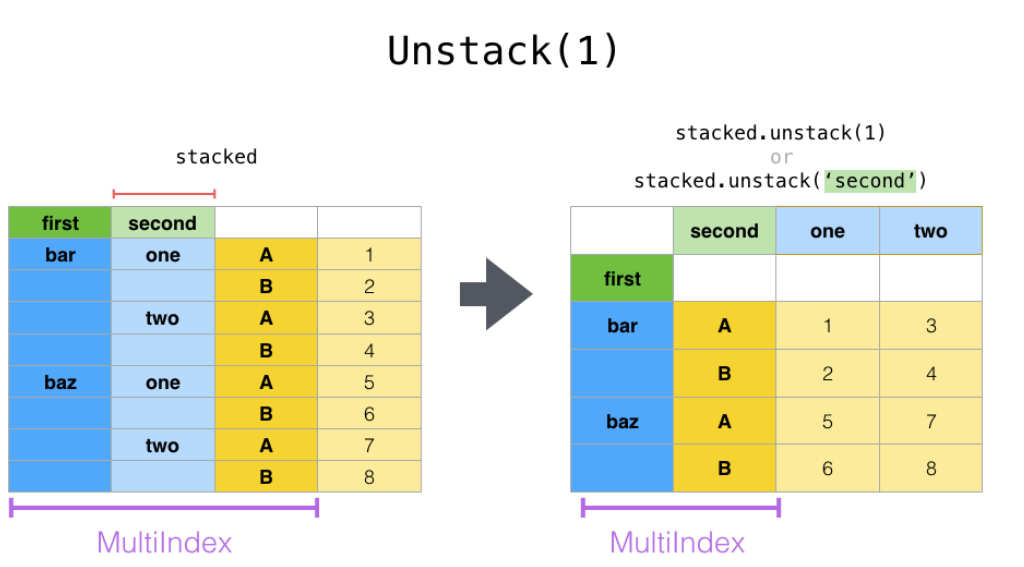
*****
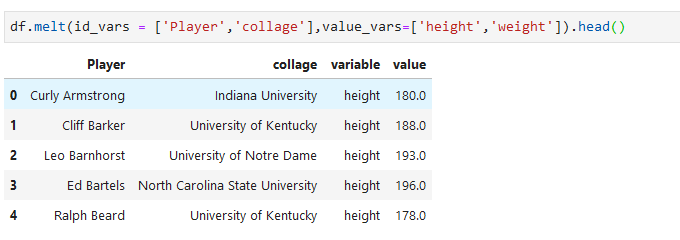
**Melt**
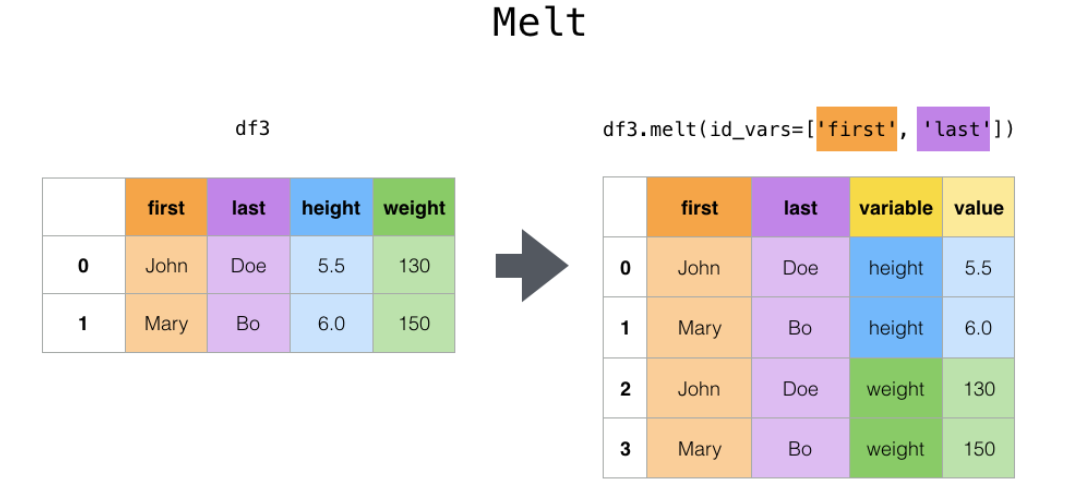
某些列設置為標記變量,其它的列被設置為衡量變量。函數會自動生成兩列:“variable” and “value”,我們也可以通過 var_name 和 value_name 兩個參數自定義列名。
```
pd.melt(frame, id_vars=None, value_vars=None, var_name=None, value_name='value', col_level=None)
```
*****
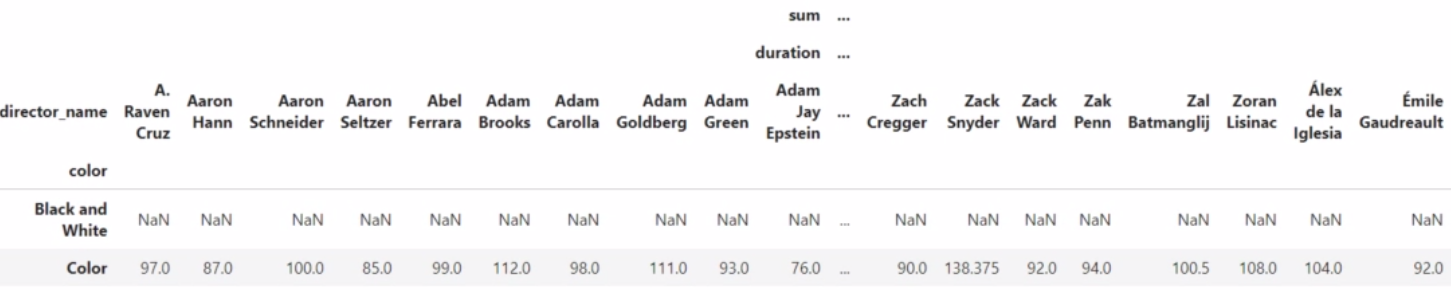
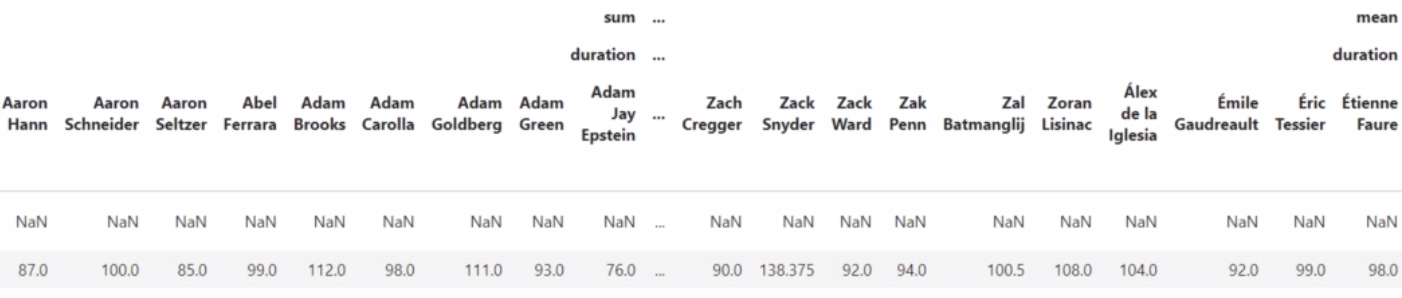
### 2.4.2. 透視表 pivot table
這部分看《利用Python進行數據分析》10.4節
```
import numpy as np
pd.pivot_table(df,values = ['duration'],columns = ['director_name'],index=['color'],aggfunc=[np.sum],margins=True)
```
**pivot_table** 提供了類似于EXCEL數據透視表的功能,重點的參數如下:
*****
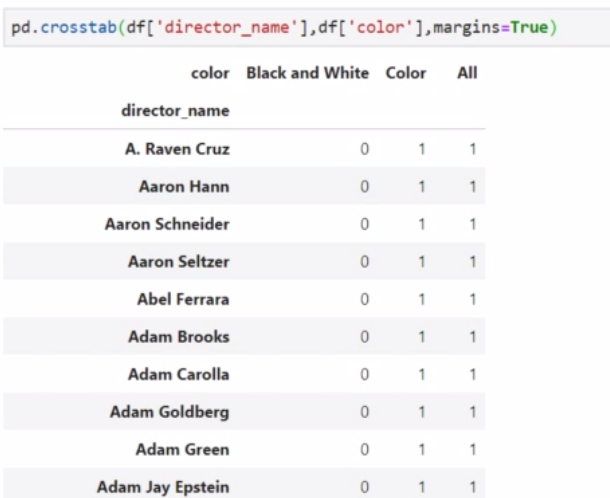
**crosstab**
用于計算兩個以上的因子的cross-tabulation. 默認的是計算因子之間的頻率
*****
- 第五節 Pandas數據管理
- 1.1 文件讀取
- 1.2 DataFrame 與 Series
- 1.3 常用操作
- 1.4 Missing value
- 1.5 文本數據
- 1.6 分類數據
- 第六節 pandas數據分析
- 2.1 索引選取
- 2.2. 分組計算
- 2.3. 表聯結
- 2.4. 數據透視與重塑(pivot table and reshape)
- 2.5 官方小結圖片
- 第七節 NUMPY科學計算
- 第八節 python可視化
- 第九節 統計學
- 01 單變量
- 02 雙變量
- 03 數值方法
- 第十節 概率
- 01 概率
- 02 離散概率分布
- 03 連續概率分布
- 第一節 抽樣與抽樣分布
- 01抽樣
- 02 點估計
- 03 抽樣分布
- 04 抽樣分布的性質
- 第十三節 區間估計
- 01總體均值的區間估計:??已知
- 02總體均值的區間估計:??未知
- 03總體容量的確定
- 04 總體比率