
[TOC]
# 簡介
Prometheus?最初是?SoundCloud?構建的開源系統監控和報警工具,是一個獨立的開源項目,于2016年加入了?CNCF?基金會,作為繼?Kubernetes?之后的第二個托管項目。Prometheus?相比于其他傳統監控工具主要有以下幾個特點:
* 具有由?metric?名稱和鍵/值對標識的時間序列數據的多維數據模型
* 有一個靈活的查詢語言
* 不依賴分布式存儲,只和本地磁盤有關
* 通過?HTTP?的服務拉取時間序列數據
* 也支持推送的方式來添加時間序列數據
* 還支持通過服務發現或靜態配置發現目標
* 多種圖形和儀表板支持
Prometheus?由多個組件組成,但是其中有些組件是可選的:
* `Prometheus?Server`:用于抓取指標、存儲時間序列數據
* `exporter`:暴露指標讓任務來抓
* `pushgateway`:push?的方式將指標數據推送到該網關
* `alertmanager`:處理報警的報警組件?`adhoc`:用于數據查詢
大多數?Prometheus?組件都是用?Go?編寫的,因此很容易構建和部署為靜態的二進制文件。下圖是?Prometheus?官方提供的架構及其一些相關的生態系統組件:

整體流程比較簡單,Prometheus?直接接收或者通過中間的?Pushgateway?網關被動獲取指標數據,在本地存儲所有的獲取的指標數據,并對這些數據進行一些規則整理,用來生成一些聚合數據或者報警信息,Grafana?或者其他工具用來可視化這些數據。
# 安裝Prometheus
## RABC權限
```yaml
cat <<'EOF' | kubectl apply -f -
# 創建集群權限
---
apiVersion: rbac.authorization.k8s.io/v1
kind: ClusterRole
metadata:
name: prometheus
rules:
-?apiGroups:
??-?""
??resources:
??-?nodes
??-?services
??-?endpoints
??-?pods
??-?nodes/proxy
- nodes/metrics
- configmaps
??verbs:
??-?get
??-?list
??-?watch
-?apiGroups:
??-?extensions
- networking.k8s.io
??resources:
??-?ingresses
- ingresses/status
??verbs:
??-?get
??-?list
??-?watch
-?nonResourceURLs:
??-?/metrics
??verbs:
??-?get
# 創建sa
---
apiVersion:?v1
kind:?ServiceAccount
metadata:
??name:?prometheus
??namespace:?kube-system
# sa與集群權限綁定
---
apiVersion: rbac.authorization.k8s.io/v1
kind: ClusterRoleBinding
metadata:
name: prometheus
roleRef:
apiGroup: rbac.authorization.k8s.io
kind: ClusterRole
name: prometheus
subjects:
- kind: ServiceAccount
name: prometheus
namespace: kube-system
EOF
```
## 配置文件
```yaml
cat <<'EOF' | kubectl apply -f -
# 主配置文件
---
apiVersion:?v1
kind:?ConfigMap
metadata:
??name:?prometheus
??namespace:?kube-system
data:
prometheus.yml: |
global:
scrape_interval: 15s
scrape_timeout: 15s
rule_files:
- /etc/prometheus/rule/*.rules
scrape_config_files:
- /etc/prometheus/target/*.targets
# target配置文件
---
apiVersion:?v1
kind:?ConfigMap
metadata:
??name:?prometheus-target
??namespace:?kube-system
data:
prometheus.targets: |
scrape_configs:
- job_name: 'prometheus'
# 抓取metrics路徑,Prometheus訪問路徑添加上下文需要添加上
metrics_path: /prometheus/metrics
static_configs:
- targets: ['localhost:9090']
# rule配置文件
---
apiVersion:?v1
kind:?ConfigMap
metadata:
??name:?prometheus-rule
??namespace:?kube-system
data:
EOF
```
## 創建Prometheus
```yaml
cat <<'EOF' | kubectl apply -f -
apiVersion:?apps/v1
kind:?Deployment
metadata:
??name:?prometheus
??namespace:?kube-system
??labels:
????app:?prometheus
spec:
??selector:
????matchLabels:
??????app:?prometheus
??template:
????metadata:
??????labels:
????????app:?prometheus
????spec:
# 初始化容器解決啟動時 lock DB directory 報錯
initContainers:
- name: prom-prefix
image: jiaxzeng/client:v1.1
command:
- "bash"
- "-c"
- "chown -R 65534. /prometheus && rm -f /prometheus/data/lock"
volumeMounts:
- mountPath:?"/prometheus/data"
name: data
??????containers:
??????-?image:?prom/prometheus:v2.45.4
????????name:?prometheus
????????args:
????????-?"--config.file=/etc/prometheus/prometheus.yml"
????????-?"--web.console.libraries=/usr/share/prometheus/console_libraries"
????????-?"--web.console.templates=/usr/share/prometheus/consoles"
# 監控數據保留時間
????????-?"--storage.tsdb.retention.time=24h"
#?控制對admin?HTTP?API的訪問,其中包括刪除時間序列等功能
????????-?"--web.enable-admin-api"
#?支持熱更新,直接執行localhost:9090/-/reload立即生效
????????-?"--web.enable-lifecycle"
# 添加上下文,健康檢查也需要修改;默認 /
# 【注意】這個參數影響 健康檢查 以及 配置文件抓取Prometheus數據路徑
- "--web.external-url=/prometheus"
????????ports:
????????-?containerPort:?9090
??????????name:?http
startupProbe:
httpGet:
path: /prometheus/-/healthy
port: 9090
initialDelaySeconds: 10
periodSeconds: 5
successThreshold: 1
failureThreshold: 24
livenessProbe:
httpGet:
path: /prometheus/-/healthy
port: 9090
periodSeconds: 5
failureThreshold: 3
successThreshold: 1
readinessProbe:
httpGet:
path: /prometheus/-/ready
port: 9090
periodSeconds: 5
failureThreshold: 3
successThreshold: 1
????????volumeMounts:
????????-?mountPath:?"/prometheus/data"
??????????name:?data
????????-?mountPath:?"/etc/prometheus"
??????????name:?config
????????-?mountPath:?"/etc/prometheus/target"
??????????name: target
????????-?mountPath:?"/etc/prometheus/rule"
??????????name:?rule
????????resources:
??????????requests:
????????????cpu:?100m
????????????memory:?512Mi
??????????limits:
????????????cpu:?2
????????????memory:?2048Mi
#?訪問集群資源需要用到的用戶
??????serviceAccountName:?prometheus
??????nodeSelector:
????????kubernetes.io/node: monitor
??????volumes:
??????-?name:?data
????????hostPath:
??????????path:?/data/prometheus/
??????-?configMap:
??????????name:?prometheus
????????name:?config
??????-?configMap:
??????????name:?prometheus-target
????????name:?target
??????-?configMap:
??????????name:?prometheus-rule
????????name:?rule
EOF
```
另外為了?prometheus?的性能和數據持久化我們這里是直接將通過?hostPath?的方式來進行數據持久化的,通過?`--storage.tsdb.path=/data`?指定數據目錄,然后將該目錄聲明掛載到?`/data/prometheus`?這個主機目錄下面,為了防止?Pod?漂移,所以我們使用?`nodeSelector`?將?Pod?固定到了一個具有?`kubernetes.io/node=monitor`?標簽的節點上,如果沒有這個標簽則需要為你的目標節點打上這個標簽
```shell
$?kubectl label node <k8s_name> kubernetes.io/node=monitor
```
## 創建service
```yaml
cat <<'EOF' | kubectl apply -f -
apiVersion:?v1
kind:?Service
metadata:
??name:?prometheus
??namespace:?kube-system
??labels:
????app:?prometheus
spec:
??type: ClusterIP
??selector:
????app:?prometheus
??ports:
??-?name:?web
????port:?9090
????targetPort:?http
EOF
```
## 設置ingress
```shell
cat <<EOF | sudo tee ingress.yml > /dev/null
apiVersion: extensions/v1beta1
kind: Ingress
metadata:
name: prometheus
namespace: kube-system
spec:
ingressClassName: nginx
rules:
- host: www.ecloud.com
http:
paths:
- path: /prometheus
backend:
serviceName: prometheus
servicePort: 9090
EOF
```
# 驗證
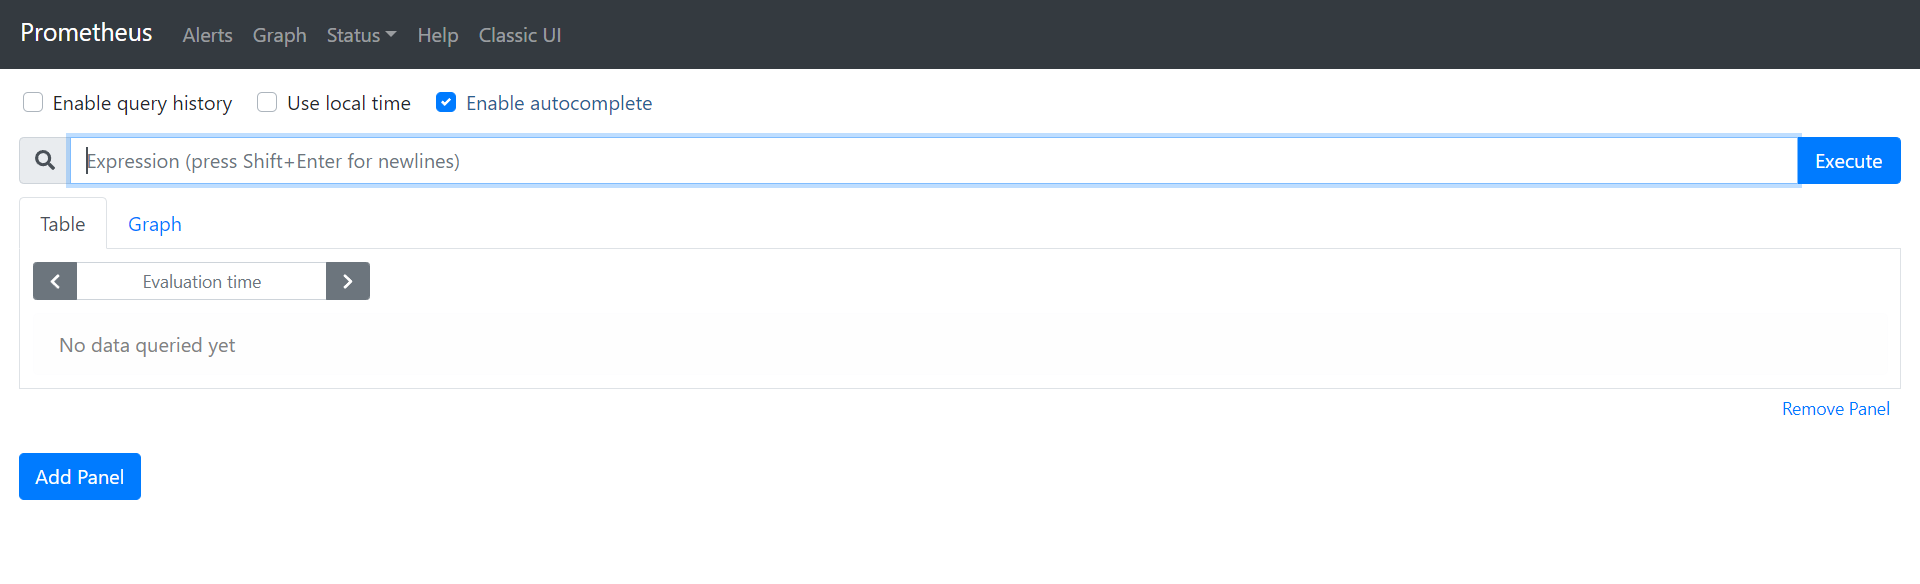
> 如果出現有告警提示時間不同步的,例如 Warning: Error fetching server time: Detected 32.164000034332275 seconds time difference between your browser and the server. Prometheus relies on accurate time and time drift might cause unexpected query results.
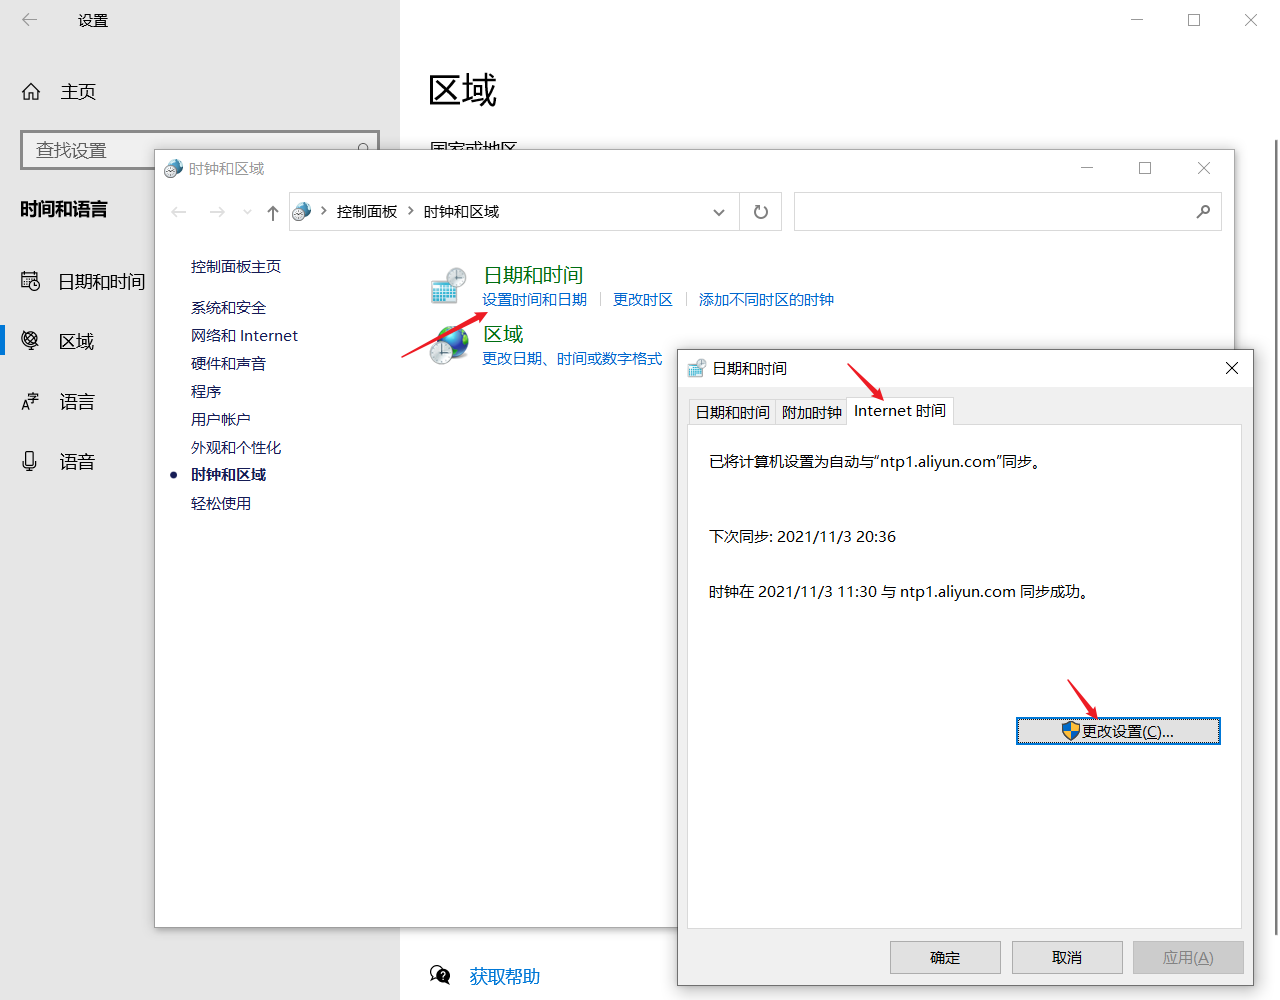
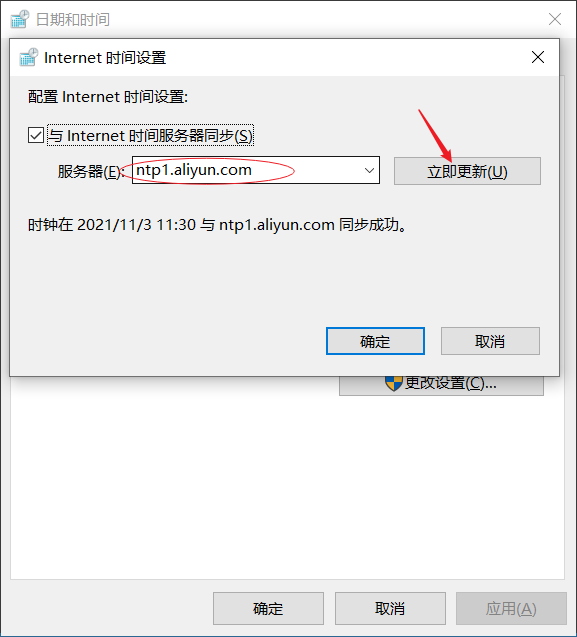
解決方法:
通常是服務器的時間與客戶端的時間不同步導致的一個問題。服務器是同步阿里云的,所以修改客戶端也是同步阿里云即可。

- 前言
- 架構
- 部署
- kubeadm部署
- kubeadm擴容節點
- 二進制安裝基礎組件
- 添加master節點
- 添加工作節點
- 選裝插件安裝
- Kubernetes使用
- k8s與dockerfile啟動參數
- hostPort與hostNetwork異同
- 應用上下線最佳實踐
- 進入容器命名空間
- 主機與pod之間拷貝
- events排序問題
- k8s會話保持
- 容器root特權
- CNI插件
- calico
- calicoctl安裝
- calico網絡通信
- calico更改pod地址范圍
- 新增節點網卡名不一致
- 修改calico模式
- calico數據存儲遷移
- 啟用 kubectl 來管理 Calico
- calico卸載
- cilium
- cilium架構
- cilium/hubble安裝
- cilium網絡路由
- IP地址管理(IPAM)
- Cilium替換KubeProxy
- NodePort運行DSR模式
- IP地址偽裝
- ingress使用
- nginx-ingress
- ingress安裝
- ingress高可用
- helm方式安裝
- 基本使用
- Rewrite配置
- tls安全路由
- ingress發布管理
- 代理k8s集群外的web應用
- ingress自定義日志
- ingress記錄真實IP地址
- 自定義參數
- traefik-ingress
- traefik名詞概念
- traefik安裝
- traefik初次使用
- traefik路由(IngressRoute)
- traefik中間件(middlewares)
- traefik記錄真實IP地址
- cert-manager
- 安裝教程
- 頒布者CA
- 創建證書
- 外部存儲
- 對接NFS
- 對接ceph-rbd
- 對接cephfs
- 監控平臺
- Prometheus
- Prometheus安裝
- grafana安裝
- Prometheus配置文件
- node_exporter安裝
- kube-state-metrics安裝
- Prometheus黑盒監控
- Prometheus告警
- grafana儀表盤設置
- 常用監控配置文件
- thanos
- Prometheus
- Sidecar組件
- Store Gateway組件
- Querier組件
- Compactor組件
- Prometheus監控項
- grafana
- Querier對接grafana
- alertmanager
- Prometheus對接alertmanager
- 日志中心
- filebeat安裝
- kafka安裝
- logstash安裝
- elasticsearch安裝
- elasticsearch索引生命周期管理
- kibana安裝
- event事件收集
- 資源預留
- 節點資源預留
- imagefs與nodefs驗證
- 資源預留 vs 驅逐 vs OOM
- scheduler調度原理
- Helm
- Helm安裝
- Helm基本使用
- 安全
- apiserver審計日志
- RBAC鑒權
- namespace資源限制
- 加密Secret數據
- 服務網格
- 備份恢復
- Velero安裝
- 備份與恢復
- 常用維護操作
- container runtime
- 拉取私有倉庫鏡像配置
- 拉取公網鏡像加速配置
- runtime網絡代理
- overlay2目錄占用過大
- 更改Docker的數據目錄
- Harbor
- 重置Harbor密碼
- 問題處理
- 關閉或開啟Harbor的認證
- 固定harbor的IP地址范圍
- ETCD
- ETCD擴縮容
- ETCD常用命令
- ETCD數據空間壓縮清理
- ingress
- ingress-nginx header配置
- kubernetes
- 驗證yaml合法性
- 切換KubeProxy模式
- 容器解析域名
- 刪除節點
- 修改鏡像倉庫
- 修改node名稱
- 升級k8s集群
- 切換容器運行時
- apiserver接口
- 其他
- 升級內核
- k8s組件性能分析
- ETCD
- calico
- calico健康檢查失敗
- Harbor
- harbor同步失敗
- Kubernetes
- 資源Terminating狀態
- 啟動容器報錯