
[TOC]
安裝好grafana并不能直接看到監控數據,需要自行設置dashboard或plugins。
展示 `kubernetes`、`ingress-nginx-controller` 和 `etcd` 三個組件的漂亮的儀表盤。
## kubernetes
這個使用的是現成的插件(devopsprodigy-kubegraf-app),不需要寫dashboard文件內容。只需要導入證書和填寫服務器信息即可。
> 要求:
> 1. Grafana > 5.0.0
> 2. Prometheus + node-exporter + kube-state-metrics (version >= 1.4.0)
> 3. Grafana-piechart-panel
1. 安裝插件
- **在線安裝**
登錄容器,下載插件
grafana-cli plugins install devopsprodigy-kubegraf-app
- **離線安裝**
在grafana的主機,找到數據目錄($PATH/plugins)
kubectl -n kube-mon cp grafana-piechart-panel/ grafana-6dcb54fd8d-2zw9f:/var/lib/grafana/plugins/
kubectl -n kube-mon cp devopsprodigy-kubegraf-app grafana-6dcb54fd8d-2zw9f:/var/lib/grafana/plugins/
> 上面兩種方法安裝,都是需要重啟grafana容器的。
> kubectl -n kube-mon delete pod -l app=grafana
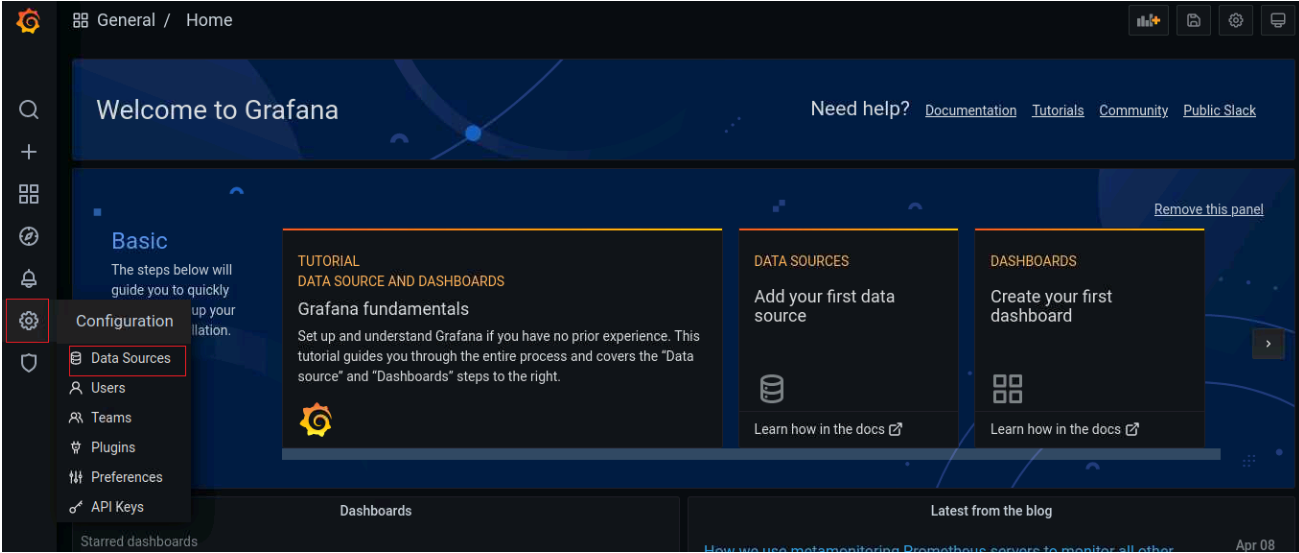
2. 配置插件
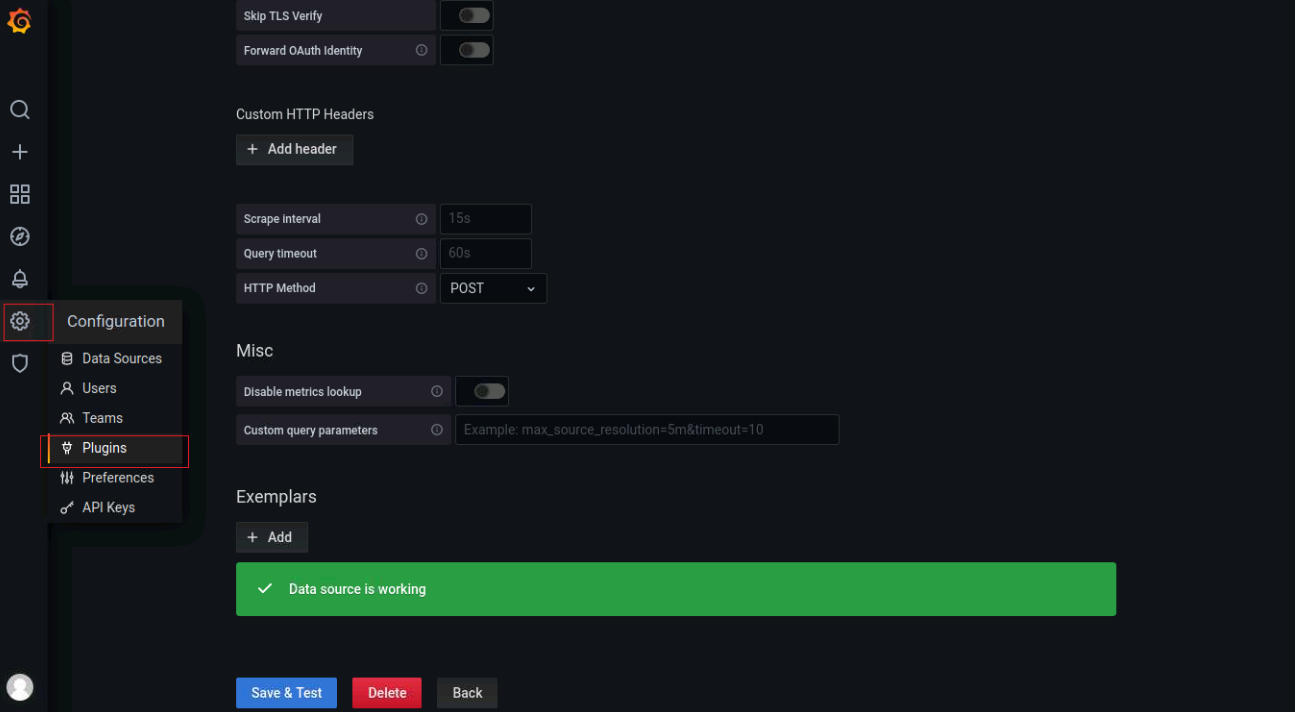
Ⅰ 配置數據源

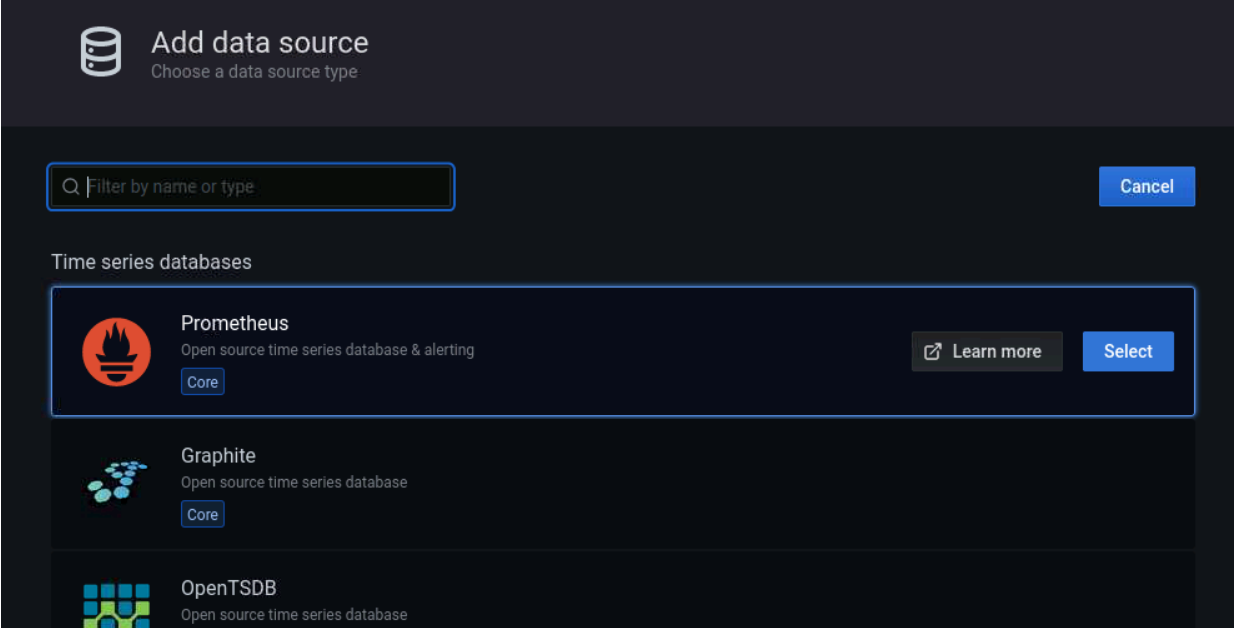

> 注意:如果promtheus有添加上下文的話,URL也需要添加上對應的上下文。
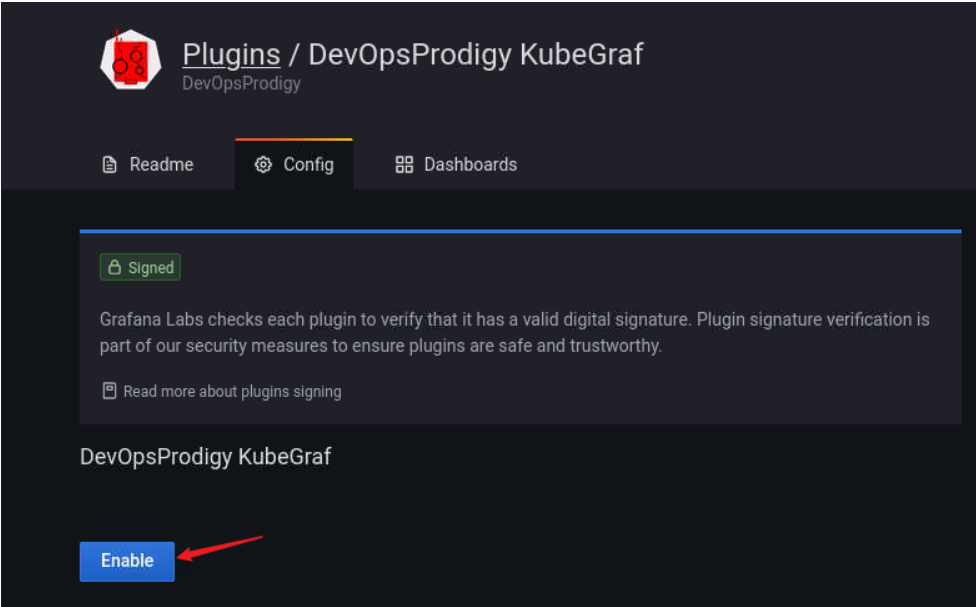
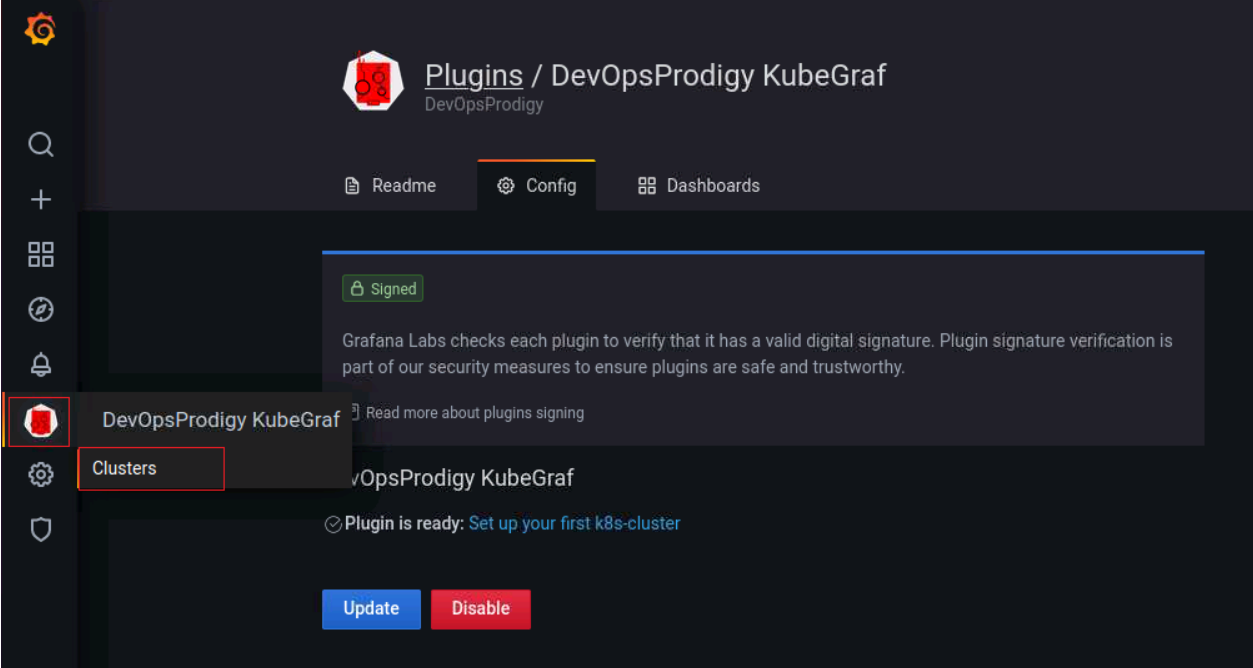
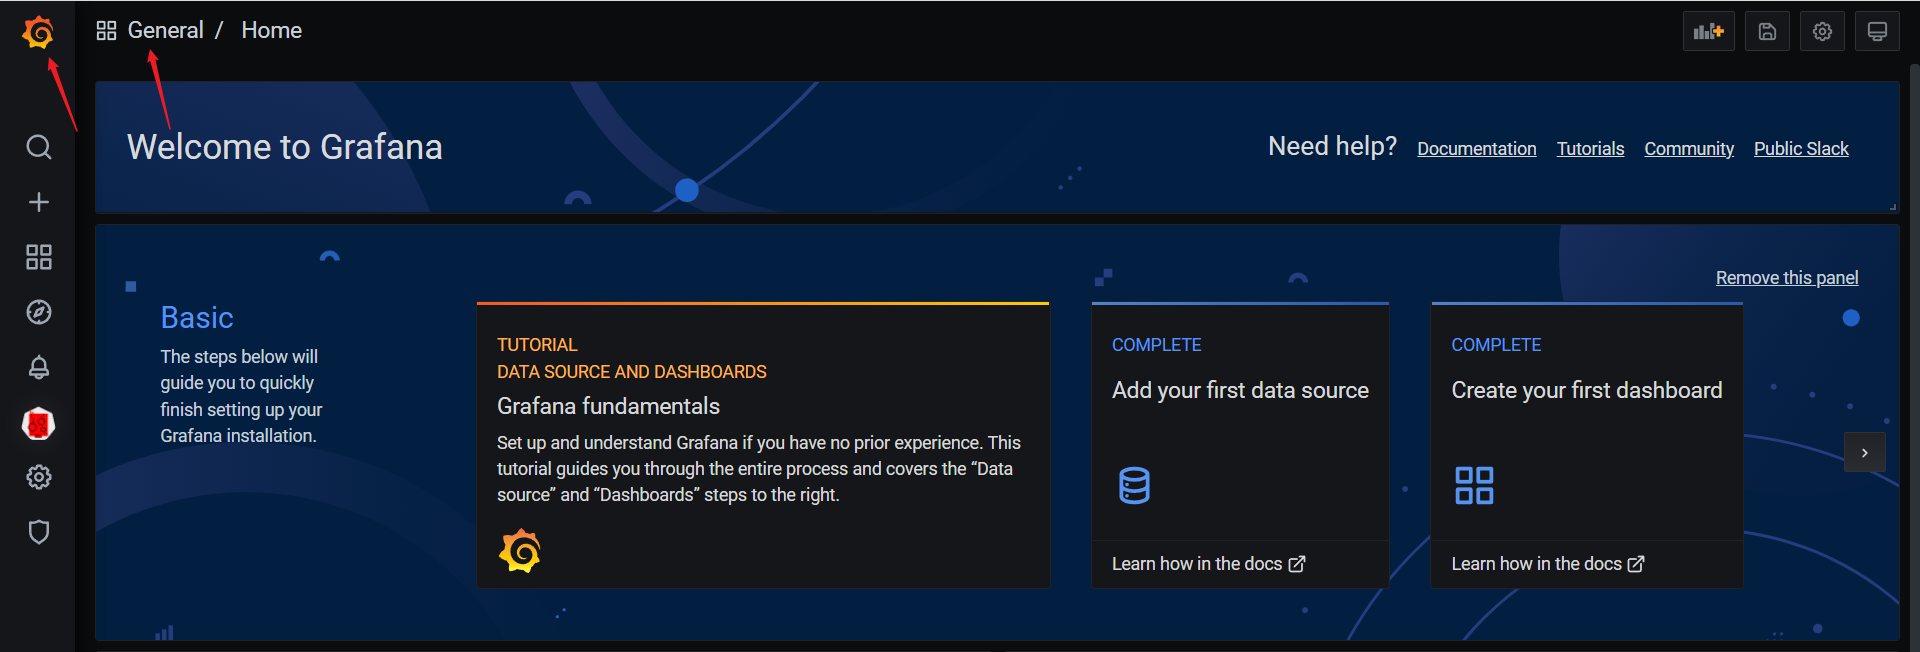
Ⅱ 啟動插件
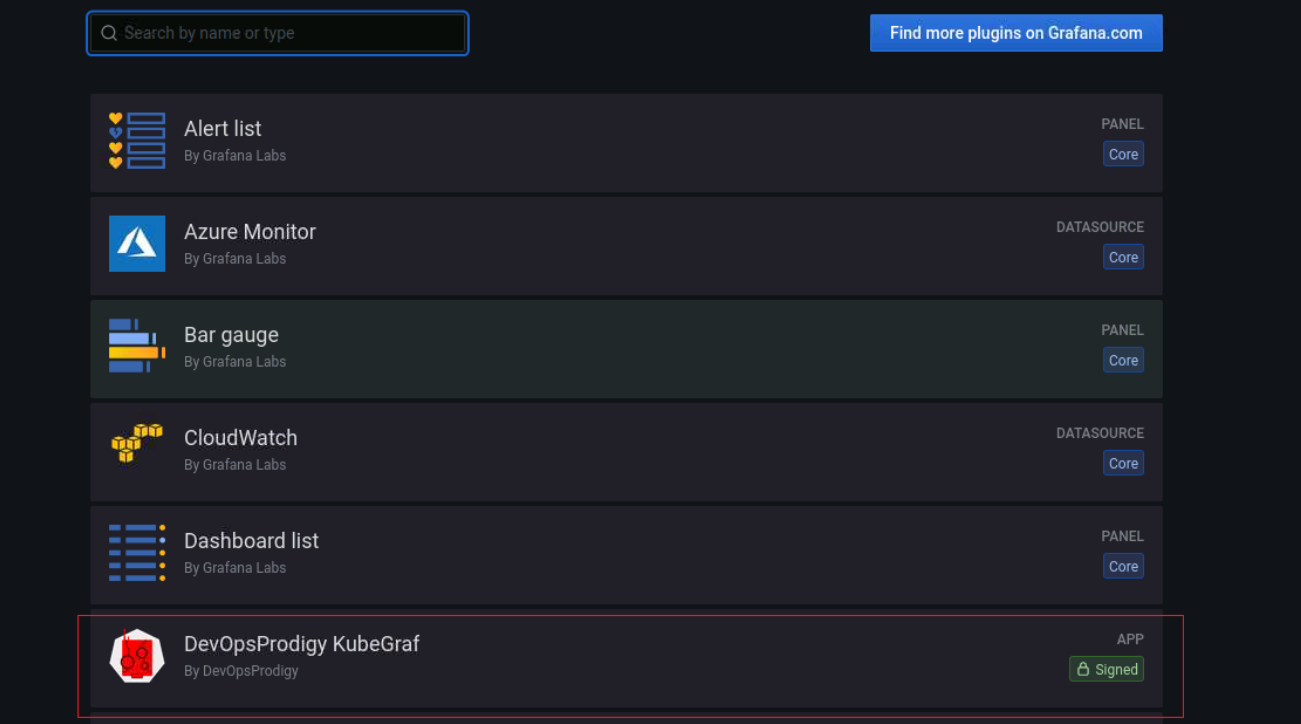
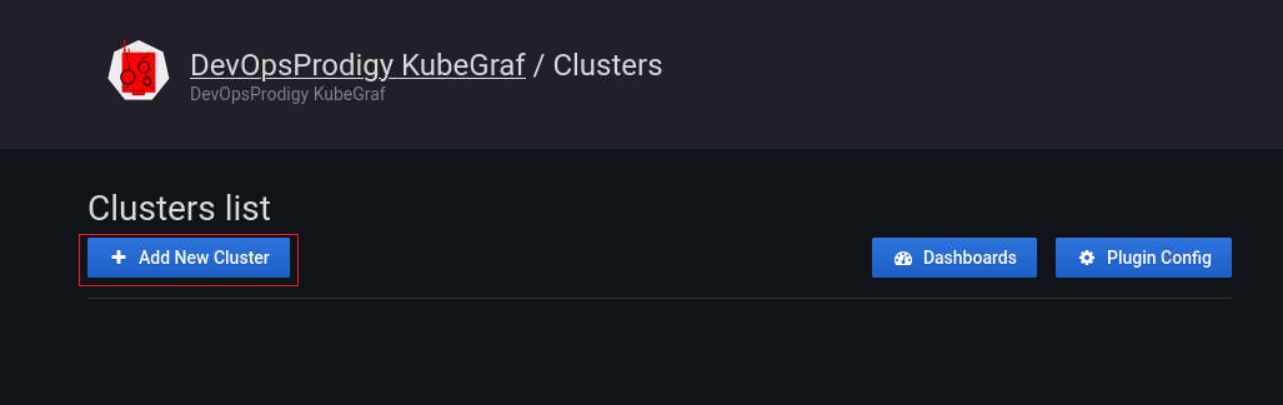
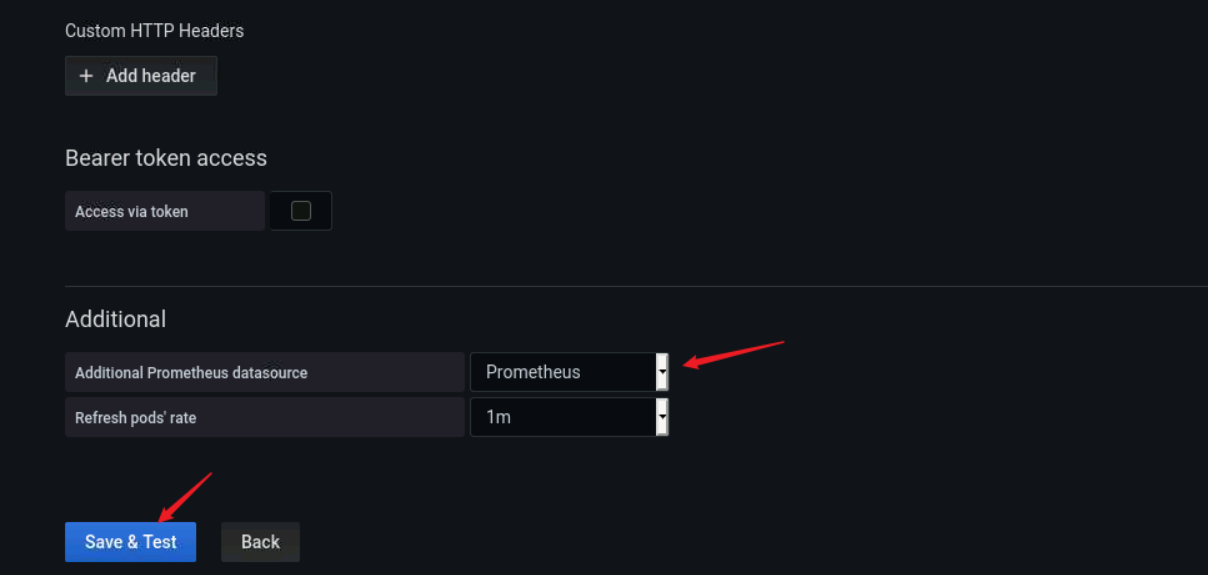
Ⅲ 配置插件
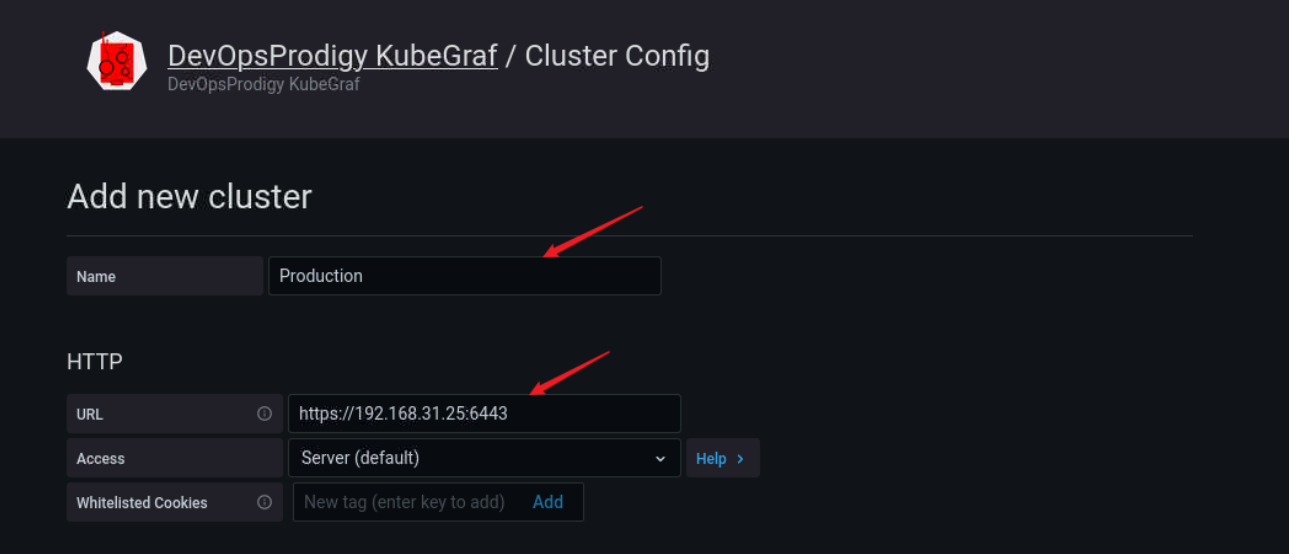
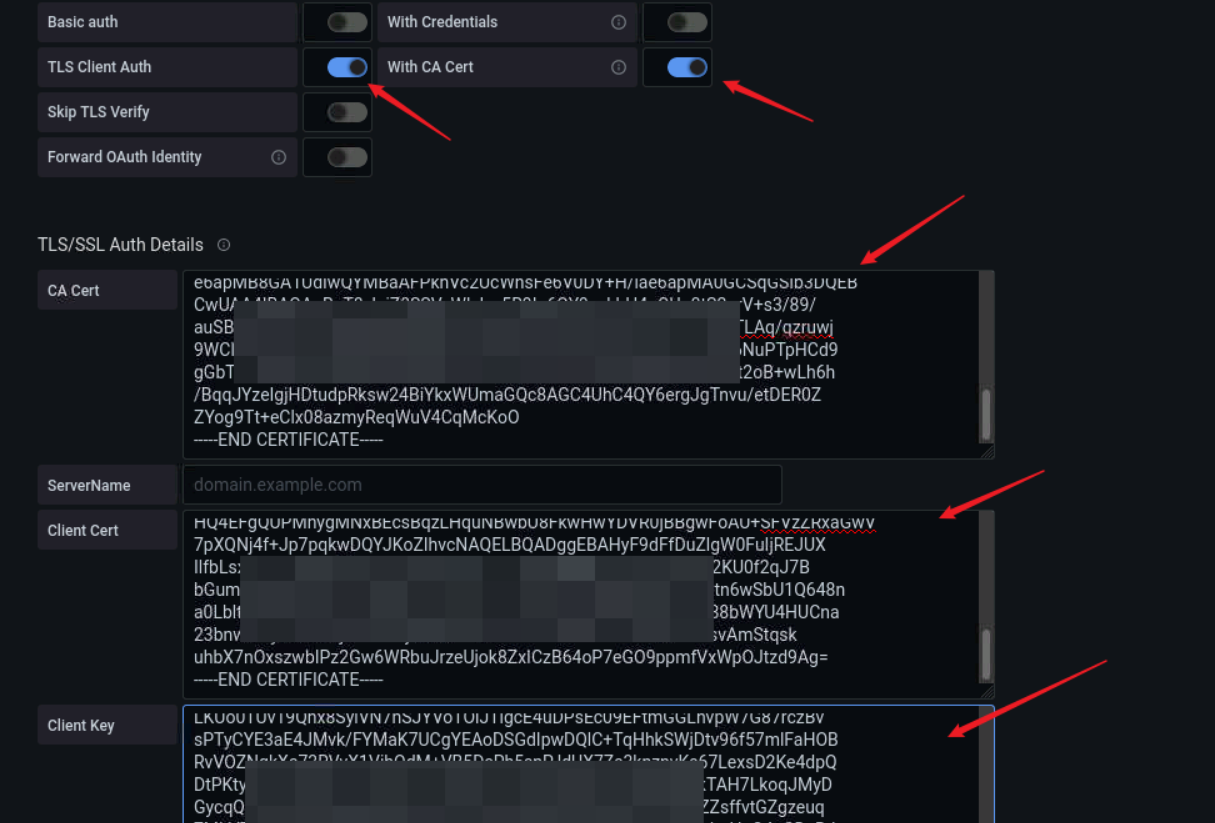
> 獲取上面的數據的方法:
> #URL框
> cat /root/.kube/config | grep server | awk '{print $2}'
> #CA Cert框
> cat /root/.kube/config | grep certificate-authority-data | awk '{print $2}' | base64 -d
> #Client Cert框
> cat /root/.kube/config | grep client-certificate-data | awk '{print $2}' | base64 -d
> #Client Key框
> cat /root/.kube/config | grep client-key-data | awk '{print $2}' | base64 -d
保存完后,會跳轉到配置插件頁面。如果沒有出現配置好的集群信息的話,重新刷新一下即可。
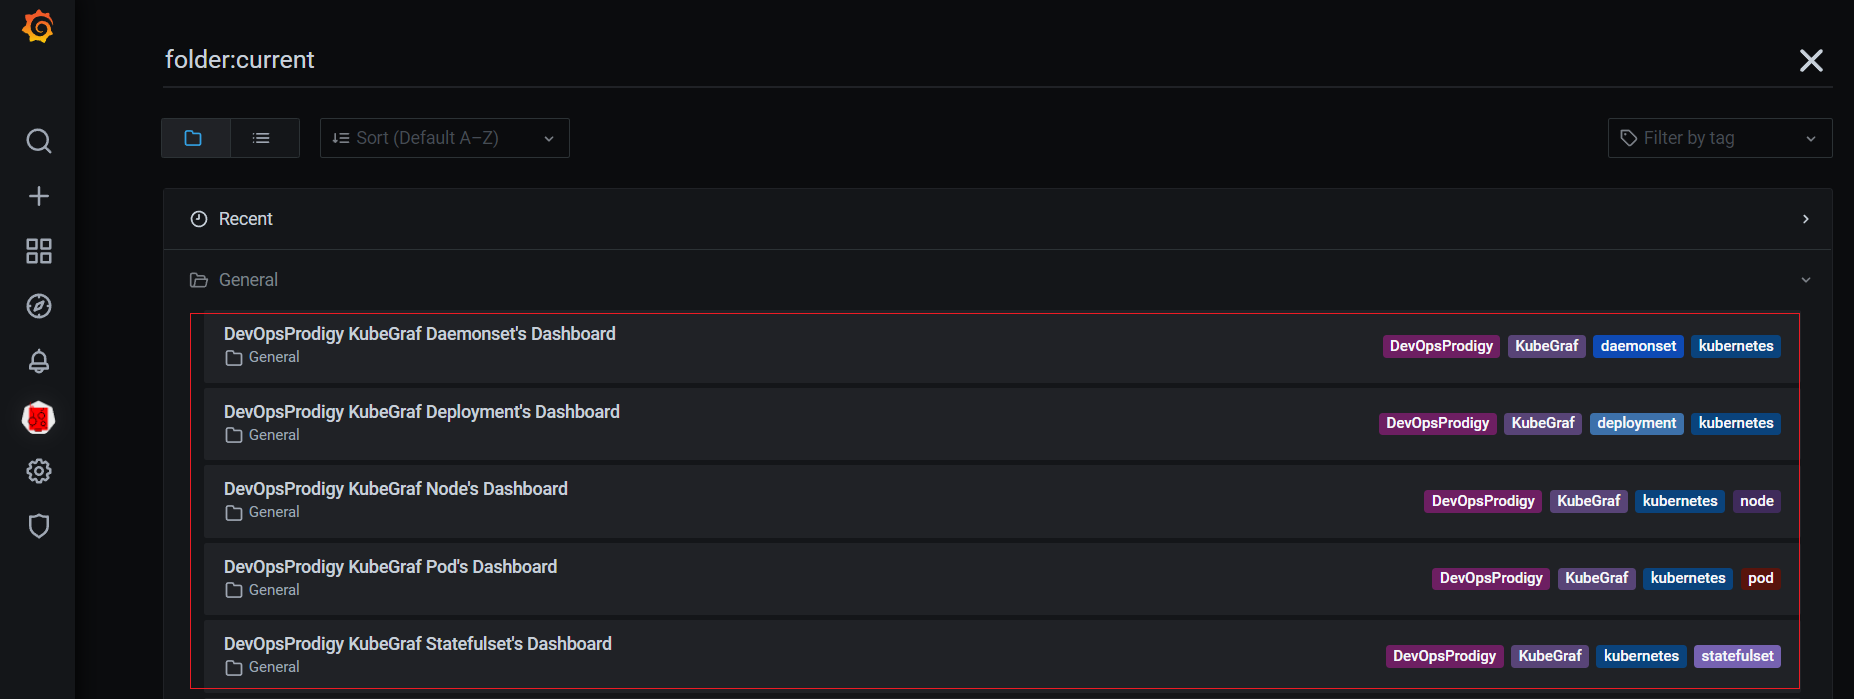
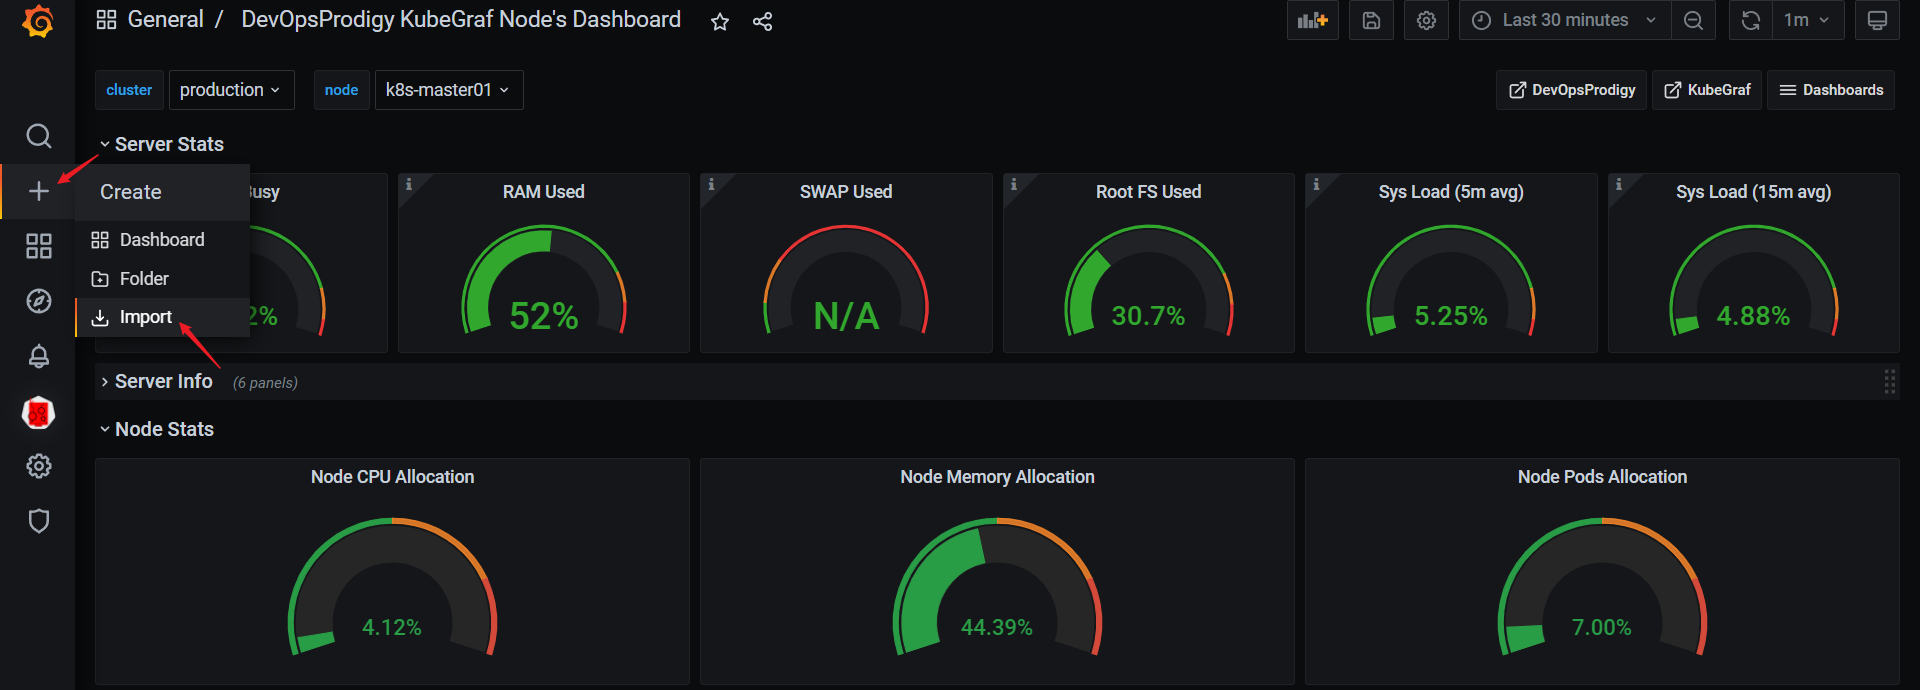
Ⅳ 查看儀表盤

## ingress-nginx-controller
1. 下載官方提供的dashboard文件
下載地址:https://raw.githubusercontent.com/kubernetes/ingress-nginx/main/deploy/grafana/dashboards/nginx.json
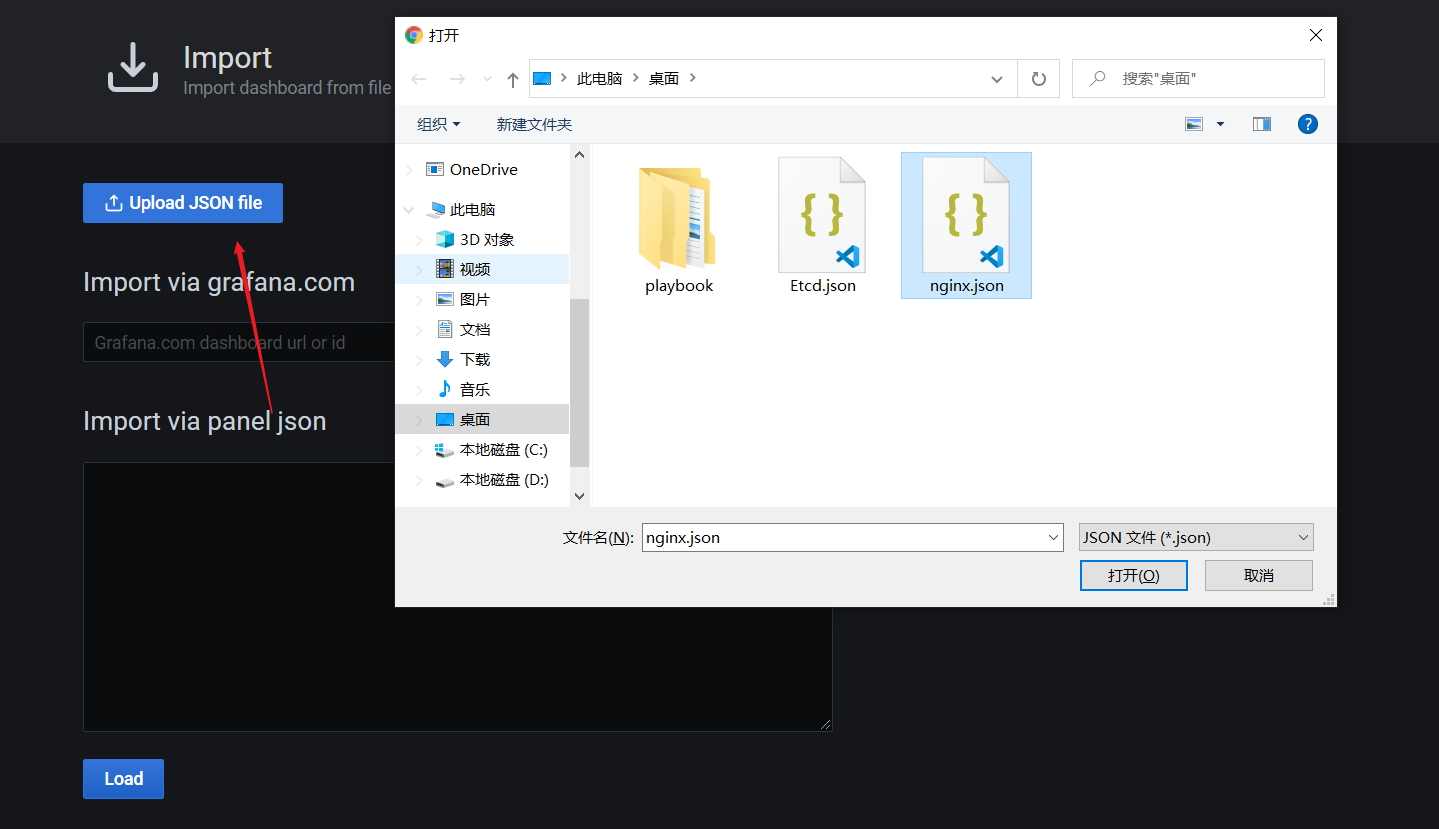
2. 導入dashboard文件

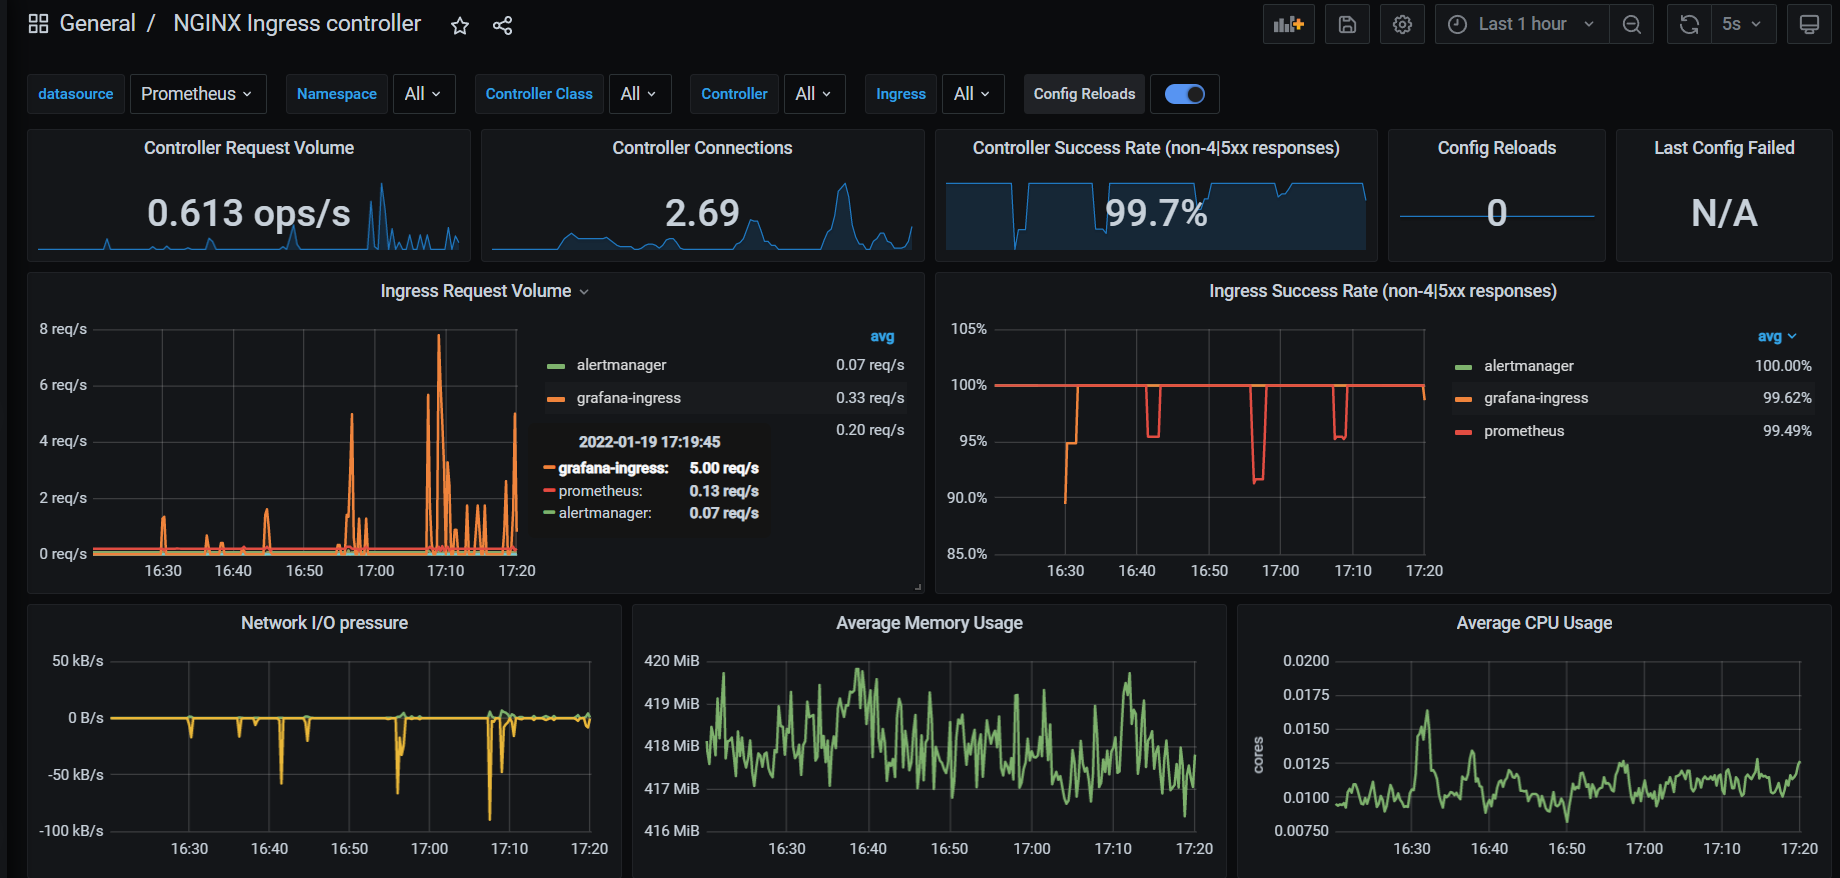
3. 驗證
## etcd
etcd官網也提供有dashboard文件,不過文件好像有些問題。不能夠直接導入,這里提供一個修改好的文件。請查看附件的章節。
導入方法與 ingress-nginx-controller 的方法一致,這里就不贅述。
## minio
參考文章:https://docs.min.io/docs/how-to-monitor-minio-using-prometheus.html
1. 將新主機添加到配置文件
```shell
$ mc config host add monitor http://192.168.31.199:9000 admin ak+JLouROYaP
Added `monitor` successfully.
```
2. 查看是否添加成功
```shell
$ mc config host list monitor
monitor
URL : http://192.168.31.199:9000
AccessKey : admin
SecretKey : ak+JLouROYaP
API : s3v4
Path : auto
```
3. 該命令將生成 prometheus.yml 的 scrape_configs 部分
```shell
$ mc admin prometheus generate monitor
scrape_configs:
- job_name: minio-job
bearer_token: eyJhbGciOiJIUzUxMiIsInR5cCI6IkpXVCJ9.eyJleHAiOjQ4MDkwNDgyNDksImlzcyI6InByb21ldGhldXMiLCJzdWIiOiJhZG1pbiJ9.oX7aSpbySO8LtHm3PwPQAB1EnHCTfwNY3_LH7B1-YYArCOlbd_4SUY0l2SMIW7_SjpAr_5x3qqEhHNvwOBThuQ
metrics_path: /minio/v2/metrics/cluster
scheme: http
static_configs:
- targets: ['192.168.31.199:9000']
```
> 注意:如果是https協議的話,需要添加取消證書驗證。
4. Prometheus配置添加上面信息

> 重啟加載Prometheus配置文件 `curl -X POST "http://`kubectl -n kube-mon get endpoints prometheus -o jsonpath={.subsets[0].addresses[0].ip}`:9090/prometheus/-/reload"`
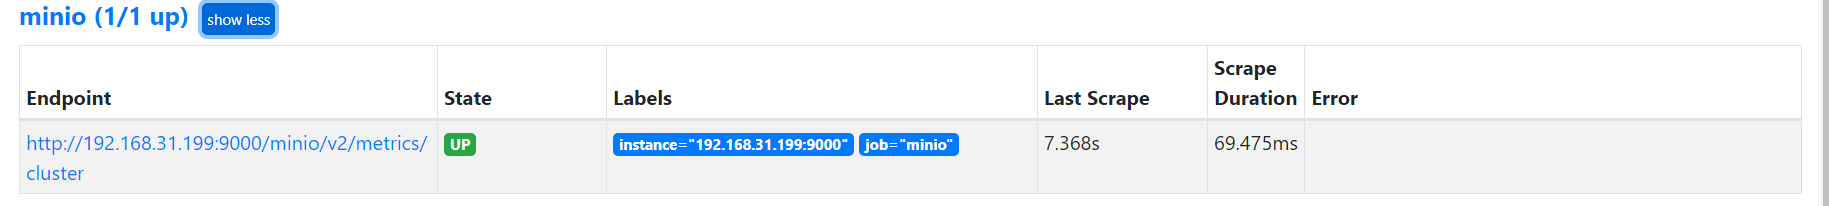
5. 驗證
6. 添加dashboard

> 上圖就是有兩個相同的數據字,提供的json文件有些瑕疵。這里提供一個修改好的文件。請查看附件的章節。
## ceph
參考文章:https://docs.ceph.com/en/nautilus/mgr/prometheus/
1. 開通ceph mgr模塊的Prometheus
```shell
$ ceph mgr module enable prometheus
```
> 注意:報錯提示 `Error ENOENT: module 'prometheus' reports that it cannot run on the active manager daemon: No module named 'cherrypy' (pass --force to force enablement)`。需要安裝一下cherrypy模塊 `sudo pip3 install cherrypy` 安裝即可
2. 驗證是否開啟成功
```shell
$ ceph mgr module ls | grep -A5 enabled_modules
"enabled_modules": [
"iostat",
"prometheus",
"restful"
],
```
3. 設置Prometheus暴露地址和端口
```shell
$ ceph config set mgr mgr/prometheus/server_addr 0.0.0.0
$ ceph config set mgr mgr/prometheus/server_port 9283
```
4. 驗證設置
```shell
## ceph config get mgr.主機名
$ ceph config get mgr.ceph02
WHO MASK LEVEL OPTION VALUE RO
mgr advanced mgr/prometheus/server_addr 0.0.0.0 *
mgr advanced mgr/prometheus/server_port 9283 *
$ ceph mgr services
{
"prometheus": "http://ceph01.ecloud.com:9283/"
}
```
5. Prometheus配置段
```yaml
- job_name: "Ceph"
static_configs:
- targets:
# 所有mgr主機
- 192.168.31.132:9283
- 192.168.31.69:9283
- 192.168.31.177:9283
labels:
cluster: production
```
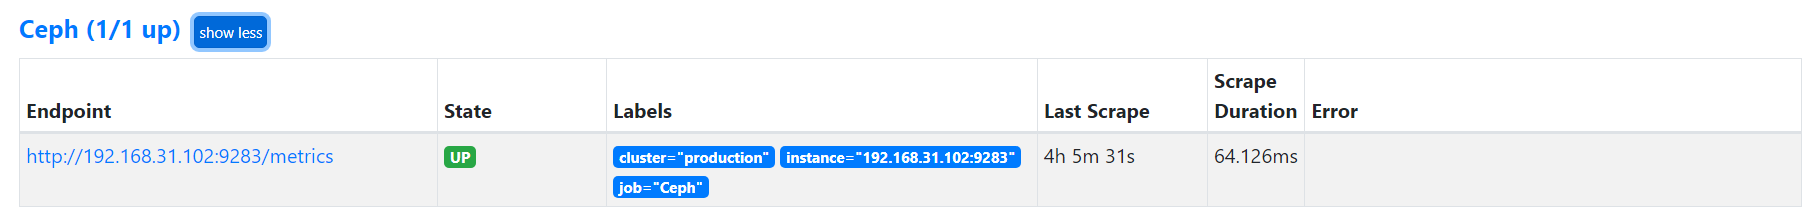
6. 驗證Prometheus的target
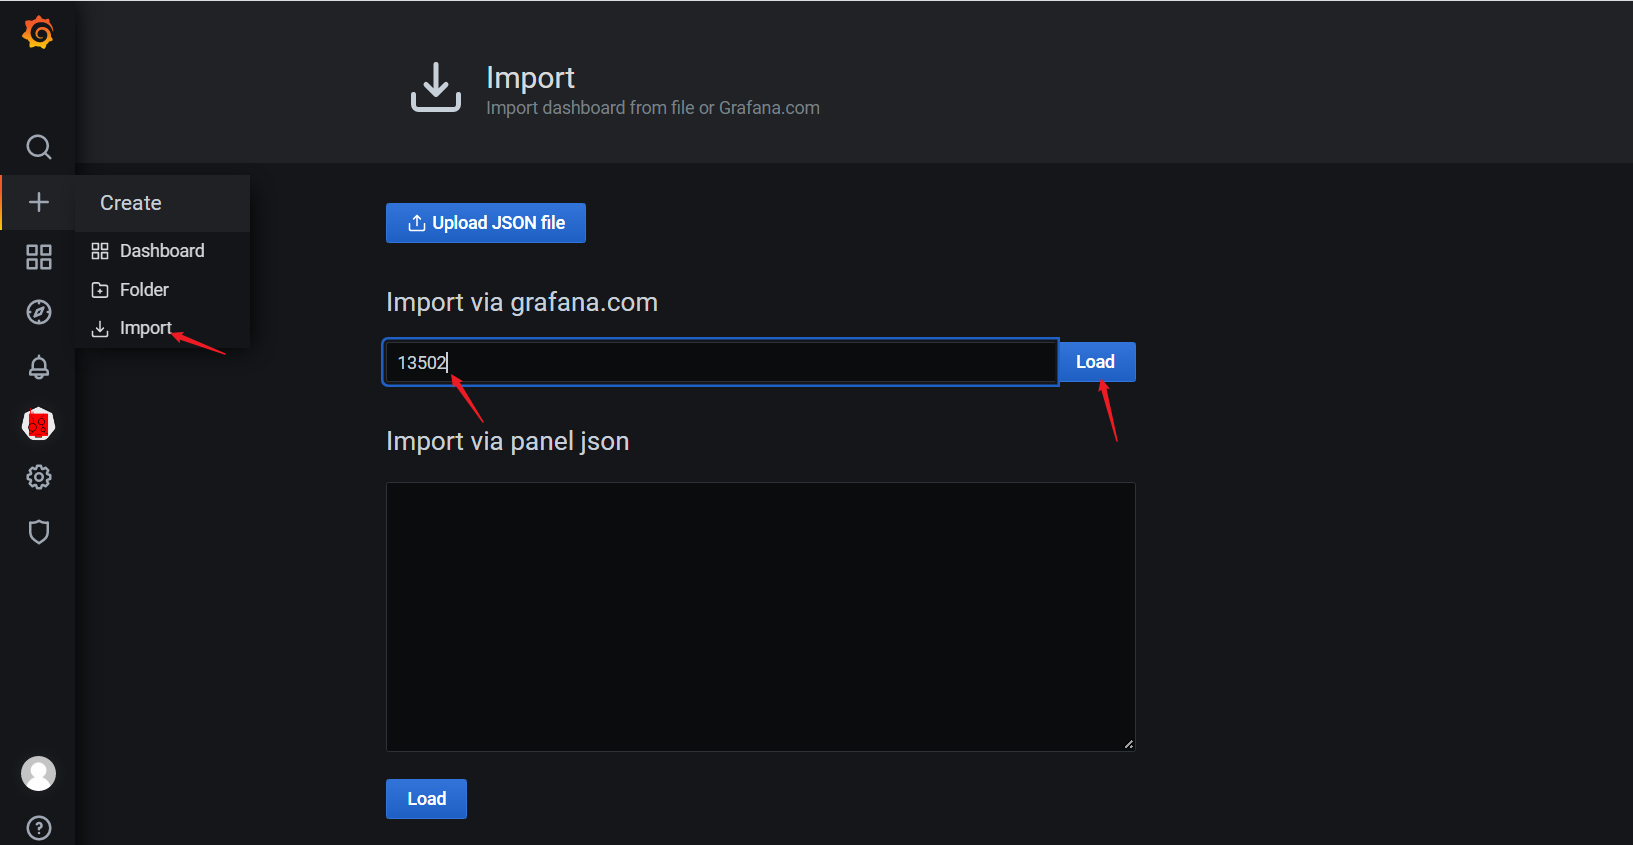
7. grafana安裝dashboard
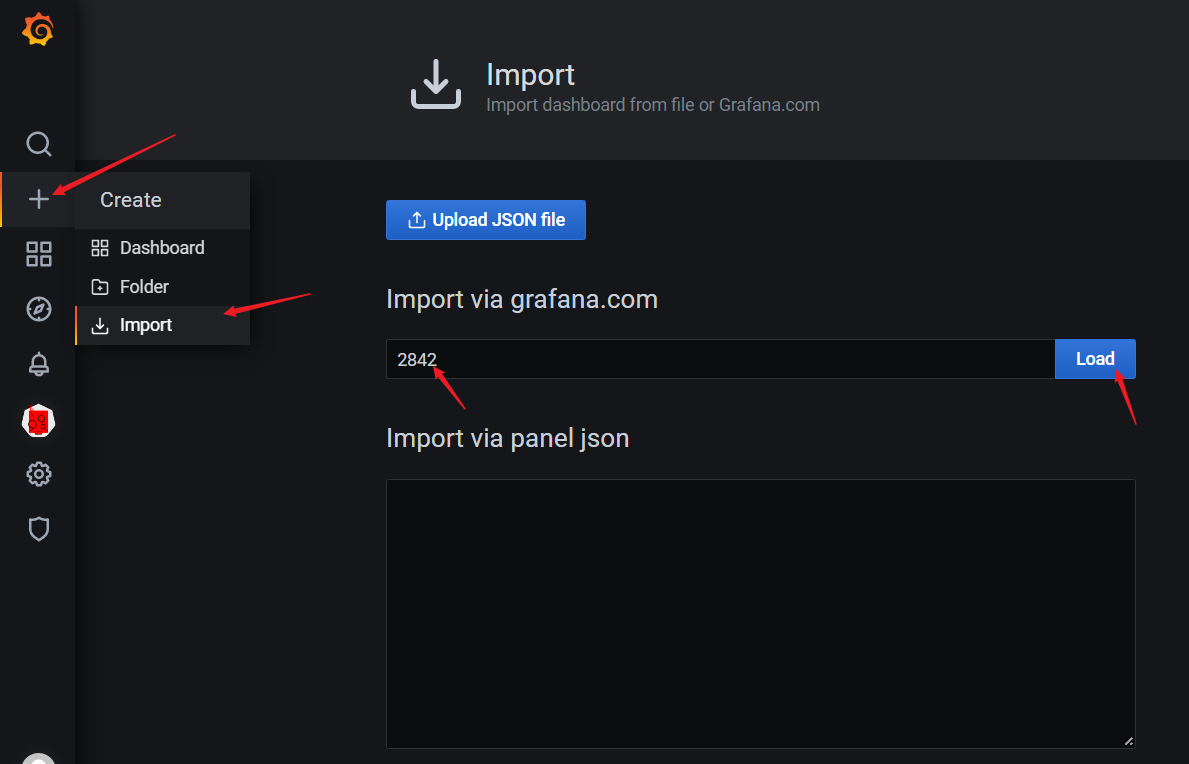
> 使用 `2842` 的dashboard頁面
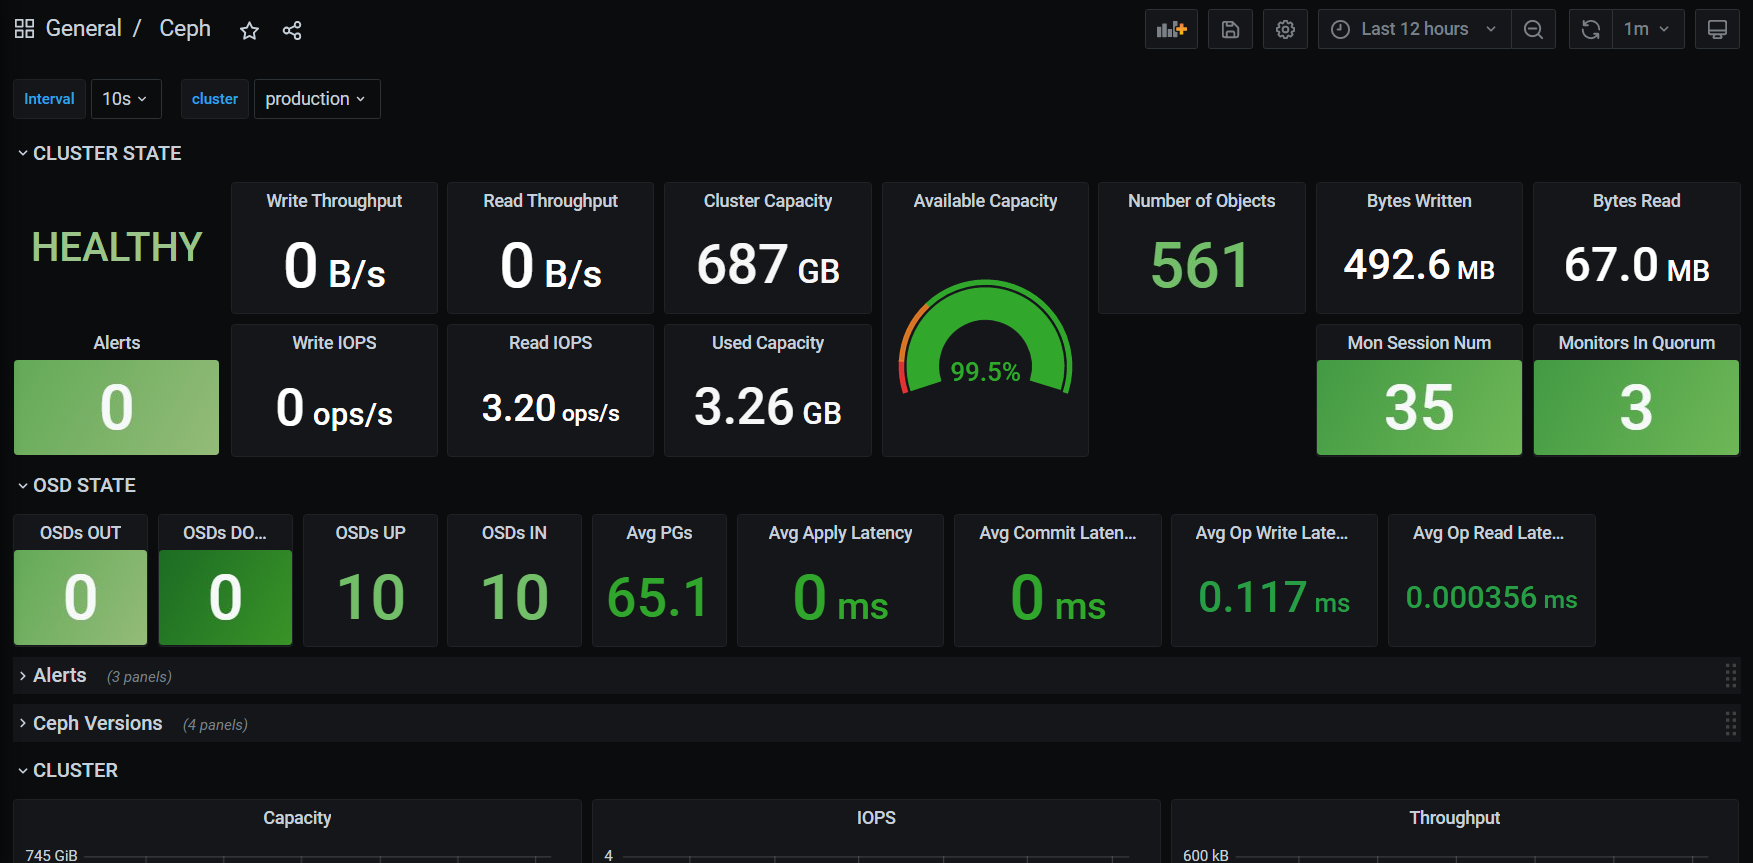
8. 驗證dashboard
## 參考文檔
https://grafana.com/grafana/plugins/devopsprodigy-kubegraf-app/
https://kubernetes.github.io/ingress-nginx/user-guide/monitoring/#grafana
https://etcd.io/docs/v3.4/op-guide/monitoring/#grafana
## 附件文件
所需的dashboard和plugins文件都放在百度網盤上
> 鏈接:https://pan.baidu.com/s/1bxnNl05F97Il7pZ0sgdRuQ
> 提取碼:05eh
- 前言
- 架構
- 部署
- kubeadm部署
- kubeadm擴容節點
- 二進制安裝基礎組件
- 添加master節點
- 添加工作節點
- 選裝插件安裝
- Kubernetes使用
- k8s與dockerfile啟動參數
- hostPort與hostNetwork異同
- 應用上下線最佳實踐
- 進入容器命名空間
- 主機與pod之間拷貝
- events排序問題
- k8s會話保持
- 容器root特權
- CNI插件
- calico
- calicoctl安裝
- calico網絡通信
- calico更改pod地址范圍
- 新增節點網卡名不一致
- 修改calico模式
- calico數據存儲遷移
- 啟用 kubectl 來管理 Calico
- calico卸載
- cilium
- cilium架構
- cilium/hubble安裝
- cilium網絡路由
- IP地址管理(IPAM)
- Cilium替換KubeProxy
- NodePort運行DSR模式
- IP地址偽裝
- ingress使用
- nginx-ingress
- ingress安裝
- ingress高可用
- helm方式安裝
- 基本使用
- Rewrite配置
- tls安全路由
- ingress發布管理
- 代理k8s集群外的web應用
- ingress自定義日志
- ingress記錄真實IP地址
- 自定義參數
- traefik-ingress
- traefik名詞概念
- traefik安裝
- traefik初次使用
- traefik路由(IngressRoute)
- traefik中間件(middlewares)
- traefik記錄真實IP地址
- cert-manager
- 安裝教程
- 頒布者CA
- 創建證書
- 外部存儲
- 對接NFS
- 對接ceph-rbd
- 對接cephfs
- 監控平臺
- Prometheus
- Prometheus安裝
- grafana安裝
- Prometheus配置文件
- node_exporter安裝
- kube-state-metrics安裝
- Prometheus黑盒監控
- Prometheus告警
- grafana儀表盤設置
- 常用監控配置文件
- thanos
- Prometheus
- Sidecar組件
- Store Gateway組件
- Querier組件
- Compactor組件
- Prometheus監控項
- grafana
- Querier對接grafana
- alertmanager
- Prometheus對接alertmanager
- 日志中心
- filebeat安裝
- kafka安裝
- logstash安裝
- elasticsearch安裝
- elasticsearch索引生命周期管理
- kibana安裝
- event事件收集
- 資源預留
- 節點資源預留
- imagefs與nodefs驗證
- 資源預留 vs 驅逐 vs OOM
- scheduler調度原理
- Helm
- Helm安裝
- Helm基本使用
- 安全
- apiserver審計日志
- RBAC鑒權
- namespace資源限制
- 加密Secret數據
- 服務網格
- 備份恢復
- Velero安裝
- 備份與恢復
- 常用維護操作
- container runtime
- 拉取私有倉庫鏡像配置
- 拉取公網鏡像加速配置
- runtime網絡代理
- overlay2目錄占用過大
- 更改Docker的數據目錄
- Harbor
- 重置Harbor密碼
- 問題處理
- 關閉或開啟Harbor的認證
- 固定harbor的IP地址范圍
- ETCD
- ETCD擴縮容
- ETCD常用命令
- ETCD數據空間壓縮清理
- ingress
- ingress-nginx header配置
- kubernetes
- 驗證yaml合法性
- 切換KubeProxy模式
- 容器解析域名
- 刪除節點
- 修改鏡像倉庫
- 修改node名稱
- 升級k8s集群
- 切換容器運行時
- apiserver接口
- 其他
- 升級內核
- k8s組件性能分析
- ETCD
- calico
- calico健康檢查失敗
- Harbor
- harbor同步失敗
- Kubernetes
- 資源Terminating狀態
- 啟動容器報錯