
[TOC]
## 監控集群節點
要監控節點其實我們已經有很多非常成熟的方案了,比如?Nagios、zabbix,甚至我們自己來收集數據也可以,我們這里通過?Prometheus?來采集節點的監控指標數據,可以通過?[node_exporter](https://github.com/prometheus/node_exporter)?來獲取,顧名思義,`node_exporter`?就是抓取用于采集服務器節點的各種運行指標,目前?`node_exporter`?支持幾乎所有常見的監控點,比如?conntrack,cpu,diskstats,filesystem,loadavg,meminfo,netstat?等,詳細的監控點列表可以參考其?[Github?倉庫](https://github.com/prometheus/node_exporter)。
我們可以通過?DaemonSet?控制器來部署該服務,這樣每一個節點都會自動運行一個這樣的?Pod,如果我們從集群中刪除或者添加節點后,也會進行自動擴展。
在部署?`node-exporter`?的時候有一些細節需要注意,如下資源清單文件:(prometheus-node-exporter.yaml)
```yaml
cat <<'EOF' | kubectl apply -f -
apiVersion: apps/v1
kind: DaemonSet
metadata:
name: node-exporter
namespace: kube-system
spec:
selector:
matchLabels:
app.kubernetes.io/instance: node-exporter
updateStrategy:
rollingUpdate:
maxUnavailable: 1
type: RollingUpdate
template:
metadata:
labels:
app.kubernetes.io/instance: node-exporter
spec:
securityContext:
fsGroup: 65534
runAsGroup: 65534
runAsNonRoot: true
runAsUser: 65534
containers:
- name: node-exporter
image: quay.io/prometheus/node-exporter:v1.7.0
imagePullPolicy: IfNotPresent
args:
- --path.procfs=/host/proc
- --path.sysfs=/host/sys
- --path.rootfs=/host/root
- --collector.filesystem.fs-types-exclude=^(tmpfs|devtmpfs|cgroup2|overlay)$
securityContext:
readOnlyRootFilesystem: true
ports:
- name: metrics
containerPort: 9100
protocol: TCP
livenessProbe:
failureThreshold: 3
httpGet:
httpHeaders:
path: /
port: 9100
scheme: HTTP
initialDelaySeconds: 0
periodSeconds: 10
successThreshold: 1
readinessProbe:
failureThreshold: 3
httpGet:
httpHeaders:
path: /
port: 9100
scheme: HTTP
initialDelaySeconds: 0
periodSeconds: 10
successThreshold: 1
volumeMounts:
- name: proc
mountPath: /host/proc
readOnly: true
- name: sys
mountPath: /host/sys
readOnly: true
- name: root
mountPath: /host/root
mountPropagation: HostToContainer
readOnly: true
hostNetwork: true
hostPID: true
nodeSelector:
kubernetes.io/os: linux
tolerations:
- operator: Exists
volumes:
- name: proc
hostPath:
path: /proc
- name: sys
hostPath:
path: /sys
- name: root
hostPath:
path: /
EOF
```
由于我們要獲取到的數據是主機的監控指標數據,而我們的?`node-exporter`?是運行在容器中的,所以我們在?Pod?中需要配置一些?Pod?的安全策略,這里我們就添加了?`hostPID:?true`、`hostIPC:?true`、`hostNetwork:?true`?3個策略,用來使用主機的?`PID?namespace`、`IPC?namespace`?以及主機網絡,這些?namespace?就是用于容器隔離的關鍵技術,要注意這里的?namespace?和集群中的?namespace?是兩個完全不相同的概念。
另外我們還將主機的?`/dev`、`/proc`、`/sys`這些目錄掛載到容器中,這些因為我們采集的很多節點數據都是通過這些文件夾下面的文件來獲取到的,比如我們在使用?`top`?命令可以查看當前?cpu?使用情況,數據就來源于文件?`/proc/stat`,使用?`free`?命令可以查看當前內存使用情況,其數據來源是來自?`/proc/meminfo`?文件。
```shell
$?kubectl?apply?-f?node-exporter.yaml?
daemonset.apps/node-exporter?create
$?kubectl?get?pods?-n?kube-mon?-l?app=node-exporter?-o?wide
NAME??????????????????READY???STATUS????RESTARTS???AGE???IP????????????NODE?????????NOMINATED?NODE???READINESS?GATES
node-exporter-q42fg???1/1?????Running???0??????????16m???172.20.0.14???k8s-master???<none>???????????<none>
node-exporter-r54ds???1/1?????Running???1??????????22h???172.20.0.13???k8s-node01???<none>???????????<none>
node-exporter-tdwgt???1/1?????Running???1??????????22h???172.20.0.9????k8s-node02???<none>???????????<none>
```
## 驗證
部署完成后,我們可以看到在3個節點上都運行了一個?Pod,由于我們指定了?`hostNetwork=true`,所以在每個節點上就會綁定一個端口?9100,我們可以通過這個端口去獲取到監控指標數據:
```shell
$?curl?172.20.0.14:9100/metrics
#?HELP?go_gc_duration_seconds?A?summary?of?the?pause?duration?of?garbage?collection?cycles.
#?TYPE?go_gc_duration_seconds?summary
go_gc_duration_seconds{quantile="0"}?0.098513621
go_gc_duration_seconds{quantile="0.25"}?0.098513621
go_gc_duration_seconds{quantile="0.5"}?0.098513621
go_gc_duration_seconds{quantile="0.75"}?0.098513621
go_gc_duration_seconds{quantile="1"}?0.098513621
go_gc_duration_seconds_sum?0.098513621
go_gc_duration_seconds_count?1
```
## 自定義指標
有些指標沒有對應的exporter來收集,那么只能通過自定義指標來實現。`node_exporter` 可在啟動時指定路徑,并將該路徑下的 `*.prom` 識別為監控數據文件。
**編寫腳本**
```shell
mkdir -p /opt/exports/{scripts,values}
cat > /opt/exports/scripts/pids.sh <<-EOF
#!/bin/bash
echo \# Number of system pids.
echo node_pids_kernel_use_number \$(ps -eLf | wc -l)
echo node_pids_kernel_total_number \$(sysctl kernel.pid_max | awk -F= '{print \$2}')
echo \# Number of user pids.
echo node_pids_user_use_number \$(ps -eLf | egrep "^root" | wc -l)
echo node_pids_user_total_number \$(ulimit -u)
echo \# Number of Cgroups pids.
echo node_pids_cgroup_use_number \$(cat /sys/fs/cgroup/pids/kubepods.slice/pids.current)
echo node_pids_cgroup_total_number \$(cat /sys/fs/cgroup/pids/kubepods.slice/pids.max)
EOF
```
**設置定時任務獲取值**
```shell
echo "* * * * * root bash /opt/exports/scripts/pids.sh > /opt/exports/values/pids.prom" >> /etc/crontab
```
**添加參數及掛載文件**
```shell
kubectl -n kube-mon edit ds node-exporter
# 在 secp.template.containers.args 下,新增一行
- --collector.textfile.directory=/opt/exports/values/
# 在 secp.template.containers.volumeMounts 下,新增兩行
- name: custom-indicator
mountPath: /opt/exports/values/
# 在 spec.template.volumes 下,新增三行
- name: custom-indicator
hostPath:
path: /opt/exports/values/
```
## 驗證
curl -s 192.168.31.103:9100/metrics | grep pids | egrep -v "^#"
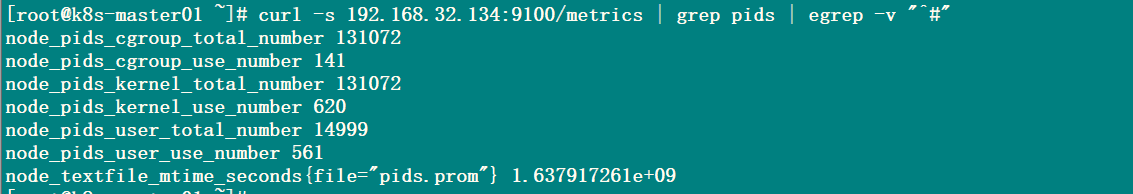
node_pids_cgroup_total_number
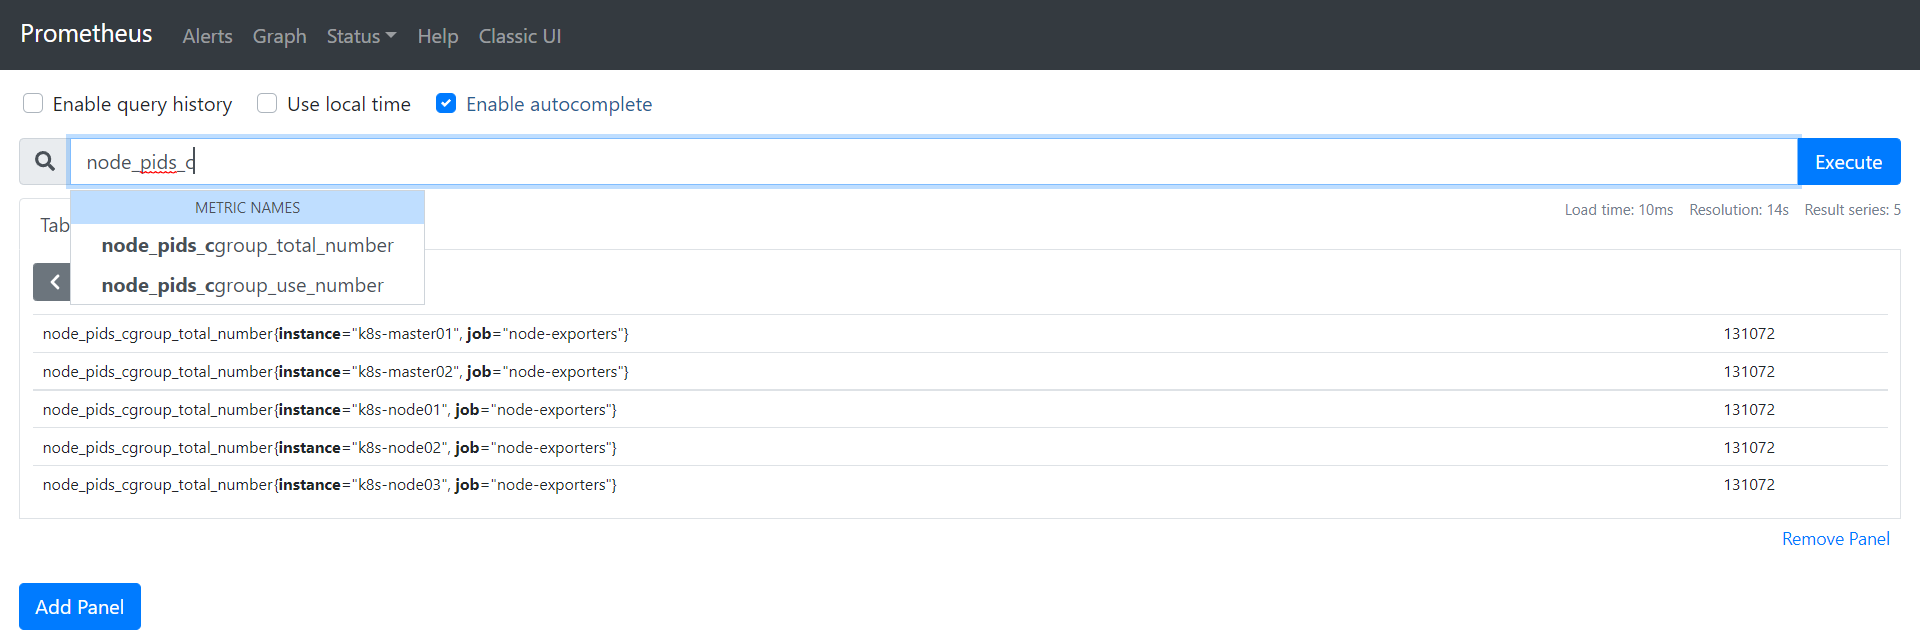
## Prometheus抓取數據
```yaml
- job_name: "node-exporters"
kubernetes_sd_configs:
- role: node
relabel_configs:
- source_labels: [__address__]
action: replace
regex: (.*):10250
target_label: __address__
replacement: $1:9100
metric_relabel_configs:
- source_labels: [__address__]
action: replace
regex: (.*):10250
target_label: instance
replacement: $1
```
## 附加iptables規則
```shell
iptables -t filter -I INPUT -p tcp --dport 9100 -m comment --comment "k8s node exporter ports" -j ACCEPT
```
- 前言
- 架構
- 部署
- kubeadm部署
- kubeadm擴容節點
- 二進制安裝基礎組件
- 添加master節點
- 添加工作節點
- 選裝插件安裝
- Kubernetes使用
- k8s與dockerfile啟動參數
- hostPort與hostNetwork異同
- 應用上下線最佳實踐
- 進入容器命名空間
- 主機與pod之間拷貝
- events排序問題
- k8s會話保持
- 容器root特權
- CNI插件
- calico
- calicoctl安裝
- calico網絡通信
- calico更改pod地址范圍
- 新增節點網卡名不一致
- 修改calico模式
- calico數據存儲遷移
- 啟用 kubectl 來管理 Calico
- calico卸載
- cilium
- cilium架構
- cilium/hubble安裝
- cilium網絡路由
- IP地址管理(IPAM)
- Cilium替換KubeProxy
- NodePort運行DSR模式
- IP地址偽裝
- ingress使用
- nginx-ingress
- ingress安裝
- ingress高可用
- helm方式安裝
- 基本使用
- Rewrite配置
- tls安全路由
- ingress發布管理
- 代理k8s集群外的web應用
- ingress自定義日志
- ingress記錄真實IP地址
- 自定義參數
- traefik-ingress
- traefik名詞概念
- traefik安裝
- traefik初次使用
- traefik路由(IngressRoute)
- traefik中間件(middlewares)
- traefik記錄真實IP地址
- cert-manager
- 安裝教程
- 頒布者CA
- 創建證書
- 外部存儲
- 對接NFS
- 對接ceph-rbd
- 對接cephfs
- 監控平臺
- Prometheus
- Prometheus安裝
- grafana安裝
- Prometheus配置文件
- node_exporter安裝
- kube-state-metrics安裝
- Prometheus黑盒監控
- Prometheus告警
- grafana儀表盤設置
- 常用監控配置文件
- thanos
- Prometheus
- Sidecar組件
- Store Gateway組件
- Querier組件
- Compactor組件
- Prometheus監控項
- grafana
- Querier對接grafana
- alertmanager
- Prometheus對接alertmanager
- 日志中心
- filebeat安裝
- kafka安裝
- logstash安裝
- elasticsearch安裝
- elasticsearch索引生命周期管理
- kibana安裝
- event事件收集
- 資源預留
- 節點資源預留
- imagefs與nodefs驗證
- 資源預留 vs 驅逐 vs OOM
- scheduler調度原理
- Helm
- Helm安裝
- Helm基本使用
- 安全
- apiserver審計日志
- RBAC鑒權
- namespace資源限制
- 加密Secret數據
- 服務網格
- 備份恢復
- Velero安裝
- 備份與恢復
- 常用維護操作
- container runtime
- 拉取私有倉庫鏡像配置
- 拉取公網鏡像加速配置
- runtime網絡代理
- overlay2目錄占用過大
- 更改Docker的數據目錄
- Harbor
- 重置Harbor密碼
- 問題處理
- 關閉或開啟Harbor的認證
- 固定harbor的IP地址范圍
- ETCD
- ETCD擴縮容
- ETCD常用命令
- ETCD數據空間壓縮清理
- ingress
- ingress-nginx header配置
- kubernetes
- 驗證yaml合法性
- 切換KubeProxy模式
- 容器解析域名
- 刪除節點
- 修改鏡像倉庫
- 修改node名稱
- 升級k8s集群
- 切換容器運行時
- apiserver接口
- 其他
- 升級內核
- k8s組件性能分析
- ETCD
- calico
- calico健康檢查失敗
- Harbor
- harbor同步失敗
- Kubernetes
- 資源Terminating狀態
- 啟動容器報錯