
## Grafana 可視化監控
**author:xiak**
**last update: 2022-10-16 20:12:22**
----
[TOC=3,8]
----
### 介紹
[Prometheus](https://prometheus.io/) 是一種存儲**時間序列指標**的簡單方法,它為用戶提供了收集、存儲、檢查和指標查詢所需的工具。
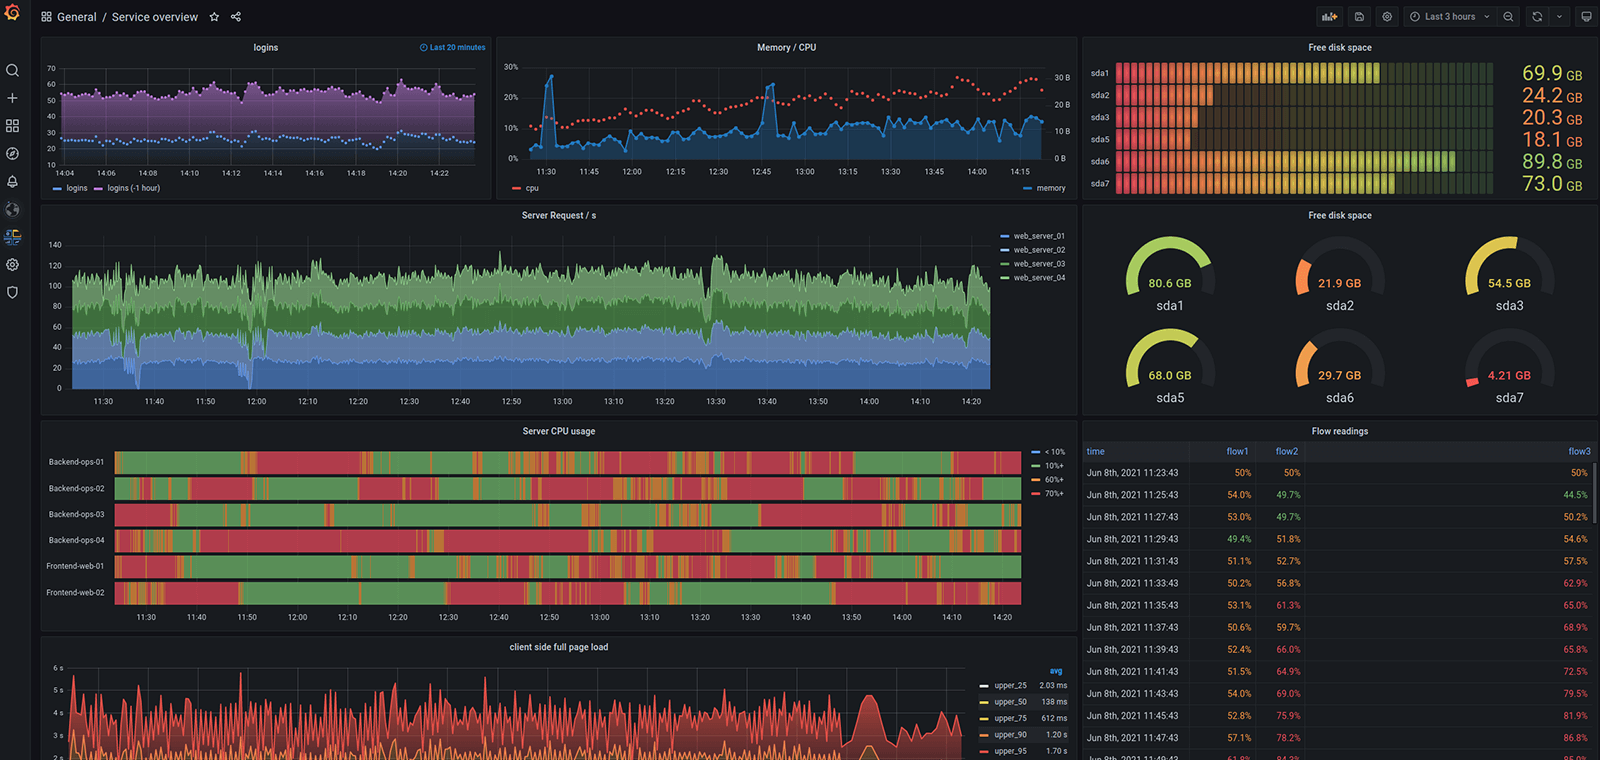
[Grafana](https://www.grafana.com/) 可以提供強大靈活的可視化頁面展示指標,它允許用戶將 Prometheus 指標作為數據源導入,并將指標**可視化為圖形和儀表板**。
類比現實世界,Grafana 、Prometheus 就是 汽車的儀表盤 和 飛機的黑匣子。
當為儀表盤時,溫度,摩擦力,胎壓,...,希望掌控一切,速度與激情。
當為黑匣子時,希望永遠也不會用到它,但是當有天真的需要它時,全世界都希望能夠找到它。
----
#### 參觀火箭發射控制中心
[Space X 龍飛船載人發射 控制室全程記錄](https://www.bilibili.com/video/av413373882/)
> 2016 年,獵鷹 9 號火箭首次發射,在 SpaceX 控制中心里,工作人員們實時監測著火箭發射期間的系統行為數據和波動情況。即便這個過程中有大量的數據產生,但借助一個可視化圖表,工作人員可以快速判斷出系統是否在正常運轉、又有哪些異常數據需要關注。這款工具就是 Grafana。[Grafana:SpaceX 的數據監測利器,云原生領域的 Tableau](https://mp.weixin.qq.com/s/zgd8KjpGoqwPGC6b1I9owg)
----
#### 看他們如何說
> “Prometheus 和 Grafana 現在是 Kubernetes 世界公認的標準,這也是我們使用的標準。我們的服務都導出 Prometheus 指標,然后收集這些指標并讀入 Grafana Cloud。” —— Grail 高級 DevOps 工程師 Zach Pallin
> “沒有普羅米修斯和格拉法納,我真的活不下去。我真的很喜歡能夠看到我的應用程序中發生的一切。” —— Austin Adams,Ygrene 高級軟件工程師
> 在卡拉搜索,我們用 Grafana 監控所有的服務狀態,從引擎到索引。完善的監控幫助我們實時了解卡拉的搜索延遲,慢搜索,Docker 狀態等等。 —— 卡拉搜索
----
### 安裝
相關端口:
```
prometheus: 9090
node_exporter: 9100 9104
Grafana: 3000
http://212.64.100.122:9090/metrics prometheus
http://212.64.100.122:9100/metrics node_exporter
http://212.64.100.122:9104/metrics mysqld_exporter
```
#### 安裝 Prometheus
```shell
wget https://github.com/prometheus/prometheus/releases/download/v2.39.0-rc.0/prometheus-2.39.0-rc.0.linux-amd64.tar.gz
tar -xvzf prometheus-2.39.0-rc.0.linux-amd64.tar.gz
cd prometheus-2.39.0-rc.0.linux-amd64
./promtool check config prometheus.yml
./prometheus --config.file="/root/prometheus-2.39.0-rc.0.linux-amd64/prometheus.yml"
pkill prometheus
http://212.64.100.122:9090/metrics
```
```shell
./prometheus \
--config.file="/opt/grafana/prometheus-2.39.0-rc.0.linux-amd64/prometheus.yml" \
--web.enable-admin-api \
--web.enable-lifecycle \
--storage.tsdb.retention.time=180d
curl -X POST -g 'http://127.0.0.1:9090/api/v1/admin/tsdb/delete_series?match[]={name=~".+"}'
curl -X POST -g 'http://127.0.0.1:9090/api/v1/admin/tsdb/clean_tombstones'
```
[prometheus刪除指定數據_51CTO博客_prometheus刪除歷史數據](https://blog.51cto.com/jschu/3728968)
[linuxea:清理kube-prometheus歷史數據 - LinuxEA](http://myapp.linuxea.com/2590.html)
[Prometheus 相關配置及命令(個人記錄)_--web.enable-admin-api_中國一動的博客-CSDN博客](https://blog.csdn.net/ChenShiAi/article/details/108833617)
----
#### 安裝 node_exporter
```shell
wget https://github.com/prometheus/node_exporter/releases/download/v1.4.0/node_exporter-1.4.0.linux-amd64.tar.gz
tar -xvzf node_exporter-1.4.0.linux-amd64.tar.gz
cd node_exporter-1.4.0.linux-amd64
nohup ./node_exporter &
http://212.64.100.122:9100/metrics
```
----
#### 安裝 mysqld_exporter
```shell
wget https://github.com/prometheus/mysqld_exporter/releases/download/v0.14.0/mysqld_exporter-0.14.0.linux-amd64.tar.gz
tar -xvzf mysqld_exporter-0.14.0.linux-amd64.tar.gz
cd mysqld_exporter-0.14.0.linux-amd64
vi my.cnf
nohup ./mysqld_exporter --config.my-cnf=/root/mysqld_exporter-0.14.0.linux-amd64/my.cnf &
http://212.64.100.122:9104/metrics
```
vi my.cnf
~~~cnf
[client]
user=root
password=****
~~~
----
#### 安裝 php-fpm_exporter
```shell
wget https://github.com/hipages/php-fpm_exporter/releases/download/v2.2.0/php-fpm_exporter_2.2.0_linux_amd64.tar.gz
tar -xvzf php-fpm_exporter_2.2.0_linux_amd64.tar.gz
cd php-fpm_exporter_2.2.0_linux_amd64
sudo -u www /root/php-fpm_exporter get --phpfpm.scrape-uri unix:/dev/shm/php-cgi.sock;/status
```
----
#### 安裝 Grafana
https://grafana.com/grafana/download?pg=get&plcmt=selfmanaged-box1-cta1
~~~
wget https://dl.grafana.com/oss/release/grafana-9.2.0-1.x86_64.rpm
sudo yum install grafana-9.2.0-1.x86_64.rpm
~~~
```shell
wget https://dl.grafana.com/enterprise/release/grafana-enterprise-9.2.0-1.x86_64.rpm
sudo yum install grafana-enterprise-9.2.0-1.x86_64.rpm
systemctl start grafana-server
systemctl enable grafana-server
http://212.64.100.122:3000/
netstat -nlpt | grep grafana
```
https://grafana.com/grafana/dashboards/
----
### 使用
~~~
### 監控指標
監控什么?
其實 就是 【指標】,你想知道什么【指標】
比如汽車,你要隨時知道 速度、油量、溫度、磨損 等等,那么 你的應用整體、架構、業務層、底層等等,你希望了解什么【指標】
----
#### node_exporter
監控服務器節點情況
----
#### nginx_exporter
監控 nginx 負載等情況
----
#### phpfpm_exporter
監控 phpfpm 負載等情況
----
#### mysqld_exporter
監控 mysql 負載、用量等情況
----
#### redis_exporter
監控 redis 負載、用量等情況
----
#### elasticsearch_exporter
監控 ElasticSearch 負載、索引、用量等情況
----
#### pulsar_exporter
監控 pulsar 負載、用量等情況
----
#### 應用指標監控
##### 應用守護進程監控
app-daemon
- 已啟動進程組數量
- 已啟動進程數量
- 進程內存消耗
- 進程cpu消耗
- 進程IO消耗
----
##### 網關應用監控
app-gatewayworker
- 網關客戶端連接數量
- 網關發送流量
- 網關接收流量
- 工人空閑數量
----
##### 停車場應用
app-parkinglot_exporter
- pt_alilot_amqp_msg
* 當日阿里物聯網設備上報消息量{全部}(實時、時間線)
* 當日阿里物聯網設備上報消息量{type1}(時間線)
* 當日阿里物聯網設備上報消息量{type2}(時間線)
- pt_request_log
* 接口請求響應時間(最近100條請求的均值)
* 當日設備端接口請求量{全部}(實時、時間線)
* 當日設備端接口請求量{設備端-計費接口}(時間線)
* 當日設備端接口請求量{設備端-出場接口}(時間線)
* 當日設備端接口請求量{設備端-其它接口}(時間線)
- pt_stoping
* 總計在停數量(實時、時間線)
- pt_rrpc_log
* 當日下發數量{全部}(實時、時間線)
* 當日下發數量{成功}(實時、時間線)
* 當日下發數量{失敗}(實時、時間線)
- pt_rrpc_fail_queue
* 總計數量{全部}(實時、時間線)
* 總計數量{3次重試}(實時、時間線)
* 總計數量{5次重試}(實時、時間線)
- pt_waiter_passageway_report
* 當日坐席通道上報記錄數量{全部}(實時、時間線)
* 當日坐席通道上報記錄數量{有車牌}(實時、時間線)
* 當日坐席通道上報記錄數量{無車牌}(實時、時間線)
- pt_report_log
* 當日坐席異常上報事件日志數量{全部}(實時、時間線)
* 當日坐席異常上報事件日志數量{待處理}(實時、時間線)
* 當日坐席異常上報事件日志數量{已處理}(實時、時間線)
- pt_operation_log
* 當日設備端操作日志數量{全部}(實時、時間線)
* 當日設備端操作日志數量{失敗}(實時、時間線)
* 當日設備端操作日志數量{成功}(實時、時間線)
- pt_consume
* 當日停車單數量{全部}(實時、時間線)
* 當日停車單數量{異常}(實時、時間線)
* 當日停車單數量{待出}(時間線)
* 當日停車單數量{已出}(時間線)
- pt_consume_orders
* 當日停車訂單數量{全部已支付}(實時、時間線)
* 當日停車訂單數量{微信已支付}(時間線)
* 當日停車訂單數量{支付寶已支付}(時間線)
* 當日停車訂單數量{其它已支付}(時間線)
- pt_parking_log
* 當日車位相機日志數量{全部}(時間線)
* 當日車位相機日志數量{識別到車牌}(時間線)
* 當日車位相機日志數量{未識別到車牌}(時間線)
- pt_recharge
* 當月固定車續費訂單數量{全部已支付}(實時、時間線)
* 當月固定車續費訂單數量{微信已支付}(時間線)
* 當月固定車續費訂單數量{支付寶已支付}(時間線)
* 當月固定車續費訂單數量{其它已支付}(時間線)
- pt_passageway_log
* 當日通道日志數量{入場}(時間線)
* 當日通道日志數量{無牌車出場}(時間線)
* 當日通道日志數量{計費}(時間線)
* 當日通道日志數量{出場}(時間線)
- pt_sync_heart
* 在線停車場數量(實時、時間線)
* 離線停車場數量(實時、時間線)
- pt_gateway
* 網關數量(實時、時間線)
* 在線數量(實時、時間線)
* 離線數量(實時、時間線)
* 其它數量(實時、時間線)
----
~~~
----
#### 什么是指標
指標是說明總體數量特征的概念及其數值的綜合,故又稱為綜合指標。在實際的統計工作和統計理論研究中,往往直接將說明總體數量特征的概念稱為指標。https://baike.baidu.com/item/%E6%8C%87%E6%A0%87/19950696?fr=aladdin
根據意義的不同,可以將要統計的指標分為四個維度:
- **業務指標**:業務層面的數值,如訂單數量,支付渠道分析 等
- **系統指標**:操作系統資源分析,如 CPU/內存抖動、磁盤/網絡IO、系統進程調度、操作系統相關數值 等
- **技術指標**:應用技術分析:如 OSS用量、短信用量、接口流量IO分布、守護進程分析、隊列任務吞吐、RRPC調用情況、接口錯誤、基礎組件相關數值分析 等
- **性能指標**:應用性能分析:如 請求耗時分析、隊列消耗吞吐、db查詢耗時瓶頸分析 等
在 Prometheus 中 指標(metrics) 就是一個名稱。
----
#### 如何選擇指標類型
Prometheus 共有4中指標類型:
##### counter
counter 是一個累積計數指標,表示單個單調遞增的計數器(只能增加不能減少),其值只能在重新啟動時增加或重置為零。例如,您可以使用計數器來表示服務的累積請求數、累積完成的任務數或錯誤數。
##### gauge
測量是一種標準的度量數值,表示任意變化的單個數值。這是最常用的指標類型,通常用于測量溫度或當前內存的使用情況,或者并發請求的數量。
##### histogram
> 直方圖(Histogram),又稱質量分布圖,是一種統計報告圖,由一系列高度不等的縱向條紋或線段表示數據分布的情況。 一般用橫軸表示數據類型,縱軸表示分布情況。 https://baike.baidu.com/item/%E7%9B%B4%E6%96%B9%E5%9B%BE/1103834?fr=aladdin
>[tip] **注意直方圖不是柱狀圖。** 直方圖展示數據的分布,柱狀圖比較數據的大小。 這是直方圖與柱狀圖最根本的區別。 https://zhuanlan.zhihu.com/p/61433510
直方圖對觀察值(通常是請求持續時間或響應大小等)進行采樣,并在可配置的存儲桶中對其進行計數。它還提供觀察結果的總數與所有觀察值的總和。
https://www.xhyonline.com/?p=1594
##### summary
和 histogram 類似,概要也對觀察結果進行采樣(通常是請求持續時間和響應大小等),和提供觀察結果的總數與所有觀察值的總和,但它在滑動時間窗口內計算可配置的分位數。
summary 和 histogram 主要是為了解決統計和分析樣本的分布情況時的長尾問題。(如果大多數API請求都維持在100ms內,而個別請求的響應時間需要5s,那么就會導致平均的響應時間落到中位數的情況,個別數值對平均值的結果造成干擾,從而無法客觀反映整體情況,這種現象被稱為長尾問題)
> 注意:指標值 都是數值類型,如整型或浮點型。
----
#### 如何使用指標標簽
通常對表示同一業務意義的指標的不同情況用標簽區分,如:
- 統計接口響應時間時,用標簽區分不同的接口模塊
- 統計訂單數量時,用標簽區分不同的訂單類型
- 統計接口流量時,用標簽區分輸入/輸出的數值
這些不同的標簽,但是它們表示都是同一業務屬性的指標,所以是同一指標的不同標簽維度上的數值而已。
有些明明是不同的業務屬性就不應該使用標簽區分了,如:
- 統計系統負載,用標簽區分 CPU 和內存 ?
- 統計磁盤,用標簽區分轉速和寫入速率 ?
- 統計redis信息,用標簽區分 KEY 數量 和 占用內存?
這些顯然就是完全不同業務意義的指標,應該使用不同的相互獨立的指標。
----
#### 安全:授權
...
----
#### 在 PHP 項目中使用
```shell
composer require promphp/prometheus_client_php
```
##### 1. 監測 接口平均響應時間
##### 2. 監測 接口響應時間分布情況
##### 3. 監測 接口實時 IO 流量
##### 4. 監測 接口實時請求量
##### 5. 監測 業務指標
----
#### prometheus_client_php
https://github.com/PromPHP/prometheus_client_php
```php
$registry = new \Prometheus\CollectorRegistry(new \Prometheus\Storage\InMemory());
// $registry = \Prometheus\CollectorRegistry::getDefault(); // redis
// doc: https://prometheus.io/docs/concepts/metric_types/
/**
* 1. 計數器(用于累計計數等)
*
* 計數器是一個累積指標,表示單個單調遞增的計數器,其值只能在重新啟動時增加或重置為零。
* 例如,您可以使用計數器來表示服務的請求數、完成的任務數或錯誤數。
*/
$counter = $registry->getOrRegisterCounter('app_parkinglot', 'api_request_total', 'it increases', ['type', 'curr_url']);
$counter->incBy(1, ['client', 'join']);
$counter->incBy(0, ['client', 'noplateLeaveRequest']);
$counter->incBy(3, ['client', 'recordConsume']);
$counter->incBy(2, ['client', 'leave']);
$counter2 = $registry->getOrRegisterCounter('app_parkinglot', 'smartpark_total', 'it increases');
$counter2->incBy(100);
/**
* 2. 測量(用于時間線、折線圖等)
*
* 量規是一種度量標準,表示可以任意上下移動的單個數值。
* 儀表通常用于測量值,如溫度或當前內存使用情況,但也可以上下移動的“計數”,如并發請求的數量。
*/
$gauge = $registry->getOrRegisterGauge('app_parkinglot', 'today_consume_orders', 'it sets', ['payway']);
$gauge->set(5, ['all']);
$gauge->set(2, ['alipay']);
$gauge->set(1, ['wxpay']);
$gauge->set(2, ['other']);
/**
* 3. 直方圖(用于柱狀圖等)
*
* 直方圖對觀察值(通常是請求持續時間或響應大小等)進行采樣
* 并在可配置的存儲桶中對其進行計數。它還提供所有觀察值的總和。
*/
$histogram = $registry->getOrRegisterHistogram('app_parkinglot', 'api_request_time1', 'it observes', ['type'], [0.1, 1, 2, 3.5, 4, 5, 6, 7, 8, 9]);
$histogram->observe(0.1, ['client']);
$histogram->observe(1, ['client']);
$histogram->observe(1, ['client']);
$histogram->observe(3.5, ['client']);
/**
* 4. 概要(與直方圖類似)
*
* 摘要對觀察結果進行采樣(通常是請求持續時間和響應大小等)。
* 雖然它還提供觀察結果的總數和所有觀察值的總和,但它在滑動時間窗口內計算可配置的分位數。
*/
$summary = $registry->getOrRegisterSummary('app_parkinglot', 'api_request_time2', 'it observes a sliding window', ['type'], 84600, [0.01, 0.05, 0.5, 0.95, 0.99]);
$summary->observe(5, ['client']);
// 渲染輸出
$renderer = new \Prometheus\RenderTextFormat();
$result = $renderer->render($registry->getMetricFamilySamples());
header('Content-type: ' . \Prometheus\RenderTextFormat::MIME_TYPE);
echo $result;
```
~~~text/plain
# HELP app_parkinglot_api_request_time1 it observes
# TYPE app_parkinglot_api_request_time1 histogram
app_parkinglot_api_request_time1_bucket{type="client",le="0.1"} 1
app_parkinglot_api_request_time1_bucket{type="client",le="1"} 3
app_parkinglot_api_request_time1_bucket{type="client",le="2"} 3
app_parkinglot_api_request_time1_bucket{type="client",le="3.5"} 4
app_parkinglot_api_request_time1_bucket{type="client",le="4"} 4
app_parkinglot_api_request_time1_bucket{type="client",le="5"} 4
app_parkinglot_api_request_time1_bucket{type="client",le="6"} 4
app_parkinglot_api_request_time1_bucket{type="client",le="7"} 4
app_parkinglot_api_request_time1_bucket{type="client",le="8"} 4
app_parkinglot_api_request_time1_bucket{type="client",le="9"} 4
app_parkinglot_api_request_time1_bucket{type="client",le="+Inf"} 4
app_parkinglot_api_request_time1_count{type="client"} 4
app_parkinglot_api_request_time1_sum{type="client"} 5.6
# HELP app_parkinglot_api_request_time2 it observes a sliding window
# TYPE app_parkinglot_api_request_time2 summary
app_parkinglot_api_request_time2{type="client",quantile="0.01"} 5
app_parkinglot_api_request_time2{type="client",quantile="0.05"} 5
app_parkinglot_api_request_time2{type="client",quantile="0.5"} 5
app_parkinglot_api_request_time2{type="client",quantile="0.95"} 5
app_parkinglot_api_request_time2{type="client",quantile="0.99"} 5
app_parkinglot_api_request_time2_count{type="client"} 1
app_parkinglot_api_request_time2_sum{type="client"} 5
# HELP app_parkinglot_api_request_total it increases
# TYPE app_parkinglot_api_request_total counter
app_parkinglot_api_request_total{type="client",curr_url="join"} 1
app_parkinglot_api_request_total{type="client",curr_url="leave"} 2
app_parkinglot_api_request_total{type="client",curr_url="noplateLeaveRequest"} 0
app_parkinglot_api_request_total{type="client",curr_url="recordConsume"} 3
# HELP app_parkinglot_smartpark_total it increases
# TYPE app_parkinglot_smartpark_total counter
app_parkinglot_smartpark_total 100
# HELP app_parkinglot_today_consume_orders it sets
# TYPE app_parkinglot_today_consume_orders gauge
app_parkinglot_today_consume_orders{payway="alipay"} 2
app_parkinglot_today_consume_orders{payway="all"} 5
app_parkinglot_today_consume_orders{payway="other"} 2
app_parkinglot_today_consume_orders{payway="wxpay"} 1
# HELP php_info Information about the PHP environment.
# TYPE php_info gauge
php_info{version="7.2.1"} 1
~~~
----
#### 使用域名訪問:nginx代理
/usr/local/nginx/conf/vhost/grafana.domain.cn.conf
~~~
# this is required to proxy Grafana Live WebSocket connections.
map $http_upgrade $connection_upgrade {
default upgrade;
'' close;
}
upstream grafana {
server localhost:3000;
}
server {
listen 80;
server_name grafana.yf5g.cn;
root /usr/share/nginx/html;
index index.html index.htm;
location / {
proxy_set_header Host $http_host;
proxy_pass http://grafana;
}
# Proxy Grafana Live WebSocket connections.
location /api/live/ {
proxy_http_version 1.1;
proxy_set_header Upgrade $http_upgrade;
proxy_set_header Connection $connection_upgrade;
proxy_set_header Host $http_host;
proxy_pass http://grafana;
}
}
~~~
/usr/local/nginx/conf/vhost/prom.domain.cn.conf
~~~
server {
listen 80;
server_name prom.yf5g.cn;
root /usr/share/nginx/html;
index index.html index.htm;
location / {
proxy_set_header Host $http_host;
proxy_pass http://127.0.0.1:9090;
}
}
~~~
~~~
# my global config
global:
scrape_interval: 5s # Set the scrape interval to every 15 seconds. Default is every 1 minute.
evaluation_interval: 15s # Evaluate rules every 15 seconds. The default is every 1 minute.
# scrape_timeout is set to the global default (10s).
# Alertmanager configuration
alerting:
alertmanagers:
- static_configs:
- targets:
# - alertmanager:9093
# Load rules once and periodically evaluate them according to the global 'evaluation_interval'.
rule_files:
# - "first_rules.yml"
# - "second_rules.yml"
# A scrape configuration containing exactly one endpoint to scrape:
# Here it's Prometheus itself.
scrape_configs:
# The job name is added as a label `job=<job_name>` to any timeseries scraped from this config.
- job_name: "prometheus"
# metrics_path defaults to '/metrics'
# scheme defaults to 'http'.
static_configs:
- targets: ["localhost:9090"]
- job_name: "apps"
static_configs:
# test kf master parkinglot-saas
- targets: ["47.100.138.203:9222", "47.103.43.36:9222", "221.234.40.8:9222", "106.14.113.22:9222"]
~~~
----
### 安裝 Loki
https://grafana.com/docs/loki/latest/installation/local/
```shell
wget https://github.com/grafana/loki/releases/download/v2.6.1/logcli-linux-amd64.zip
unzip logcli-linux-amd64.zip
cd logcli-linux-amd64
wget https://raw.githubusercontent.com/grafana/loki/master/cmd/loki/loki-local-config.yaml
wget https://raw.githubusercontent.com/grafana/loki/main/clients/cmd/promtail/promtail-local-config.yaml
./loki-linux-amd64 -config.file=loki-local-config.yaml
```
```shell
systemd start loki && systemd enable loki
systemd start promtail && systemd enable promtail
```
----
### 相關資料
[Prometheus看完這些,入門就夠了 - 知乎](https://zhuanlan.zhihu.com/p/267966193)
[Prometheus監控系統實戰](https://mp.weixin.qq.com/s/Y1wj8UjTxQfBikr6I2zD-w)
[Grafana 中文入門教程 | 構建你的第一個儀表盤](https://mp.weixin.qq.com/s/IKdEBTP2E3juXkaCicdaYw)
[Metric types | Prometheus](https://prometheus.io/docs/concepts/metric_types/)
[PromQL全解析 - 知乎](https://zhuanlan.zhihu.com/p/477177336)
[【翻譯】Prometheus最佳實踐 Summary和Histogram - 簡書](https://www.jianshu.com/p/ccffd6b9e3d1)
https://grafana.com/tutorials/run-grafana-behind-a-proxy/
https://blog.csdn.net/weixin_42393272/article/details/112838170
~~~
Histogram和Summary主用用于統計和分析樣本的分布情況.
在大多數情況下人們都傾向于使用某些量化指標的平均值,例如CPU的平均使用率,頁面的平均響應時間.這種方式的問題很明顯,以系統API調用的平均響應時間為例:如果大多數API請求都維持在100ms的響應時間范圍內,而個別請求的響應時間需要5s,那么就會導致某些WEB頁面的響應時間落到中位數的情況,而這種現象被稱為長尾問題.
為了區分是平均的慢還是長尾的慢,最簡單的方式就是按照請求延遲的范圍進行分組.例如,統計延遲在0~10ms之間的請求數有多少而10~20ms之間的請求數又有多少.通過這種方式可以快速分析系統慢的原因.Histogram和Summary都是為了能夠解決這樣問題的存在,通過Histogram和Summary類型的監控指標,我們可以快速了解監控樣本的分布情況.
~~~
- 開始
- 公益
- 更好的使用看云
- 推薦書單
- 優秀資源整理
- 技術文章寫作規范
- SublimeText - 編碼利器
- PSR-0/PSR-4命名標準
- php的多進程實驗分析
- 高級PHP
- 進程
- 信號
- 事件
- IO模型
- 同步、異步
- socket
- Swoole
- PHP擴展
- Composer
- easyswoole
- php多線程
- 守護程序
- 文件鎖
- s-socket
- aphp
- 隊列&并發
- 隊列
- 講個故事
- 如何最大效率的問題
- 訪問式的web服務(一)
- 訪問式的web服務(二)
- 請求
- 瀏覽器訪問阻塞問題
- Swoole
- 你必須理解的計算機核心概念 - 碼農翻身
- CPU阿甘 - 碼農翻身
- 異步通知,那我要怎么通知你啊?
- 實時操作系統
- 深入實時 Linux
- Redis 實現隊列
- redis與隊列
- 定時-時鐘-阻塞
- 計算機的生命
- 多進程/多線程
- 進程通信
- 拜占庭將軍問題深入探討
- JAVA CAS原理深度分析
- 隊列的思考
- 走進并發的世界
- 鎖
- 事務筆記
- 并發問題帶來的后果
- 為什么說樂觀鎖是安全的
- 內存鎖與內存事務 - 劉小兵2014
- 加鎖還是不加鎖,這是一個問題 - 碼農翻身
- 編程世界的那把鎖 - 碼農翻身
- 如何保證萬無一失
- 傳統事務與柔性事務
- 大白話搞懂什么是同步/異步/阻塞/非阻塞
- redis實現鎖
- 淺談mysql事務
- PHP異常
- php錯誤
- 文件加載
- 路由與偽靜態
- URL模式之分析
- 字符串處理
- 正則表達式
- 數組合并與+
- 文件上傳
- 常用驗證與過濾
- 記錄
- 趣圖
- foreach需要注意的問題
- Discuz!筆記
- 程序設計思維
- 抽象與具體
- 配置
- 關于如何學習的思考
- 編程思維
- 談編程
- 如何安全的修改對象
- 臨時
- 臨時筆記
- 透過問題看本質
- 程序后門
- 邊界檢查
- session
- 安全
- 王垠
- 第三方數據接口
- 驗證碼問題
- 還是少不了虛擬機
- 程序員如何談戀愛
- 程序員為什么要一直改BUG,為什么不能一次性把代碼寫好?
- 碎碎念
- 算法
- 實用代碼
- 相對私密與絕對私密
- 學習目標
- 隨記
- 編程小知識
- foo
- 落盤
- URL編碼的思考
- 字符編碼
- Elasticsearch
- TCP-IP協議
- 碎碎念2
- Grafana
- EFK、ELK
- RPC
- 依賴注入
- 開發筆記
- 經緯度格式轉換
- php時區問題
- 解決本地開發時調用遠程AIP跨域問題
- 后期靜態綁定
- 談tp的跳轉提示頁面
- 無限分類問題
- 生成微縮圖
- MVC名詞
- MVC架構
- 也許模塊不是唯一的答案
- 哈希算法
- 開發后臺
- 軟件設計架構
- mysql表字段設計
- 上傳表如何設計
- 二開心得
- awesomes-tables
- 安全的代碼部署
- 微信開發筆記
- 賬戶授權相關
- 小程序獲取是否關注其公眾號
- 支付相關
- 提交訂單
- 微信支付筆記
- 支付接口筆記
- 支付中心開發
- 下單與支付
- 支付流程設計
- 訂單與支付設計
- 敏感操作驗證
- 排序設計
- 代碼的運行環境
- 搜索關鍵字的顯示處理
- 接口異步更新ip信息
- 圖片處理
- 項目搭建
- 閱讀文檔的新方式
- mysql_insert_id并發問題思考
- 行鎖注意事項
- 細節注意
- 如何處理用戶的輸入
- 不可見的字符
- 抽獎
- 時間處理
- 應用開發實戰
- python 學習記錄
- Scrapy 教程
- Playwright 教程
- stealth.min.js
- Selenium 教程
- requests 教程
- pyautogui 教程
- Flask 教程
- PyInstaller 教程
- 蜘蛛
- python 文檔相似度驗證
- thinkphp5.0數據庫與模型的研究
- workerman進程管理
- workerman網絡分析
- java學習記錄
- docker
- 筆記
- kubernetes
- Kubernetes
- PaddlePaddle
- composer
- oneinstack
- 人工智能 AI
- 京東
- pc_detailpage_wareBusiness
- doc
- 電商網站設計
- iwebshop
- 商品規格分析
- 商品屬性分析
- tpshop
- 商品規格分析
- 商品屬性分析
- 電商表設計
- 設計記錄
- 優惠券
- 生成唯一訂單號
- 購物車技術
- 分類與類型
- 微信登錄與綁定
- 京東到家庫存系統架構設計
- crmeb
- 命名規范
- Nginx https配置
- 關于人工智能
- 從人的思考方式到二叉樹
- 架構
- 今日有感
- 文章保存
- 安全背后: 瀏覽器是如何校驗證書的
- 避不開的分布式事務
- devops自動化運維、部署、測試的最后一公里 —— ApiFox 云時代的接口管理工具
- 找到自己今生要做的事
- 自動化生活
- 開源與漿果
- Apifox: API 接口自動化測試指南