
# Spring Cloud Zipkin 和 Sleuth 示例
> 原文: [https://howtodoinjava.com/spring-cloud/spring-cloud-zipkin-sleuth-tutorial/](https://howtodoinjava.com/spring-cloud/spring-cloud-zipkin-sleuth-tutorial/)
[Zipkin](http://zipkin.io/) 是用于[微服務](https://howtodoinjava.com/microservices/microservices-definition-principles-benefits/)生態系統中**分布式跟蹤**的非常有效的工具。 通常,分布式跟蹤是對分布式事務中每個組件的延遲度量,其中調用多個微服務來為單個業務用例提供服務。 假設從我們的應用程序中,我們必須為事務調用 4 個不同的服務/組件。 在啟用了分布式跟蹤的情況下,我們可以測量哪個組件花費了多少時間。
這在調試過程中非常有用,當涉及大量基礎系統并且應用程序在任何特定情況下變慢時。 在這種情況下,我們首先需要確定哪個底層服務實際上是緩慢的。 一旦發現服務緩慢,我們便可以解決該問題。 分布式跟蹤有助于識別生態系統中的緩慢組件。
## Zipkin
Zipkin 最初是在 Twitter 上開發的,基于 Google 論文的概念,該論文描述了 Google 內部構建的分布式應用程序調試器 – [精簡程序](http://research.google.com/pubs/pub36356.html)。 它管理此數據的收集和查找。 要使用 Zipkin,將對應用程序進行檢測以向其報告計時數據。
如果要對生態系統中的延遲問題或錯誤進行故障排除,則可以根據應用程序,跟蹤的長度,注解或時間戳來對所有跟蹤進行過濾或排序。 通過分析這些跟蹤,可以確定哪些組件未按預期執行,并可以對其進行修復。
內部有 4 個模塊:
1. **收集器** – 一旦任何組件將跟蹤數據發送到 Zipkin 收集器守護程序,Zipkin 收集器就會對其進行驗證,存儲和索引以進行查找。
2. **存儲** – 此模塊在后端存儲和索引查找數據。 支持 [Cassandra](https://cassandra.apache.org/),[ElasticSearch](https://www.elastic.co/) 和 [MySQL](https://howtodoinjava.com/mysql/how-to-installuninstallexecute-mysql-as-windows-service/)。
3. **搜索** – 此模塊提供了一個簡單的 JSON API,用于查找和檢索存儲在后端的跟蹤。 該 API 的主要使用者是 Web UI。
4. **Web UI** – 一個非常好的 UI 界面,用于查看軌跡。
#### 如何安裝 Zipkin
可以在[快速入門頁](http://zipkin.io/pages/quickstart.html)上找到適用于不同操作系統的詳細安裝步驟,包括 [Docker](https://howtodoinjava.com/cloud/docker-hello-world-example/) 映像。 對于 Windows 安裝,只需從[ maven 存儲庫](https://search.maven.org/remote_content?g=io.zipkin.java&a=zipkin-server&v=LATEST&c=exec)下載最新的 Zipkin 服務器,然后使用以下命令運行[可執行 jar ](https://howtodoinjava.com/maven/maven-shade-plugin-create-uberfat-jar-example/)文件。
```java
java -jar zipkin-server-1.30.3-exec.jar
```
Zipkin 啟動后,我們可以在`http://localhost:9411/zipkin/`上看到 Web UI。
上面的命令將使用默認配置啟動 Zipkin 服務器。 對于高級配置,我們可以配置許多其他內容,例如存儲,收集器監聽器等。
要**在 Spring Boot 應用程序**中安裝 Zipkin,我們需要在 Spring Boot 項目中添加 Zipkin 啟動器依賴項。
```java
<dependency>
<groupId>org.springframework.cloud</groupId>
<artifactId>spring-cloud-starter-zipkin</artifactId>
</dependency>
```
## Sleuth
[Sleuth](https://cloud.spring.io/spring-cloud-sleuth/) 是 Spring Cloud 系列的工具。 它用于生成跟蹤 ID,span id,并將這些信息添加到標頭和 MDC 中的服務調用中,以便諸如 Zipkin 和 [ELK](https://howtodoinjava.com/microservices/elk-stack-tutorial-example/) 等用于存儲,索引和處理日志文件之類的工具可以使用它。由于它來自 Spring Cloud 系列,因此一旦添加到`CLASSPATH`中,它就會自動集成到常見的通信渠道,例如:
* 使用[`RestTemplate`](https://howtodoinjava.com/spring/spring-restful/spring-restful-client-resttemplate-example/)等發出的請求。
* 通過 [Netflix Zuul](https://howtodoinjava.com/spring/spring-cloud/spring-cloud-api-gateway-zuul/) 微代理的請求
* 在 [Spring MVC](https://howtodoinjava.com/spring-mvc-tutorial/) 控制器處收到的 HTTP 標頭
* 通過諸如 Apache Kafka 或 RabbitMQ 等消息傳遞技術的請求。
使用偵探非常容易。 我們只需要在 spring boot 項目中添加它的啟動 pom。 它將 Sleuth 添加到項目中,因此在其運行時也是如此。
```java
<dependency>
<groupId>org.springframework.cloud</groupId>
<artifactId>spring-cloud-starter-sleuth</artifactId>
</dependency>
```
到目前為止,我們已經將 Zipkin 和 Sleuth 集成到微服務中并運行 Zipkin 服務器。 讓我們看看如何利用此設置。
## Zipkin 和 Sleuth 集成示例
對于此演示,讓我們創建 4 個基于 spring boot 的微服務。 它們都將同時具有 Zipkin 和 Sleuth 啟動器依賴項。 在每個微服務中,我們將公開一個端點,從第一個服務中我們將調用第二個服務,從第二個服務中我們將調用第三個服務,以此類推,以此類推。
正如我們已經提到的,Sleuth 會自動與 rest 模板一起使用,因此它將將此檢測到的服務調用信息發送到連接的 Zipkin 服務器。 然后 Zipkin 將開始進行延遲計算以及其他一些統計數據(如服務調用詳細信息)的記賬。
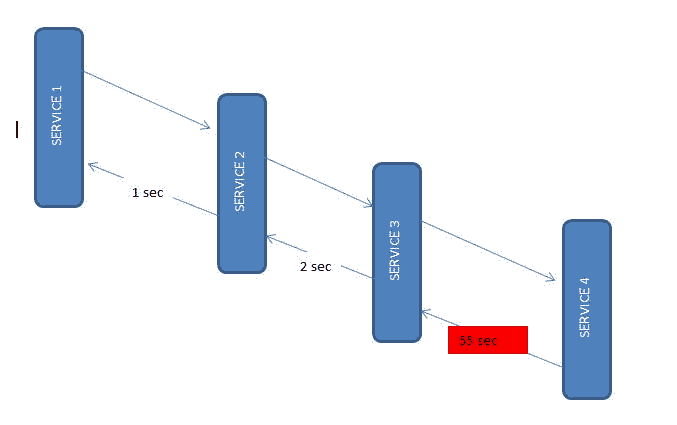
微服務交互
#### 創建微服務
所有這四個服務將具有相同的配置,唯一的不同是端點更改的服務調用詳細信息。 讓我們[創建具有 Web,Rest Repository,Zipkin 和 Sleuth 依賴項的 Spring Boot 應用程序](https://howtodoinjava.com/spring/spring-boot/spring-boot-tutorial-with-hello-world-example/)。
我將這些服務打包在一個父項目中,以便可以將這四個服務一起構建以節省時間。 如果愿意,可以繼續進行個人設置。 另外,我還添加了有用的 Windows 腳本,因此只需一個命令即可啟動/停止所有服務。
這是一個示例 rest 控制器,它公開一個端點并使用 rest 模板調用一個下游服務。
```java
package com.example.zipkinservice1;
import org.apache.log4j.Logger;
import org.springframework.beans.factory.annotation.Autowired;
import org.springframework.boot.SpringApplication;
import org.springframework.boot.autoconfigure.SpringBootApplication;
import org.springframework.cloud.sleuth.sampler.AlwaysSampler;
import org.springframework.context.annotation.Bean;
import org.springframework.core.ParameterizedTypeReference;
import org.springframework.http.HttpMethod;
import org.springframework.web.bind.annotation.GetMapping;
import org.springframework.web.bind.annotation.RestController;
import org.springframework.web.client.RestTemplate;
@SpringBootApplication
public class ZipkinService1Application {
public static void main(String[] args) {
SpringApplication.run(ZipkinService1Application.class, args);
}
}
@RestController
class ZipkinController{
@Autowired
RestTemplate restTemplate;
@Bean
public RestTemplate getRestTemplate() {
return new RestTemplate();
}
@Bean
public AlwaysSampler alwaysSampler() {
return new AlwaysSampler();
}
private static final Logger LOG = Logger.getLogger(ZipkinController.class.getName());
@GetMapping(value="/zipkin")
public String zipkinService1()
{
LOG.info("Inside zipkinService 1..");
String response = (String) restTemplate.exchange("http://localhost:8082/zipkin2",
HttpMethod.GET, null, new ParameterizedTypeReference<String>() {}).getBody();
return "Hi...";
}
}
```
#### 應用程序設置
由于所有服務都將在一臺計算機上運行,??因此我們需要在不同的端口上運行它們。 另外,要在 Zipkin 中進行標識,我們需要提供適當的名稱。 因此,請在資源文件夾下的`application.properties`文件中配置應用程序名稱和端口信息。
```java
server.port = 8081
spring.application.name = zipkin-server1
```
同樣,對于其他 3 個服務,我們將使用端口 **8082**,**8083**,**8084**,名稱也將類似于`zipkin-server2`,`zipkin-server3`和`zipkin-server4`。
另外,我們有意在上次服務中引入了延遲,以便我們可以在 Zipkin 中進行查看。
## 示例
使用微服務中的命令`mvn clean install`進行最終的 Maven 構建,啟動所有 4 個應用程序以及 zipkin 服務器。
對于快速啟動和停止,使用批處理文件`Start-all.bat`和`Stop-all.bat`。
現在,從瀏覽器測試第一個服務端點幾次 – `http://localhost:8081/zipkin`。 請注意,上述 4 種服務之一有意延遲。 因此,延遲是預期的最終響應,只是不要放棄。
API 調用成功后,我們可以在 zipkin UI `http://localhost:9411/zipkin/`上看到延遲統計信息。 在第一個下拉菜單中選擇第一個服務,然后單擊**查找跟蹤**按鈕。
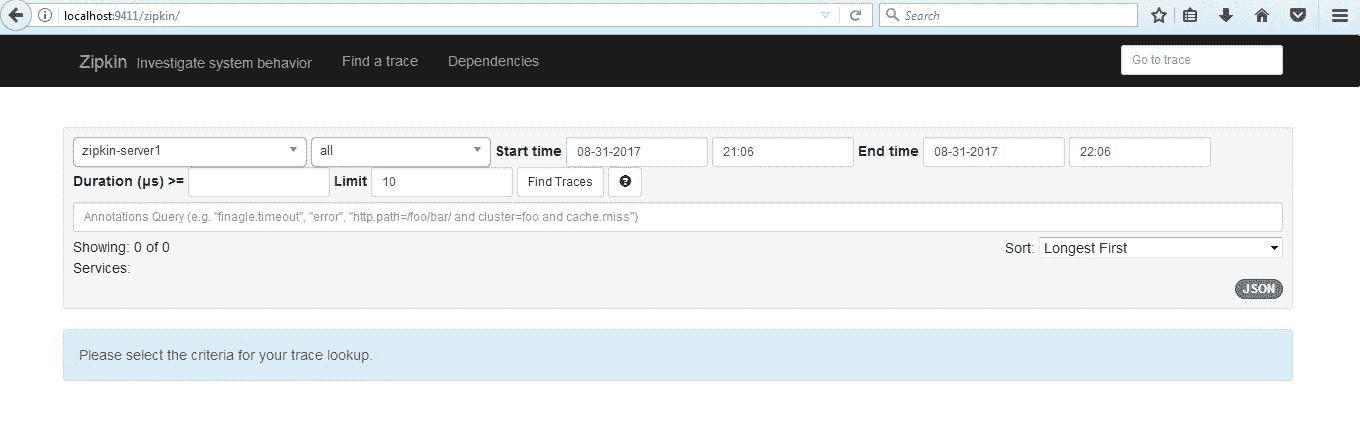
Zipkin 主界面
您應該看到這種類型的 UI,可以在其中通過查看跟蹤數據來進行性能分析。
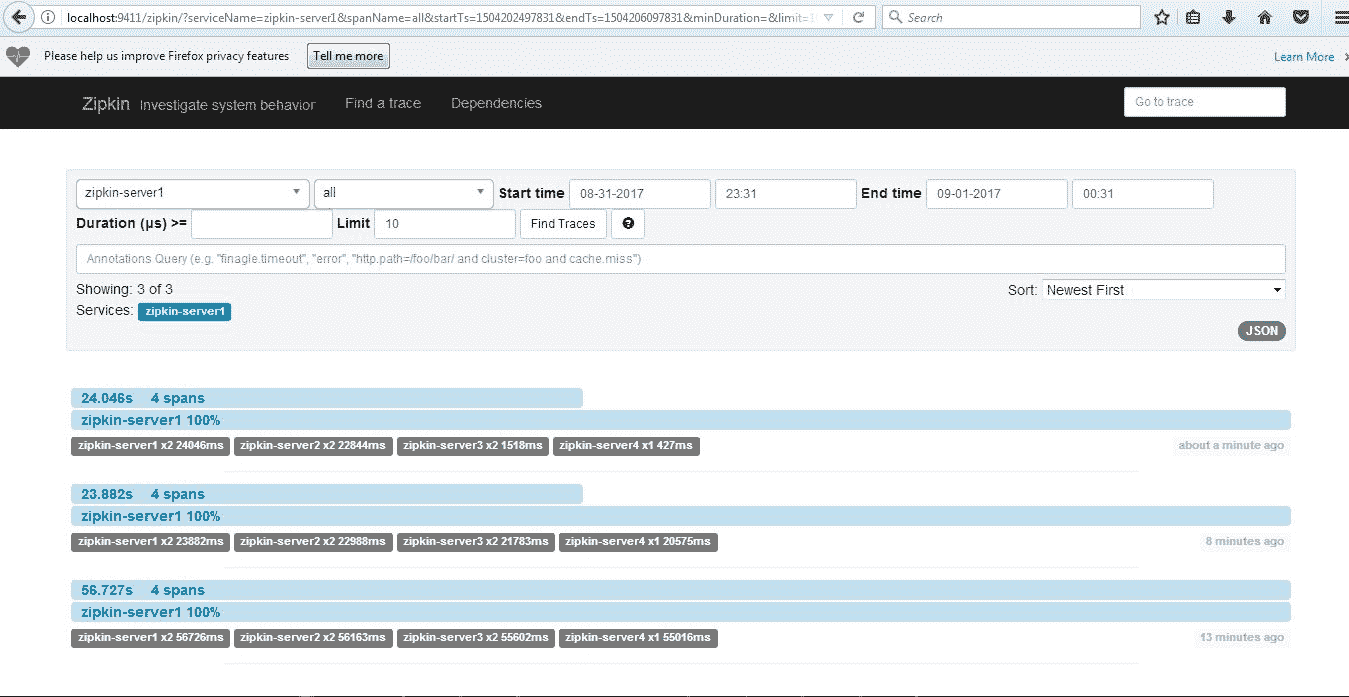
查找跟蹤 UI
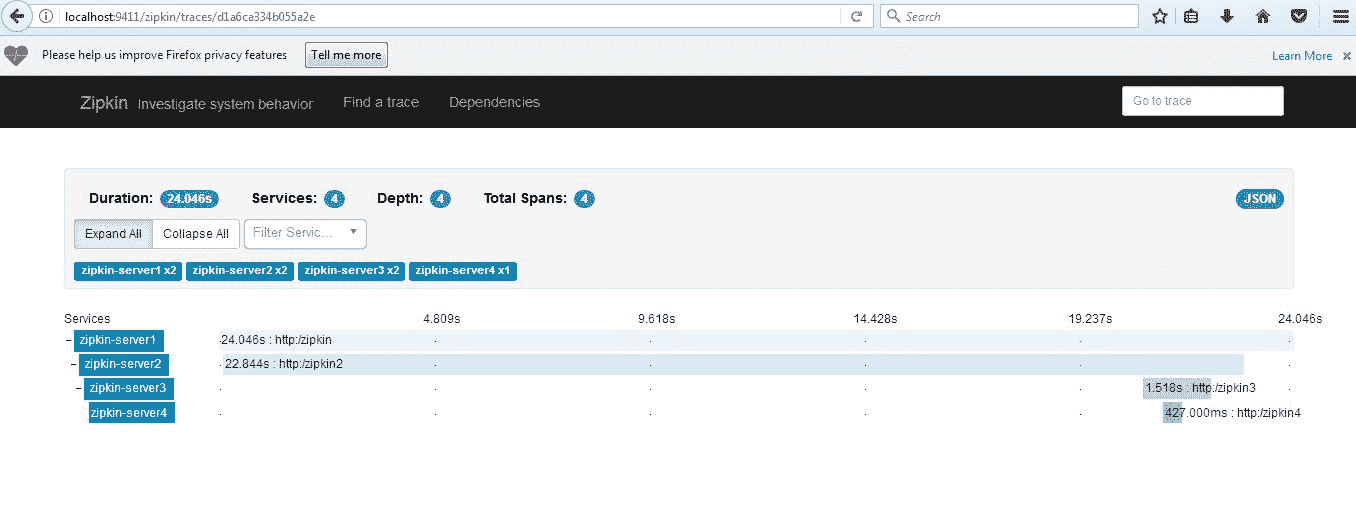
一個特定的事務概述
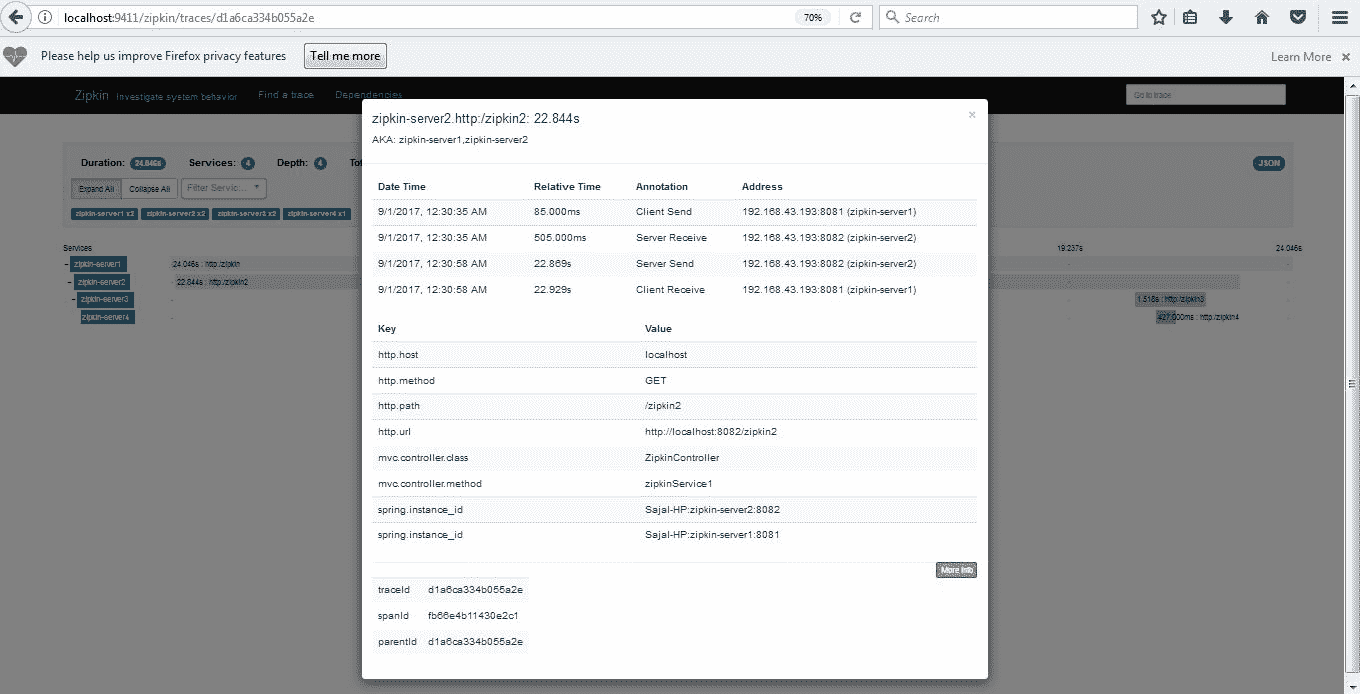
特定服務調用統計的詳細信息
## 總結
在本教程中,我們學習了使用 Zipkin 分析服務調用中的延遲。 我們還了解了 Sleuth 如何幫助我們創建元數據并將其傳遞給 Zipkin。
希望這些信息對您使用 Zipkin 和 Sleuth 進行**分布式跟蹤很有幫助**。
[下載源碼](https://howtodoinjava.com/wp-content/uploads/2017/08/zipkin.zip)
將我的問題放在評論部分。
學習愉快!
- HowToDoInJava Spring 教程
- Spring 5
- Spring 5 教程
- Spring 5 的新功能和增強功能
- Spring 使用注解配置 Bean
- Spring bean – XML 配置
- Spring – @Lazy加載
- Spring DispatcherServlet – 它是如何工作的?
- Spring @PostMapping示例 – @GetMapping示例
- Spring 5 MVC + Hibernate 5 示例
- Spring 和 CORS
- Spring Security 5 – Java 配置
- Spring Security 5 登錄表單示例
- Spring
- Spring 教程
- Spring – IoC 容器
- Spring – 控制反轉與依賴注入
- Spring 5 – Bean 范圍
- Spring – Bean 生命周期
- Spring BeanPostProcessor示例
- SpringBean 自動裝配 – @Autowired
- Spring 注解
- Spring – 原型注解
- Spring @Scheduled – 安排任務的 4 種方法
- Spring 定時器任務
- Spring – 應用事件
- Spring i18n – ResourceBundleMessageSource
- Spring ResourceLoaderAware - 在 Spring 中讀取文件
- Spring 屬性編輯器 – CustomEditorConfigurer示例
- Spring – 使用JavaMailSender發送電子郵件
- Spring 的無版本模式(最新版本)
- Spring 面試問答
- 編寫配置文件的 13 個 Spring 最佳實踐
- SpringBoot 2
- SpringBoot 教程
- spring-boot-starter-parent示例
- spring-boot-starter Maven 模板
- Spring Boot 多模塊 Maven 項目示例
- Spring Boot 注解
- Spring Boot2 @SpringBootApplication自動配置
- Spring Boot 和 AOP
- Spring Boot 日志指南
- Spring Boot Devtools 教程
- Spring Boot WAR 包示例
- Spring Boot 2 REST API 示例
- Spring Boot Crud 操作示例與 Hibernate
- Spring Boot 2 – OAuth2 Auth 和資源服務器
- 在 Spring Boot 2 中進行測試
- Spring RestTemplate – Spring REST 客戶端示例
- Spring Boot – CRUD 應用程序
- Spring Boot Hibernate 配置示例
- Spring Boot – 數據源配置
- Spring Boot 異常處理 – @ExceptionHandler示例
- Spring Boot 緩存示例教程
- 使用 Spring Boot 的 SpringRetry 模塊示例
- Spring Boot Security Rest 基本身份驗證示例
- Spring Boot 和 H2 數據庫
- Spring Boot 2 和 ehcache 3 示例
- Spring Boot 2 與 Gson
- Spring Boot Remoting – Spring RMI 注解示例
- SpringBoot – 發送帶有附件的電子郵件
- Spring Boot 面試問題
- SpringBoot
- SpringBoot – CommandLineRunner接口示例
- Spring Boot – 配置 Jetty 服務器
- Spring Boot 更改嵌入式服務器的默認端口
- Spring Boot – 更改上下文路徑
- Spring Boot SSL(HTTPS)示例
- Spring Boot – 獲取所有已加載的帶有類類型信息的 bean
- Spring Boot – 自定義PropertyEditor配置示例
- Spring Boot @Scheduled注解示例
- Spring Boot Jersey 示例
- Spring Boot SOAP Web 服務示例
- Spring Boot SOAP 客戶端 – WebServiceTemplate示例
- 帶有嵌入式 ActiveMQ 的 Spring Boot JMSTemplate
- Spring Boot Hello World 示例 – Spring Boot REST 示例
- Spring Boot JSP 視圖解析器示例
- SpringBoot – 執行器
- Spring Boot – 帶有 JAX-RS 注解的基于角色的安全性
- Spring Boot RSS feed 和 ROAM
- Spring Boot ehcache 2 示例
- SpringBatch
- Spring Batch + Spring Boot Java 配置示例
- Spring Batch 事件監聽器
- Spring Batch ItemProcessor示例
- 使用 Spring TaskScheduler進行 Spring Batch 作業調度
- Spring Batch Quartz Java 配置示例
- Spring Batch + Quartz + H2 Jdbcjobstore 示例
- 在 Quartz 作業中注入 Spring 依賴項
- Spring Batch FlatFileItemReader – 讀取 CSV 示例
- Spring Batch FlatFileItemWriter – 寫入 CSV 文件
- Spring Batch MultiResourceItemReader – 讀取多個 CSV 文件示例
- Spring Batch 讀取后刪除或存檔文件
- Spring Batch 已處理記錄的計數示例
- Spring Batch CSV 到數據庫 – Java 注解配置示例
- Spring Cloud
- 微服務 – 定義,原理和優勢
- 服務監控 – Hystrix,Eureka 管理員和 Spring Boot 管理員
- Hoverfly – 微服務虛擬化示例
- ELK 堆棧示例教程
- Docker 的 Hello World 示例
- 集成 Git 的 Spring Cloud Config Server
- 使用 Netflix Eureka 進行 Spring Cloud 服務發現
- Consul 服務注冊和發現示例
- Hystrix 斷路器模式 – SpringCloud
- 如何將 Spring Boot 應用程序部署到 Cloud Foundry 平臺
- Netflix Zuul 示例 – Zuul API 網關模式 – Spring Cloud 教程
- Spring Cloud Zipkin 和 Sleuth 示例
- Spring cloud ribbon 和 Eureka – 客戶端負載均衡器示例
- Spring AOP
- Spring AOP 教程示例
- Spring AOP – AspectJ 注解配置示例
- Spring AOP + AspectJ XML 配置示例
- Spring AOP AspectJ @Before注解示例
- Spring AOP AspectJ @After注解示例
- Spring AOP AspectJ @Around注解示例
- Spring AOP AspectJ @AfterReturning注解示例
- Spring AOP AspectJ @AfterThrowing示例
- Spring AOP 事前建議示例
- Spring AOP 事后建議示例
- Spring AOP 圍繞建議示例
- Spring AOP 返回后建議示例
- Spring AOP 拋出后建議示例
- Spring AOP AspectJ 切入點表達式示例
- Spring AOP – 切面順序
- 帶有加載時織入的非公開方法上的 Spring 事務
- Spring 熱門 AOP 面試問題及答案
- Spring MVC
- Spring MVC 教程
- Spring MVC Hello World 示例
- 使用 Maven 和 JSTL 的 Spring MVC Hello World 示例
- Spring @RequestMapping注解示例
- Spring MVC 自定義驗證器示例
- Spring Bean 驗證 – JSR-303 注解
- Spring MVC 填充和驗證下拉列表示例
- Spring MVC 示例 – 顯示,驗證和提交表單
- Spring MessageSourceAware Java Bean 示例
- Spring MVC XmlViewResolver配置示例
- Spring MVC 國際化(i18n)和本地化(i10n)示例
- Spring MVC 攔截器示例 – XML 和 Java 注解配置
- Spring HandlerInterceptor示例
- Spring MVC 在 ajax 和 jquery 中使用進度條上傳多個文件
- Spring MVC 多文件上傳示例
- Spring MVC 下載文件控制器示例
- Spring MVC 面試問題與答案
- Spring MVC InternalResourceViewResolver配置示例
- Spring MVC ResourceBundleViewResolver配置示例
- Spring MVC SimpleMappingExceptionResolver示例
- Spring MVC:<context:annotation-config>與<context:component-scan>
- ContextLoaderListener與DispatcherServlet
- SpringSecurity
- SpringSecurity 教程
- 具有保護切入點的 Spring 方法安全性
- Spring Security Siteminder 預身份驗證示例
- Spring Security 登錄表單示例
- 使用 JSP Taglibs 的 Spring 視圖層安全
- Spring Security – JDBC 用戶服務示例
- Spring Security UserDetailsS??ervice示例
- Spring Security 基本身份驗證示例
- 使用 JUnit 測試 Spring Security Auth
- 使用@PreAuthorize和@Secured的 Spring 方法安全性
- Spring ORM
- Spring 3.2.5 AbstractRoutingDataSource示例
- Spring 3 和 Hibernate 4 集成示例教程
- Spring Hibernate 集成示例
- Spring REST
- Spring REST JSON 響應示例
- Spring REST XML 響應示例
- Spring REST 控制器示例
- 使用 JPA 配置的 Spring REST CRUD 示例
- Spring REST 異常處理示例
- Spring REST 請求主體和參數驗證示例
- Spring REST 自定義令牌認證示例
- Spring REST – 多部分上傳和下載示例
- Spring REST Multipart – 多部分上傳示例
- Spring REST – HTTP OPTIONS 請求處理器示例
- Spring REST – 訪問被拒絕請求的 JSON 響應
- Spring RestTemplate – Spring REST 客戶端示例
- Spring WebFlux
- Spring WebFlux 教程
- Spring Boot WebFlux WebSocket 示例
- 使用@WebFluxTest和WebTestClient進行 Spring Boot Webflux 測試
- HowToDoInJava Java 教程
- 核心 Java 教程
- 什么是 Java 編程語言?
- 什么是 Java JDK,JRE 和 JVM – 深入分析
- Java 命名約定
- Java 類路徑
- Java 變量
- Java 運算符指南
- Java 關鍵字
- Java 中的數據類型
- Java 中的原始數據類型
- Java 包裝器類 – 自動裝箱,拆箱和轉換示例
- Java 中的語句類型
- Java 控制流語句
- Java 中的標簽語句
- Java 字符串類指南
- Java 創建類 – 如何創建對象?
- 如何在 Java 中創建不可變的類
- Java main()方法
- Java 注釋
- Java 按值傳遞與按引用傳遞
- Java 系統屬性
- Java 靜態 – 變量,方法,塊,類和導入語句
- Java 中的靜態導入語句
- Java hashCode()和equals() – 契約,規則和最佳實踐
- Java this和super之間的區別
- 32 位 Java 與 64 位 Java 之間的區別
- java.exe和javaw.exe之間的區別
- Java 查看/生成類文件的字節碼
- Java 中的小端和大端
- Java 命令行參數
- 在 Java 中比較浮點數或雙精度數的正確方法
- Java 遞歸指南
- Java 偶對
- Java 元組 – 使用 Java 中的元組
- sun.misc.Unsafe類的用法
- Java UUID 生成器示例
- Java 12 教程
- Java 12 – 新特性和增強特性
- 收集器teeing()方法示例
- 字符串indent(count) – Java 中的行左縮進
- 精簡數字格式
- Java 11 教程
- Java 11 的新特性和增強特性
- String.isBlank() – 在 Java 中檢查空白或空字符串
- String.lines() – 獲取行流 – Java 11
- String.repeat() – 在 Java 中重復字符串 N 次
- String.strip() – 刪除開頭和結尾的空格
- 文件readString() API – 將文件讀取為 Java 中的字符串
- 文件writeString() API – 用 Java 將字符串寫入文件
- Java 10 教程
- Java 10 特性和增強特性
- Java 版本 – 基于時間的發行版本控制
- Java var – 局部變量類型推斷
- Java 9 教程
- Java 9 特性和增強特性
- Java 9 – 精簡字符串改進 [JEP 254]
- Java 模塊教程
- Java 9 – JShell
- Java – 日期流
- Java 9 Stream API 的改進
- Java 9 中的不可變集合和工廠方法
- 接口中的私有方法 – Java 9
- Java 8 教程
- Java 8 教程
- Java 8 forEach
- Java 8 流 API
- Java 流裝箱示例
- Lambda 表達式
- Java 8 – 函數式接口
- Java 8 方法引用示例
- Java 默認方法教程
- Java 8 Optional:完整參考
- Java 謂詞示例 – 謂詞過濾器
- Java 8 – 日期和時間示例
- Java 8 列出目錄中的所有文件 – 六個示例
- Java 8 – 逐行讀取文件
- Java 8 寫入文件示例
- Java WatchService API 教程
- Java 8 解析字符串為日期
- Java 8 – 連接字符串數組 – 將數組轉換為字符串
- Java Base64 編碼和解碼示例
- Math 類中的 Java 精確算術運算支持
- Java 8 帶有 lambda 的Comparator示例
- 使用Pattern.compile()方法將 Java 正則表達式作為謂詞
- Java 字符串連接(CSV)示例
- Java 8 兩個日期之間的差異
- Java – 內部與外部迭代
- Java 中的安全隨機數生成
- Java 7 教程
- Java 7 的更改,特性和增強
- Java 菱形運算符 – Java 中的<>運算符
- 帶字符串的 Java switch case
- Java 7 中的try-with-resources
- Java 7 中數字字面值的下劃線
- Java 抑制異常示例
- Java 7 – 異常處理增強
- Fork/Join 框架教程:ForkJoinPool示例
- 自動重新加載屬性的 Java WatchService示例
- 面向對象原則
- Java OOP 概念 – 面向對象的原則
- Java 訪問修飾符
- Java 構造器
- Java 實例初始化器塊
- Java 中的抽象示例
- Java 封裝與抽象
- Java 繼承
- Java 多態示例
- Java 方法重載與方法重載
- 接口與 Java 中的抽象類
- Java extends與implements關鍵字
- Java instanceof運算符
- Java 中的多重繼承
- 關聯,聚合和組合
- Java 并發指南
- Java 并發教程
- Java 多線程的發展和主題
- Java 并發性 – 線程安全性?
- 并發與并行
- Java 比較和交換示例 – CAS 算法
- Java synchronized關鍵字
- Java 中的對象級別鎖與類級別鎖
- Java 中Runnable與Thread之間的區別
- 如何在 Java 中使用wait(),notify()和notifyAll()?
- Java 并發性 – yield()和join()之間的區別
- Java 中 sleep()和wait()之間的區別
- 鎖和監視器之間的區別 – Java 并發
- Java Callable Future示例
- 如何使用UncaughtExceptionHandler重新啟動線程
- 使用ThreadPoolExecutor和Semaphore限制任務提交率
- Java 執行器框架教程和最佳實踐
- Java 線程間通信 – PipedReader和PipedWriter
- Java 死鎖示例和解決方案
- Java 集合
- Java 中的集合
- Java 中的數組
- Java ArrayList指南
- Java LinkedList類
- Java HashMap指南
- Java Hashtable類
- Java LinkedHashMap類
- Java TreeMap類
- Java HashSet類
- Java LinkedHashSet類
- Java TreeSet類
- Java Comparable接口示例
- Java Comparator接口示例
- Java Iterator接口示例
- Java ListIterator接口
- Java Spliterator接口
- Java PriorityQueue類
- Java PriorityBlockingQueue類
- Java ArrayBlockingQueue類
- Java TransferQueue – Java LinkedTransferQueue類
- Java CopyOnWriteArrayList類
- Java CopyOnWriteArraySet類
- 如何在 Java 中對數組,列表,映射和集合進行排序
- Java 面試的 40 個熱門問答集
- Java IO 教程
- Java IO 教程和示例
- Java I/O 如何在較低級別上內部工作?
- Java 標準 IO 與 Java NIO
- 如何在 Java 中復制目錄
- 用 Java 遞歸刪除目錄
- Java – 創建新文件
- Java – 寫入文件
- Java – 附加到文件
- Java 創建只讀文件示例
- Java 將文件讀取為字符串(已針對 Java 8 更新)
- Java 將文件讀取到byte[]數組
- Java – 逐行讀取文件 – LineNumberReader
- Java BufferedReader示例
- Java – BufferedWriter
- Java 讀寫屬性文件示例
- 從資源文件夾讀取文件 – Spring 示例
- Java – 讀寫 UTF-8 編碼數據
- Java 中如何檢查文件是否存在
- Java 文件復制 – 用 Java 復制文件的 4 種方法
- Java FilenameFilter示例 – 查找/刪除某些擴展名的文件
- Java FileFilter示例
- Java – 創建臨時文件
- Java – 寫入臨時文件
- Java – 刪除臨時文件
- Java – 讀取控制臺輸入
- Java – 使用Scanner類讀取類型安全輸入
- 在 Java 中將字符串轉換為InputStream
- 在 Java 中將InputStream轉換為字符串
- Java – 創建受密碼保護的 Zip 文件
- Java – 解壓縮帶有子目錄的文件
- 使用 Java 在 Linux 中管理不超過 N GB 的系統日志文件
- 在 Java 中生成 SHA 或 MD5 文件校驗和哈希
- Java 日期時間教程
- Java – 日期和時間 API
- Java – 日期驗證
- Java – 日期格式
- Java LocalDate類
- Java LocalTime類
- Java LocalDateTime類
- Java ZonedDateTime類
- Java 8 – Period
- Java 8 DateTimeFormatter
- Java 8 – TemporalAdjusters
- Java 8 – TemporalQuery
- Java 8 – DayOfWeek
- Java 日期 – 解析,格式和轉換
- Java 語言環境 – 創建和設置默認語言環境
- Java 枚舉教程
- Java 枚舉
- 帶有字符串值的 Java 枚舉
- 枚舉真的是最好的單例嗎?
- 枚舉器和迭代器之間的區別?
- Java 異常
- Java try-finally塊
- Java throw關鍵字
- Java 受檢與非受檢的異常
- Java 同步和異步異常
- Java NullPointerException - 如何在 Java 中有效處理空指針
- Java 自定義異常 – 最佳實踐
- 構造器可以聲明初始化器塊中引發的受檢異常
- Java 泛型教程
- 完整的 Java 泛型教程
- Java 泛型 PECS - 生產者extends消費者super
- Java 垃圾回收
- Java 垃圾收集算法(直到 Java 9)
- JVM 內存模型/結構和組件
- Java 內存管理 – 垃圾回收算法
- Java 序列化教程
- Java 序列化 – 執行正確的序列化
- Java serialVersionUID – 如何生成serialVersionUID
- Java 外部化示例 – 更有效的序列化
- Java 中Externalizable與Serializable之間的區別
- 將 Java 對象序列化為 XML – XMLEncoder和XMLDecoder示例
- Java 中反序列化過程如何發生?
- 使用readObject和writeObject的 Java 自定義序列化
- 使用內存序列化的 Java 深層復制
- 字符串方法
- Java String.concat()方法示例
- Java String.hashCode()方法示例
- Java String.contains()方法示例
- Java String.compareTo()方法示例
- Java String.compareToIgnoreCase()方法示例
- Java String.equals()方法 – 字符串比較
- Java String.equalsIgnoreCase()方法 – 不區分大小寫的比較
- Java String.charAt()方法示例
- Java String.indexOf()方法示例
- Java String.lastIndexOf()方法示例
- Java String.intern()方法示例
- Java String.split()方法示例
- Java String.replace()方法示例
- Java String.replaceFirst()方法示例
- Java String.replaceAll()方法示例
- Java String.substring()方法示例
- Java String.startsWith()示例
- Java String.endsWith()方法示例
- Java String.toUpperCase()方法示例
- Java String.toLowerCase()方法示例
- Java 正則表達式教程
- Java 正則表達式教程
- Java 僅允許字母數字字符的正則表達式
- Java 正則表達式 – 信用卡號驗證
- Java 正則表達式 – 加拿大郵政編碼驗證
- 貨幣符號的 Java 正則表達式
- 使用 Java 正則表達式進行日期驗證
- 使用 Java 正則表達式進行電子郵件驗證
- Java 正則表達式密碼驗證示例
- 適用于希臘語擴展或希臘語腳本的 Java 正則表達式
- 驗證 ISBN(國際標準書號)的 Java 正則表達式
- 檢查輸入文本的最小/最大長度的 Java 正則表達式
- 限制文本中的行數的 Java 正則表達式
- 限制輸入中的單詞數的 Java 正則表達式
- 驗證 SSN(社會安全號碼)的 Java 正則表達式
- Java 正則表達式 – 英國郵政編碼驗證
- Java 正則表達式 – 美國郵政編碼驗證
- 驗證商標符號的 Java 正則表達式
- 驗證國際電話號碼的 Java 正則表達式
- 北美電話號碼的 Java 正則表達式
- Java NIO 教程
- NIO 教程
- 如何創建路徑 – Java NIO
- 使用緩沖區 – Java NIO 2.0
- Java 通道教程 – NIO 2.0
- 3 種讀取文件的方法 – Java NIO
- Java 8 – 逐行讀取文件
- Java 內存映射文件 – Java MappedByteBuffer
- Java NIO – 分散/聚集或向量 IO
- 通道之間的數據傳輸 – Java NIO
- HowToDoInJava 其它教程
- Maven 教程
- 如何在 Windows 上安裝 Maven
- Maven – 設置文件
- Maven – 依賴管理
- Maven 依賴范圍
- Maven - POM 文件
- Maven – 父子 POM 示例
- Maven – 本地,遠程和中央倉庫
- Maven 本地倉庫位置以及如何更改?
- M2_REPO – 在 Eclipse 中更改 Maven 倉庫的位置
- Maven 代理設置 – Eclipse,命令行和全局設置
- Maven 強制最低 Java 版本
- Maven 創建 Java 項目 – 交互式與非交互式模式
- 在 Eclipse 中逐步創建 Maven Web 項目
- 多模塊 Maven 項目 – 控制臺
- Eclipse 中的 Maven 多模塊項目
- Maven – 創建 Java 源文件夾
- Maven BOM – 物料清單依賴項
- 在 Eclipse 中導入 Maven 遠程原型目錄
- Eclipse 項目中的 Maven 自定義原型
- 已解決:Java 編譯器級別與已安裝的 Java 項目方面的版本不匹配
- Maven ant 插件 – 從pom.xml生成build.xml
- Maven IntelliJ IDEA 項目
- Spring MVC JSTL 配置示例
- Tomcat Maven 插件示例
- Maven – Spring Boot 胖/Uber Jar
- Maven Shade 插件 – UberJar/胖 Jar 示例
- Maven – 刪除所有損壞的 jar/依賴項
- Gradle 教程 – 安裝和 HelloWorld 示例
- Log4j2 教程
- Log4j2 JSON 配置示例
- Log4j2 屬性文件示例
- Log4j2 xml 配置示例
- Log4j2 RollingFileAppender示例
- Log4j2 多個附加器示例
- Log4j2 LevelRangeFilter示例
- Log4j2 HTMLLayout配置示例
- Log4j2 ThreadContext – 相同事務的魚標日志
- Log4j2 – 有用的轉換模式示例
- 為 JUnit 測試用例配置 Log4j2
- Log4j 教程
- log4j.properties示例 – Log4j 屬性文件示例
- log4j.xml示例 – Log4j xml 配置示例
- Log4j Maven 配置示例
- Log4j 日志級別 – Log4j2 日志級別示例
- Log4j ConsoleAppender配置示例
- Log4jRollingFileAppender配置示例
- Log4j SocketAppender和套接字服務器示例
- Log4j JDBCAppender – 在數據庫中創建日志
- Log4j XMLLayout – 以 XML 格式創建日志
- Log4j HTMLLayout – 以 HTML 格式創建日志
- Log4j – 在運行時重新加載日志記錄級別
- SLF4j 與 Log4j – 哪個更好?
- RESTEasy + Tomcat 7 + Log4j 日志記錄示例
- Dropwizard 教程
- Dropwizard 教程
- Dropwizard 教程 – HelloWorld 示例
- Dropwizard – BasicAuth 安全示例
- Dropwizard 運行狀況檢查配置示例
- Dropwizard 客戶端 – Jersey/HTTP 配置和示例
- [已解決] Dropwizard – 無法解析配置(無法將類型 ID “http”解析為子類型)
- RESTEasy 教程
- JAX-RS 2.0 教程
- RESTEasy + JBOSS 7 HelloWorld 應用
- 面向初學者的 RESTEasy 示例教程
- JAX-RS @Path URI 匹配 – 靜態和正則 URI
- Java REST HATEOAS 示例
- RESTEasy + Tomcat 7 + SLF4J 日志示例
- RESTEasy + Tomcat 7 + Log4j 記錄示例
- RESTEasy - 文件下載示例
- RESTEasy 文件上傳 - HTML 表單示例
- RESTEasy 文件上傳 - HttpClient示例
- 使用 Ajax 的 JAX-RS 自定義驗證示例
- 使用 Hibernate 驗證器供應器進行 RESTEasy Bean 驗證
- RESTEasy ContainerRequestFilter - RESTEasy 安全過濾器示例
- RESTEasy 基本認證和授權教程
- RESTEasy JAXB XML 示例
- RESTEasy Jettison JSON 示例
- Jackson 的 RESTEasy JSON 示例
- RESTEasy ExceptionMapper – 異常處理示例
- RESTEasy 客戶端 API
- 使用java.net包的 RESTful 客戶端
- 使用 RESTful API 的 RESTEasy 客戶端
- Apache HttpClient GET 和 POST 示例
- RESTEasy Javascript/Ajax 客戶端演示
- JAX-RS 2.0 RESTEasy 3.0.2.Final 客戶端 API 示例
- RESTEasy 最佳實踐
- RESTEasy - 與ResteasyProviderFactory共享上下文數據
- RESTEasy ExceptionMapper – 異常處理示例
- 使用 ETag 的 RESTEasy 緩存控制示例
- RESTEasy – 啟用 Gzip 壓縮內容編碼
- 比較 SOAP 與 RESTful Web 服務
- Jersey 教程
- Jersey HelloWorld 例子
- Jersey2 HelloWorld 示例 – Jersey2 教程
- jersey-quickstart-webapp HelloWorld 示例
- Jersey 使用過濾器記錄請求和響應實體
- Jersey - 如何在 REST API 響應中設置 Cookie
- Jersey 文件下載示例 – StreamingOutput
- Jersey 文件上傳示例 – Jersey2 MultiPartFeature
- Jersey - Ajax 多文件上傳示例
- Jersey 異常處理 – Jersey ExceptionMapper示例
- Jersey + MOXy JSON 示例
- Jersey + JSONP 示例
- Jersey + Google Gson 示例
- Jersey REST API 安全示例
- Jersey 客戶端
- Jersey 客戶端示例 – Jersey2 客戶端 API
- Jersey REST 客戶端認證示例
- Jersey 客戶端 - 設置 Cookie 示例
- JDBC 教程
- Java JDBC 教程
- Java – JDBC 連接示例(MySQL)
- Java – JDBC 驅動類型
- JDBC SELECT查詢示例
- JDBC SQL INSERT查詢示例
- JDBC SQL DELETE查詢示例
- Java JDBC PreparedStatement示例
- JDBC 性能優化技巧
- Hiberate 教程
- Hiberate 教程
- Hibernate 示例 – HelloWorld 示例逐步簡介
- Hibernate 獲取實體示例 – get與load方法
- Hibernate 插入查詢教程
- Hiberate 合并和刷新實體
- Hibernate 4 – 獲取延遲加載的實體引用
- 從數據庫中插入/選擇 Blob 的 Hiberate 示例
- Hiberate save()和saveOrUpdate()方法
- Hiberate 實體/持久化生命周期狀態
- Hibernate 4:如何構建SessionFactory
- Hiberate 實體等價和等同
- Hibernate JPA 級聯類型
- Hibernate 延遲加載教程
- Hiberate 條件查詢示例
- Hibernate HQL(Hiberate 查詢語言)示例
- Hibernate @NamedQuery教程
- Hibernate – 如何定義實體之間的關聯映射
- 通過示例了解 Hibernate 一級緩存
- Hiberate 二級緩存如何工作?
- Hibernate EhCache 配置教程
- Hibernate OSCache 配置示例教程
- Hibernate C3P0 連接池配置教程
- Hiberate 內存數據庫
- Hibernate 驗證器 – Java Bean 驗證示例
- Hibernate 驗證器 CDI – @HibernateValidator示例
- [已解決] UnexpectedTypeException - 找不到約束驗證器
- Hiberate 注解
- Hibernate / JPA2 持久化注解教程
- Hiberate 注解與映射 – 優缺點
- @Immutable和@NaturalId – 特定于 Hiberate 的注解
- Hibernate @NaturalId示例教程
- Hiberate 一對多映射注解示例
- Hiberate 多對多映射注解示例
- Hiberate 一對一映射注解示例
- JUnit5 教程
- JUnit5 教程
- JUnit5 測試生命周期
- JUnit5 @BeforeAll注解示例
- JUnit5 @BeforeEach注解示例
- JUnit5 @AfterEach注解示例
- JUnit5 @AfterAll注解示例
- JUnit5 @RepeatedTest注解示例
- JUnit5 @Disabled測試示例
- JUnit5 @Tag注解示例
- JUnit5 預期的異常 – assertThrows()示例
- JUnit5 斷言示例
- JUnit5 假設示例
- JUnit5 測試套件示例
- JUnit5 和 Gradle
- JUnit5 Maven 依賴項
- JUnit5 – 在 Eclipse 中執行測試
- Eclipse 的 JUnit5 測試模板
- JUnit5 與 JUnit4
- JUnit4 教程
- JUnit 教程
- JUnit 測試套件示例
- JUnit JUnitCore示例
- 使用 Maven 執行 JUnit 測試用例
- JUnit4 – 基于假設的測試用例
- Junit 預期異常測試用例示例
- JUnit 測試監聽器– JUnit RunListener示例
- JUnit 測試超時 – JUnit5 超時示例
- JUnit 有序測試執行示例
- JUnit 參數化測試示例
- Junit 參數化測試 – @Theory和@DataPoints
- JUnit – 使用TemporaryFolder和@Rule創建臨時文件/文件夾
- TestNG 教程
- TestNG 教程
- TestNG 教程(使用 Eclipse)
- 如何從 Maven 運行testng.xml
- TestNG 注解教程
- TestNG – 預期異常和預期消息教程
- TestNG – 如何禁用/忽略測試方法
- TestNG 并行執行測試,類和套件
- TestNG – 依賴測試示例
- TestNG – 超時測試教程
- TestNG @Parameters – 測試參數示例
- TestNG @DataProvider – 測試參數示例
- TestNG @Factory注解教程
- TestNG – @Factory和@DataProvider之間的區別
- TestNG 的前后注解
- TestNG – 測試組,元組,默認組示例
- Mockito 教程
- Mockito2 教程 – JUnit Mockito 示例
- Mockito 注解– @Mock,@Spy,@Captor,@InjectMock
- Mockito – @Mock和@InjectMock注解之間的區別
- Mockito – 驗證具有不同參數的多個方法調用
- Spring Boot,Mockito 和 Junit – 單元測試服務層
- [已解決] IllegalStateException:無法初始化插件MockMaker
- 使用 PowerMock 進行模擬測試(帶有 JUnit 和 Mockito)
- TypeScript 教程
- TypeScript 教程
- TypeScript 類型
- TypeScript 聯合類型
- 字符串字面值類型
- TypeScript 變量 – var,let和const
- TypeScript 模板字符串
- TypeScript 算術運算符
- TypeScript 邏輯運算符
- TypeScript 比較運算符
- TypeScript for…of循環
- TypeScript 中的展開運算符
- TypeScript 中的數組
- TypeScript 中的枚舉
- TypeScript 映射
- TypeScript 集合
- TypeScript 函數 – 剩余,可選和默認參數
- TypeScript 函數或方法重載
- 轉譯器(Transpiler)與編譯器
- JavaScript 中的真值和假值
- 相等運算符(==)與嚴格相等運算符(===)
- JavaScript 中的undefined vs null
- JavaScript 變量提升
- tsconfig.json – TypeScript 編譯器配置
- Angular(2.x)教程
- Angular 開發工作區設置
- [已解決] Npm 安裝掛起或時間過長
- 模擬 REST 服務器來偽造在線 API
- Angular 插值
- Angular 組件
- Angular 模板和視圖
- Angular 服務示例
- 帶有 RxJS Observable的 Angular HttpClient示例
- AngularJS(1.x)教程
- AngularJS 教程 – HelloWorld 示例
- AngularJS – jQueryLite(jqLit??e)教程
- AngularJS 服務(內置和自定義)
- AngularJS Spring MVC Rest 示例
- JavaScript / jQuery 教程
- Ajax 教程 – 面向初學者的 Ajax 指南
- 完整的 jQuery Ajax($.ajax)教程
- jQuery 深度克隆示例
- jQuery 選擇器 – 完整列表
- jQuery – 所有選擇器(“*”) – 通用選擇器
- jQuery – 檢測剪切,復制或粘貼事件
- jQuery 檢測ENTER鍵按下事件
- jQuery – Keypress和Keydown事件之間的區別
- 關于 StackOverflow 的最佳 jQuery 討論
- JavaScript – 相等(==)與身份(===)運算符
- 您必須知道的 JavaScript 變量范圍規則
- JavaScript:定義全局變量的正確方法
- 在 JavaScript 中實現 MVC 和 PubSub
- JavaScript DOM 對象與 jQuery 對象
- Jasmine 單元測試教程及示例
- JavaScript 日志 – 在 JSON 中屏蔽敏感信息
- Android 教程
- Android 教程:關鍵概念
- Android 教程:在 Windows 上安裝 Android
- Android 教程:如何創建 Android 應用/項目
- Android 教程:Android 項目結構,文件和資源
- Android 清單:指定 Android 應用和 SDK 版本
- 如何加快緩慢的 Android AVD / 模擬器
- Hadoop 教程
- Hadoop – 大數據教程
- Hadoop MapReduce 初學者教程
- HDFS – Hadoop 分布式文件系統架構教程
- Brewer 的 CAP 定理簡述
- Java 云開發簡介和工具
- MongoDB 教程
- MongoDB 簡介:為什么選擇 MongoDB?
- 如何在 Windows 上安裝 MongoDB
- Java MongoDB:使用 GridFS API 獲取/保存圖像
- Java MongoDB:在集合中插入文檔的示例
- MongoDB 查找文檔示例
- 微服務 – 定義,原理和好處
- Apache Kafka 教程
- Apache Kafka – 簡介
- Apache Kafka – Windows 10 入門
- Kafka 的 Spring Boot – HelloWorld 示例
- Spring Boot Kafka JsonSerializer示例
- JMS 教程
- JMS 教程 – Java 消息服務教程
- JMS 點對點消息示例
- JMS 發布/訂閱消息示例
- HornetQ 教程
- HornetQ 單體 – 基本的 JMS 消息傳遞示例
- 使用 Maven 的 HornetQ 獨立服務器示例
- Spring3 Hornetq 獨立集成示例
- Gson 教程
- Gson 教程
- Gson 安裝
- GSON – 序列化和反序列化 JSON
- Gson – JSON 輸出的精美打印
- GSON – 將 JSON 數組解析為 Java 數組或列表
- GSON – 序列化和反序列化 JSON 為集
- Gson – 序列化和反序列化包含自定義對象的HashMap
- Gson – GsonBuilder配置示例
- Gson - 序列化NULL值
- Gson @Since – 版本支持
- Gson @SerializedName
- Gson – 排除或忽略字段
- Gson - JsonReader
- Gson - JsonParser
- Gson – 自定義序列化和反序列化
- Gson – 快速指南
- JAXB 教程
- JAXB 注解
- JAXB @XmlRootElement注解示例
- JAXB @XmlElementWrapper注解示例
- JAXB Marshaller(編組器)示例
- JAXB Unmarshaller(解組器)示例
- JAXB 讀取 XML 到 Java 對象的示例
- 使用 Moxy 和 Jaxb 將 JSON 轉換為 Java 對象的示例
- JAXB 將 Java 對象寫入 XML 的示例
- JAXB 將對象轉換為 JSON 的示例
- JAXB – 在 Java 中編組和解組HashMap
- JAXB – 編組和解組對象列表或集合
- 使用 Eclipse 從 JAXB Java 類生成 XSD
- JAXB 模式驗證
- [已解決]:javax.xml.bind.JAXBException:java.util.ArrayList或其任何超類不是此上下文的已知類
- [已解決]:線程“main”com.sun.xml.internal.bind.v2.runtime.IllegalAnnotationsException中的異常:3 個IllegalAnnotationExceptions計數
- 沒有@XmlRootElement的 JAXB 編組 – 缺少@XmlRootElement錯誤
- 不帶 jaxb 注解的解組
- Jackson 教程
- Jackson2 – 將 Java 對象轉換為 JSON,并將 JSON 字符串轉換為對象
- Jackson 將對象轉換為 json 并將 json 轉換為對象
- Jackson – 將 JSON 轉換為Map并將Map轉換為 JSON
- Java XML 教程
- Java 讀取 XML – Java DOM 解析器示例
- Java SAX 解析器 – XML 讀取示例
- Java JDOM2 – XML 讀取示例
- 使用 Java StAX 解析器讀取 XML – 游標和迭代器 API
- DOM 與 Java 中的 SAX 解析器
- Java 將 XML 轉換為屬性 – 從 XML 文件讀取屬性
- Java 將屬性文件轉換為 XML 文件
- Java 字符串到 XML – 將字符串解析為 XML DOM 的示例
- Java XML 轉換為字符串 – 將 XML 對象寫入文件的示例
- Java XPath 示例 – XPath 教程
- Java xpath 示例 – 在 xml 文件上求值 xpath
- Java8 xpath 示例 – 在字符串上求值 xpath
- Java XPath 表達式示例
- Java XPath NamespaceContext – 命名空間解析示例
- Java XPath 從 XML 獲取屬性值
- 在 Java 中使用 xpath 查找具有屬性值的 xml 元素
- Java XPath – 檢查節點或屬性是否存在?
- Eclipse 教程
- 在 Eclipse 中導入 Maven 遠程原型目錄
- 使用 Eclipse 快速搜索插件進行更快的文本搜索
- 如何在 Eclipse 中顯示非英文 unicode(例如中文)字符
- 如何在 Eclipse 中增加控制臺輸出限制
- 創建 Eclipse 模板以加快 Java 編程
- 在 5 分鐘內使 Eclipse 更快
- 如何在印地語中編譯和運行 Java 程序
- Java 覆蓋最終靜態方法 – 方法是覆蓋還是隱藏?
- [已解決] 在 Eclipse 的 Java 構建路徑中找不到超類“javax.servlet.http.HttpServlet”
- 版本控制系統教程
- 分布式版本控制系統如何工作?
- 版本控制系統(VCS)如何工作?
- 如何從 Google Code 項目中簽出源代碼
- Tomcat 教程
- Tomcat – 架構和server.xml配置
- 如何在默認的 HTTP 端口 80 中運行 tomcat
- Tomcat – 啟用/禁用目錄列表
- Tomcat SSL 或 HTTPS 配置示例
- 通過單個服務器安裝運行 Tomcat 的多個實例
- Tomcat Maven 插件示例
- Spring,Tomcat – 獲取負載均衡器后面的真實 IP
- Web 服務器如何工作?
- Linux 教程
- JStack 線程轉儲分析器
- 使用 Java 在 Linux 中管理系統日志文件不超過 N GB
- Swagger – Spring REST 示例
- GoF 設計模式
- 設計模式
- 創建型設計模式
- Java 單例模式介紹
- Java 中的構建器設計模式
- Java 工廠模式說明
- 抽象工廠模式解釋
- Java 中的原型設計模式
- 行為型設計模式
- 責任鏈設計模式
- 命令設計模式
- 迭代器設計模式
- 中介者設計模式
- 備忘錄設計模式
- 觀察者設計模式
- 狀態設計模式
- 策略設計模式
- 模板方法設計模式
- 訪問者設計模式示例
- 結構型設計模式
- Java 中的適配器設計模式
- 橋接設計模式
- 組合設計模式
- Java 中的裝飾器設計模式
- 外觀設計模式
- 享元設計模式
- 代理設計模式
- 設計原則
- Java 中的 SOLID 原則(含示例)
- 開閉原則
- 單一責任原則
- Java 最佳實踐
- Java 最佳實踐指南
- 編寫好的單元測試的 FIRST 原則
- 您應該如何對 DAO 層進行單元測試
- JUnit 最佳實踐指南
- 不良單元測試用例的 8 個跡象
- 20 個 Java 異常處理最佳實踐
- 13 個編寫 Spring 配置文件的最佳實踐
- Java Web 應用性能改進技巧
- Java 算法
- Java 算法和實現
- 冒泡排序 Java 示例
- 插入排序 Java 示例
- 歸并排序 Java 示例
- 快速排序 Java 示例
- 選擇排序 Java 示例
- Java AES 加密解密示例
- 使用 Soundex 算法實現語音搜索
- Java 比較和交換示例 – CAS 算法
- Python 教程
- Python 教程
- 如何在 Sublime 編輯器中安裝 Python 包
- Python – 注釋
- Python – 變量
- Python – 數據類型
- Python – 關鍵字
- Python – 字符串
- Python – 列表
- Python – 元組
- Python max()和min()– 在列表或數組中查找最大值和最小值
- Python 找到 N 個最大的或最小的項目
- Python 讀寫 CSV 文件
- Python httplib2 – HTTP GET 和 POST 示例
- Python 將元組解包為變量或參數
- Python 解包元組 – 太多值無法解包
- Python 多重字典示例 – 將單個鍵映射到字典中的多個值
- Python OrderedDict – 有序字典
- Python 字典交集 – 比較兩個字典
- Python 優先級隊列示例
- RxJava 教程
- 完整的 Java Servlet 教程
- vaadin 教程
- 使用 Maven 的 vaadin HelloWorld Web 應用
- Vaadin ComboBox示例
- vaadin 文本字段示例
- Vaadin Spring Security BasicAuth 示例
- SQL 教程
- SQL – 不使用臨時表刪除重復行
- 查找員工的第 N 高薪的 SQL 查詢
- SQLException:用戶root@localhost的訪問被拒絕
- Struts2 教程
- Struts2 HelloWorld 示例
- Struts2 HelloWorld 注解示例
- 使用@InterceptorRef的 Struts2 自定義攔截器示例
- Struts2 – 如何正確設置結果路徑
- Spring4 + Struts2 + Hibernate 集成教程
- [已解決] 無法找到ref-name引用的攔截器類
- [已解決]:找不到擴展名properties或xml的結果類型
- 數據結構教程
- 使用數組的 Java 棧實現
- Java 中的自定義列表實現示例
- HTML5 教程
- HTML5 – <section>標簽示例
- HTML5 字符集 – 字符編碼聲明
- HTML5 DOCTYPE聲明示例
- Java 題目
- Java 面試題目與答案
- Java 中的無效代碼和無法訪問的代碼
- Java 字符串回文 – Java 數字回文示例
- 檢測LinkedList中的無限循環的示例
- 復合賦值運算符i += j與 Java 中的i = i + j不同
- Java 中的 HiLo 猜謎游戲
- Java 題目 – 查找所有重復的元素
- Java 題目 – TreeMap的放置操作
- 題目 – 返回所有字符串中的第 N 長字符串
- Java 題目:好的字符串 – 壞的字符串
- 題目 – 檢查字符串是否完整(包含所有字母)
- Java 中的反轉字符串 - 單詞反轉字符串
- 用 Java 計算階乘的 3 種方法
- Java 中的 FizzBu??zz 解決方案
- 從 Java 中的序列/數組中查找缺失的數字
- Java – 不使用“new”關鍵字創建對象
- 面試問題
- Java 面試問題
- Java 字符串面試問題與答案
- Java 核心面試問題 – 第 1 部分
- Java 核心面試問題 – 第 2 部分
- Java 核心面試問題 – 第 3 部分
- Java 面試的 40 個熱門問答集
- 中級開發人員的 Java 面試問題
- 針對 Oracle 企業管理器項目的實際 Java 面試問題
- HashMap和ConcurrentHashMap面試問題
- Java 版本和新特性