
# Seaborn 繪圖
> 原文: [https://pythonbasics.org/seaborn_barplot/](https://pythonbasics.org/seaborn_barplot/)
Seaborn 支持多種類型的條形圖。 我們將 Seaborn 與 Matplotlib 結合起來演示了幾個繪圖。
Seaborn 包含幾個數據集(titanic 和其他),但這只是一個演示。 您可以將任何類型的數據傳遞到繪圖。
## 條形圖示例
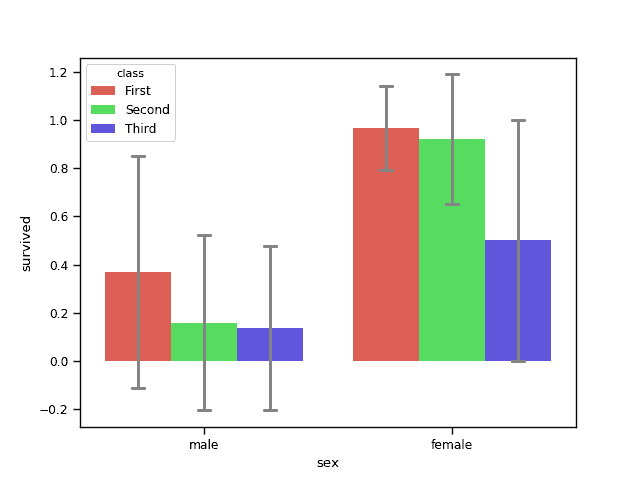
### 條形圖
用`barplot()`方法創建一個條形圖。 下面的條形圖根據類別顯示了泰坦尼克號撞車事故的幸存者。 您會看到這些條形圖隨著船沉沒而下降:)
調色板參數定義了要使用的顏色,當前使用的是`"hls"`,但可以使用任何調色板。
```py
import numpy as np
import pandas as pd
import matplotlib.pyplot as plt
import seaborn as sns
sns.set_context('paper')
# load dataset
titanic = sns.load_dataset('titanic')
print(titanic.head())
# create plot
sns.barplot(x = 'sex', y = 'survived', hue = 'class', data = titanic,
palette = 'hls',
order = ['male', 'female'],
capsize = 0.05,
saturation = 8,
errcolor = 'gray', errwidth = 2,
ci = 'sd'
)
print(titanic.groupby(['sex', 'class']).mean()['survived'])
print(titanic.groupby(['sex', 'class']).std()['survived'])
plt.show()
```
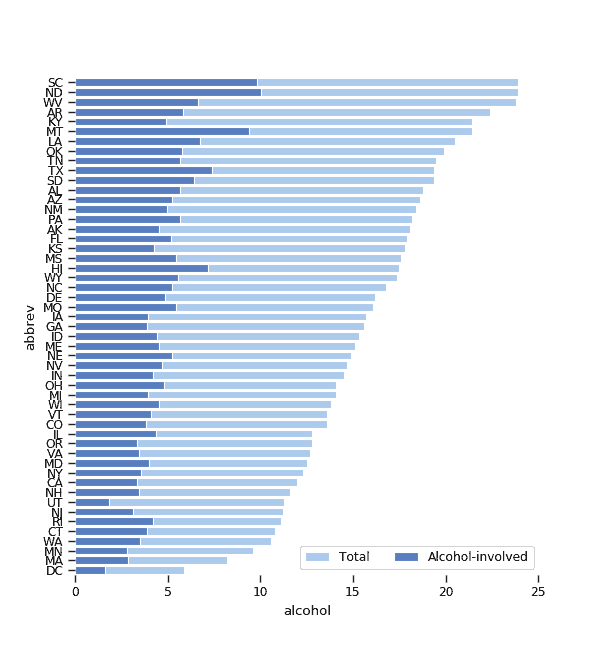
### 水平條形圖
該條形圖可以是使用`barplot()`方法的水平圖。 在下面的示例中,兩個條形圖是重疊的,顯示了百分比作為總崩潰的一部分。
```py
import numpy as np
import pandas as pd
import matplotlib.pyplot as plt
import seaborn as sns
sns.set_context('paper')
crashes = sns.load_dataset('car_crashes').sort_values('total', ascending = False)
f, ax = plt.subplots(figsize = (6,15))
sns.set_color_codes('pastel')
sns.barplot(x = 'total', y = 'abbrev', data = crashes,
label = 'Total', color = 'b', edgecolor = 'w')
sns.set_color_codes('muted')
sns.barplot(x = 'alcohol', y = 'abbrev', data = crashes,
label = 'Alcohol-involved', color = 'b', edgecolor = 'w')
ax.legend(ncol = 2, loc = 'lower right')
sns.despine(left = True, bottom = True)
plt.show()
```
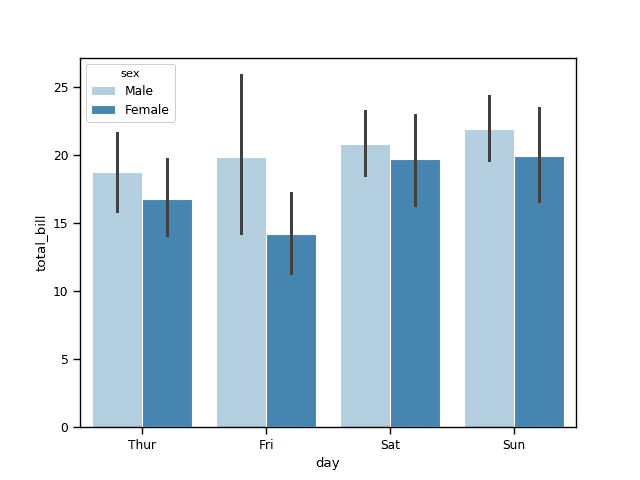
### 條形圖提示
下面的條形圖提示圖使用提示數據集。 它顯示了根據性別收到的提示數量。 它使用藍調調色板,該調色板具有藍色的變體。
```py
import numpy as np
import pandas as pd
import matplotlib.pyplot as plt
import seaborn as sns
sns.set_context('paper')
tips = sns.load_dataset('tips')
sns.barplot(x = 'day', y = 'total_bill', hue = 'sex', data = tips,
palette = 'Blues', edgecolor = 'w')
tips.groupby(['day','sex']).mean()
plt.show()
```
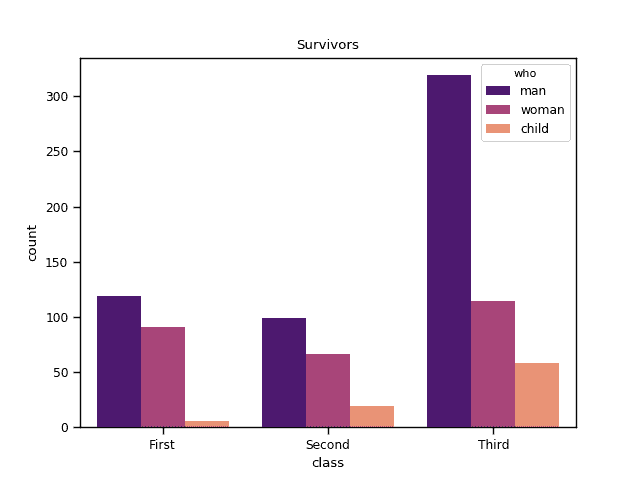
### 計數圖
可以將計數圖視為跨類別變量的直方圖。下面的示例演示了計數圖。
```py
import numpy as np
import pandas as pd
import matplotlib.pyplot as plt
import seaborn as sns
sns.set_context('paper')
# load dataset
titanic = sns.load_dataset('titanic')
print(titanic.head())
# create plot
sns.countplot(x = 'class', hue = 'who', data = titanic, palette = 'magma')
plt.title('Survivors')
plt.show()
```
- 介紹
- 學習 python 的 7 個理由
- 為什么 Python 很棒
- 學習 Python
- 入門
- 執行 Python 腳本
- 變量
- 字符串
- 字符串替換
- 字符串連接
- 字符串查找
- 分割
- 隨機數
- 鍵盤輸入
- 控制結構
- if語句
- for循環
- while循環
- 數據與操作
- 函數
- 列表
- 列表操作
- 排序列表
- range函數
- 字典
- 讀取文件
- 寫入文件
- 嵌套循環
- 切片
- 多個返回值
- 作用域
- 時間和日期
- try except
- 如何使用pip和 pypi
- 面向對象
- 類
- 構造函數
- 獲取器和設置器
- 模塊
- 繼承
- 靜態方法
- 可迭代對象
- Python 類方法
- 多重繼承
- 高級
- 虛擬環境
- 枚舉
- Pickle
- 正則表達式
- JSON 和 python
- python 讀取 json 文件
- 裝飾器
- 網絡服務器
- 音頻
- 用 Python 播放聲音
- python 文字轉語音
- 將 MP3 轉換為 WAV
- 轉錄音頻
- Tkinter
- Tkinter
- Tkinter 按鈕
- Tkinter 菜單
- Tkinter 標簽
- Tkinter 圖片
- Tkinter 畫布
- Tkinter 復選框
- Tkinter 輸入框
- Tkinter 文件對話框
- Tkinter 框架
- Tkinter 列表框
- Tkinter 消息框
- Tkinter 單選按鈕
- Tkinter 刻度
- 繪圖
- Matplotlib 條形圖
- Matplotlib 折線圖
- Seaborn 分布圖
- Seaborn 繪圖
- Seaborn 箱形圖
- Seaborn 熱力圖
- Seaborn 直線圖
- Seaborn 成對圖
- Seaborn 調色板
- Seaborn Pandas
- Seaborn 散點圖
- Plotly
- PyQt
- PyQt
- 安裝 PyQt
- PyQt Hello World
- PyQt 按鈕
- PyQt QMessageBox
- PyQt 網格
- QLineEdit
- PyQT QPixmap
- PyQt 組合框
- QCheckBox
- QSlider
- 進度條
- PyQt 表格
- QVBoxLayout
- PyQt 樣式
- 編譯 PyQt 到 EXE
- QDial
- QCheckBox
- PyQt 單選按鈕
- PyQt 分組框
- PyQt 工具提示
- PyQt 工具箱
- PyQt 工具欄
- PyQt 菜單欄
- PyQt 標簽小部件
- PyQt 自動補全
- PyQt 列表框
- PyQt 輸入對話框
- Qt Designer Python
- 機器學習
- 數據科學
- 如何從機器學習和 AI 認真地起步
- 為什么要使用 Python 進行機器學習?
- 機器學習庫
- 什么是機器學習?
- 區分機器學習,深度學習和 AI?
- 機器學習
- 機器學習算法比較
- 為什么要使用 Scikit-Learn?
- 如何在 Python 中加載機器學習數據
- 機器學習分類器
- 機器學習回歸
- Python 中的多項式回歸
- 決策樹
- k 最近鄰
- 訓練測試拆分
- 人臉檢測
- 如何為 scikit-learn 機器學習準備數據
- Selenium
- Selenium 瀏覽器
- Selenium Cookie
- Selenium 執行 JavaScript
- Selenium 按 ID 查找元素
- Selenium 無頭 Firefox
- Selenium Firefox
- Selenium 獲取 HTML
- Selenium 鍵盤
- Selenium 最大化
- Selenium 截圖
- Selenium 向下滾動
- Selenium 切換到窗口
- Selenium 等待頁面加載
- Flask 教程
- Flask 教程:Hello World
- Flask 教程:模板
- Flask 教程:路由