
[TOC]
## 概述
作為應用與Kubernetes的監控體系,Prometheus具備諸多的優勢,如:
* Kubernetes默認支持,非常適合容器和微服務
* 無依賴,安裝方便,上手容易
* 社區活躍,它不僅僅是個工具,而是生態
* 已有很多插件或者exporter,可以適應多種應用場景的數據收集需要
* Grafana默認支持,提供良好的可視化
* 高效,單一Prometheus可以處理百萬級的監控指標,每秒處理數十萬的數據點
在部署之前,先來了解一下Prometheus各個組件的作用吧!
* MertricServer:是k8s集群資源使用情況的聚合器,收集數據給K8s集群內使用,如:kubectl,hpa,scheduler
* PrometheusOperator:是一個系統檢測和警報工具箱,用來存儲監控數據;
* NodeExporter:用于各node的關鍵度量指標狀態數據;
* kubeStateMetrics:收集k8s集群內資源對象數據,指定告警規則;
* Prometheus:采用pull方式收集apiserver,scheduler,controller-manager,kubelet組件數據,通過http協議傳輸;
* Grafana:是可視化數據統計和監控平臺。
web管理部署一個就可以。如果安裝了其他web管理可以刪除
[https://github.com/prometheus/prometheus](https://github.com/prometheus/prometheus)
## 下載
**下載prometheus所需文件:**
```
鏈接: https://pan.baidu.com/s/12W5DGlVZqWYtMKVxgfR6GA 提取碼: 8uw8
或者
git clone https://github.com.cnpmjs.org/diycat1024/Prometheus-Grafana
```
### 在kubernetest集群中創建namespace
```
apiVersion: v1
kind: Namespace
metadata:
name: ns-monitor
labels:
name: ns-monitor
kubectl apply -f namespace.yaml
```
### 安裝node-exporter
在kubernetest集群中部署node-exporter,Node-exporter用于采集kubernetes集群中各個節點的物理指標,比如:Memory、CPU等。可以直接在每個物理節點是直接安裝,這里我們使用DaemonSet部署到每個節點上,使用 hostNetwork: true 和 hostPID: true 使其獲得Node的物理指標信息,配置tolerations使其在master節點也啟動一個pod。
```
kubectl apply -f node-exporter.yaml
```
檢驗node-exporter是否成功運行
```
[root@master1 ~]# kubectl get pod -n ns-monitor
NAME READY STATUS
grafana-677d945674-56m5n 1/1 Running
node-exporter-vkpt2 1/1 Running
node-exporter-zkh9s 1/1 Running
prometheus-6c9574d5ff-292bq 1/1 Running
[root@master1 ~]# kubectl get svc -n ns-monitor
NAME TYPE CLUSTER-IP EXTERNAL-IP PORT(S)
grafana-service NodePort 10.96.101.190 <none> 3000:32405/TCP
node-exporter-service NodePort 10.107.147.241 <none> 9100:31672/TCP
prometheus-service NodePort 10.97.249.230 <none> 9090:30437/TCP
瀏覽器訪問: http://主機ip:31672/metrics
```
[http://192.168.84.241:31672/metrics](http://192.168.84.241:31672/metrics)
## 安裝nsf server 參考最下面的解決辦法
搭建服務一條龍
```
sudo apt install nfs-kernel-server
```
```
sudo vim /etc/exports
/nfs/prometheus/data/ 192.168.84.75/24(rw,no_root_squash,no_all_squash,sync)
/nfs/grafana/data/ 192.168.84.75/24(rw,no_root_squash,no_all_squash,sync)
```
```
sudo mkdir -p /nfs/prometheus/data
sudo chmod -R 777 /nfs/prometheus/data/
sudo mkdir -p /nfs/grafana/data
sudo chmod -R 777 /nfs/grafana/data/
sudo exportfs -r
sudo systemctl start rpcbind
sudo systemctl status rpcbind
```
## 部署 Prometheus pod
prometheus.yaml 中包含rbac認證、ConfigMap等。
需要修改 PersistentVolume.server
```
apiVersion: v1
kind: PersistentVolume
metadata:
name: "prometheus-data-pv"
labels:
name: prometheus-data-pv
release: stable
spec:
capacity:
storage: 5Gi
accessModes:
- ReadWriteOnce
persistentVolumeReclaimPolicy: Recycle
nfs:
path: /nfs/prometheus/data
server: 192.168.84.75 # nsf server的ip
```
```
sudo kubectl apply -f prometheus.yaml
```
檢驗是否正常運行
```
[root@master1 ~]# sudo kubectl get pod -n ns-monitor
NAME READY STATUS
grafana-677d945674-56m5n 1/1 Running
node-exporter-vkpt2 1/1 Running
node-exporter-zkh9s 1/1 Running
prometheus-6c9574d5ff-292bq 1/1 Running
[root@master1 ~]# sudo kubectl get svc -n ns-monitor
NAME TYPE CLUSTER-IP EXTERNAL-IP PORT(S)
grafana-service NodePort 10.96.101.190 <none> 3000:32405/TCP
node-exporter-service NodePort 10.107.147.241 <none> 9100:31672/TCP
prometheus-service NodePort 10.97.249.230 <none> 9090:30437/TCP
```
如果是宿主機則可以訪問:http://10.97.249.230:9090
瀏覽器訪問: http://主機ip:30437/graph
## 在kubernetest中部署grafana
```
sudo kubectl apply -f grafana.yaml
```
檢驗是否正常運行
```
sudo kubectl get pod -n ns-monitor
NAME READY STATUS
grafana-677d945674-56m5n 1/1 Running
node-exporter-vkpt2 1/1 Running
node-exporter-zkh9s 1/1 Running
prometheus-6c9574d5ff-292bq 1/1 Running
sudo kubectl get svc -n ns-monitor
NAME TYPE CLUSTER-IP EXTERNAL-IP PORT(S)
grafana-service NodePort 10.96.101.190 <none> 3000:32405/TCP
node-exporter-service NodePort 10.107.147.241 <none> 9100:31672/TCP
prometheus-service NodePort 10.97.249.230 <none> 9090:30437/TCP
```
瀏覽器訪問: http://主機ip:32405/graph/login 默認用戶名和密碼:admin/admin
## grafana的配置
### 配置數據源
Grafana需要拉取prometheus的接口獲取數據,才能畫圖。
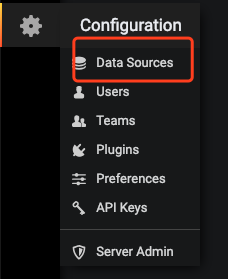
然后添加datasource:

選擇prometheus:

配置服務端地址,地址寫上面的 http://prometheus-service:9090(域名:9090), k8s的coreDNS會解析域名prometheus-service為對應的10.97.249.230地址 :

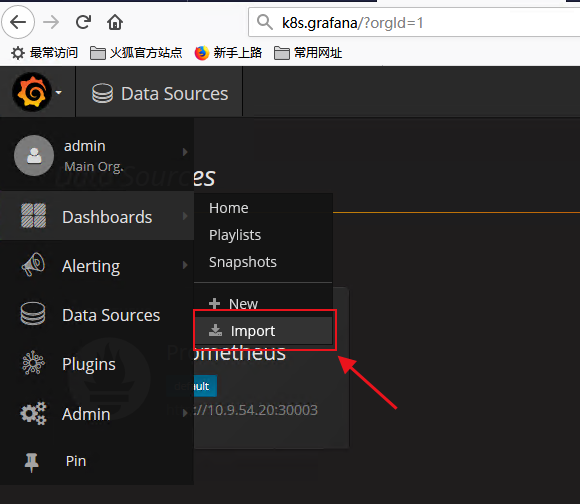
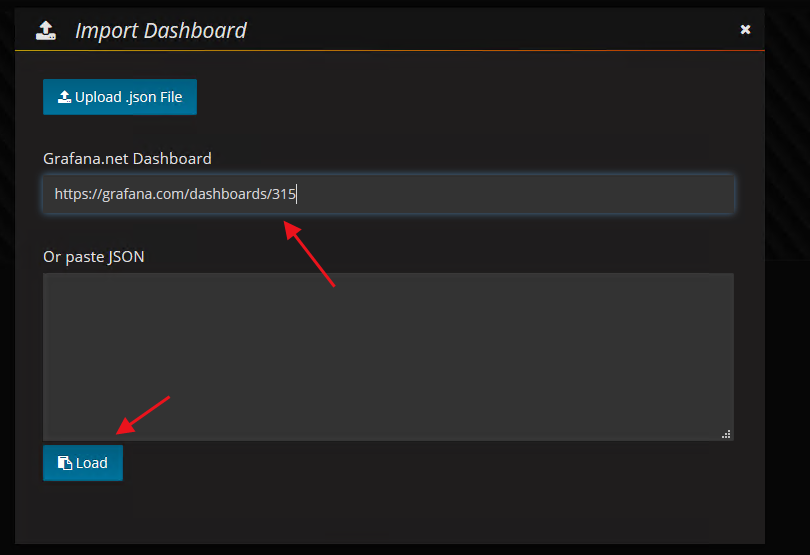
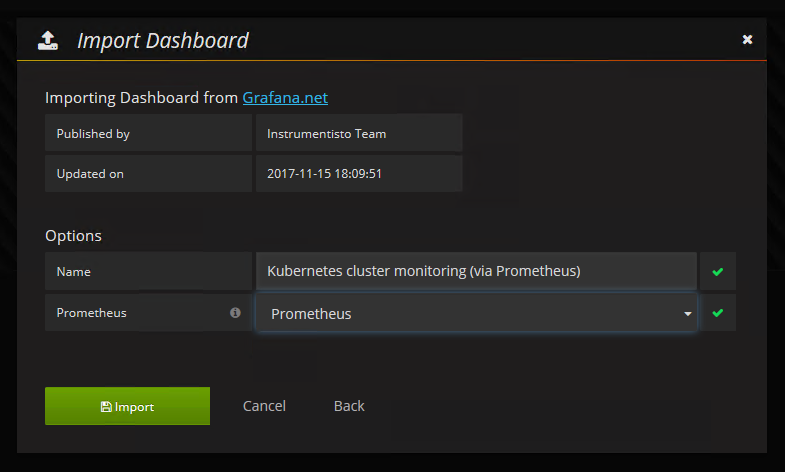
### 導入Dashboard模板
**這里使用的是kubernetes集群模板,模板編號315,在線導入地址https://grafana.com/dashboards/315**
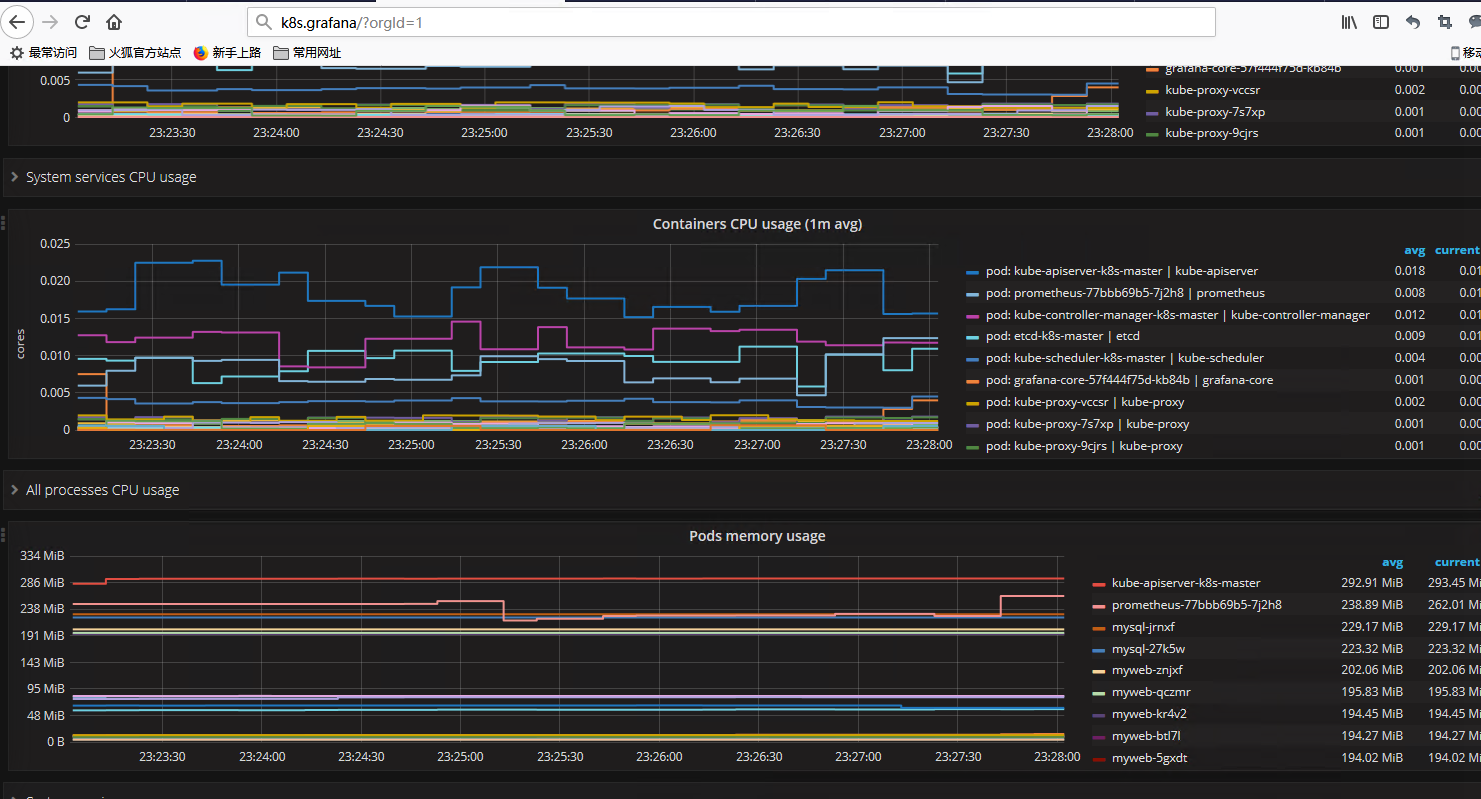
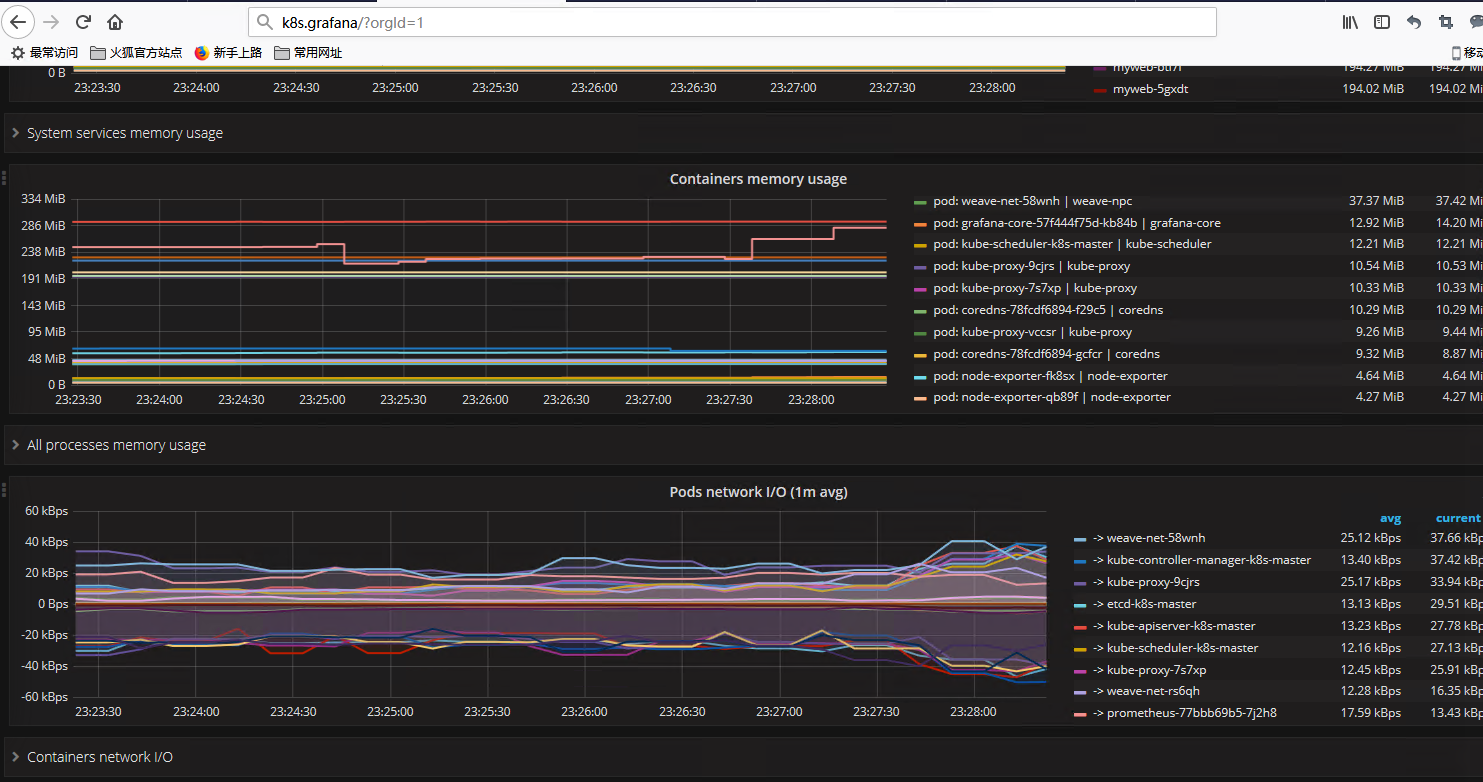
### **效果展示:**

## Kubernetes創建pod一直處于ContainerCreating排查和解決
通過 `sudo kubectl get pod -n ns-monitor`查看pod名字和狀態
查看 prometheus pod信息
```
sudo kubectl describe pod prometheus -n ns-monitor
mount: /var/lib/kubelet/pods/9b618933-87b6-496a-90da-25a4e9e782c3/volumes/kubernetes.io~nfs/prometheus-data-pv: bad option; for several filesystems (e.g. nfs, cifs) you might need a /sbin/mount.<type> helper program.
Warning FailedMount 18s kubelet, catrefine-virtual-machine MountVolume.SetUp failed for volume "prometheus-data-pv" : mount failed: exit status 32
```
## 解決辦法
搭建nsf服務
```
sudo apt install nfs-kernel-server
```
默認情況下,在Ubuntu 18.04上,NFS版本2是禁用的。版本3和版本4已啟用。您可以通過運行以下[`cat`](https://www.myfreax.com/linux-cat-command/)命令來驗證:
```
sudo cat /proc/fs/nfsd/versions
```
寫入 exports
```
cat /etc/exports
sudo echo /nfs/prometheus/data/ 192.168.84.75/24(rw,no_root_squash,no_all_squash,sync) >> /etc/exports
sudo echo /nfs/prometheus/data/ 192.168.84.75/24(rw,no_root_squash,no_all_squash,sync) >> /etc/exports
```
```
可以設定的參數主要有以下這些:
rw:可讀寫的權限;
ro:只讀的權限;
no_root_squash:登入到NFS主機的用戶如果是root,該用戶即擁有root權限;
root_squash:登入NFS主機的用戶如果是root,該用戶權限將被限定為匿名使用者nobody;
all_squash:不管登陸NFS主機的用戶是何權限都會被重新設定為匿名使用者nobody。
anonuid:將登入NFS主機的用戶都設定成指定的user id,此ID必須存在于/etc/passwd中。
anongid:同anonuid,但是變成group ID就是了!
sync:資料同步寫入存儲器中。
async:資料會先暫時存放在內存中,不會直接寫入硬盤。
insecure:允許從這臺機器過來的非授權訪問。
```
驗證配置的/nfs/prometheus/data/是否正確
```
sudo mkdir -p /nfs/prometheus/data
sudo chmod -R 777 /nfs/grafana/data/
sudo exportfs -r
```
啟動服務
```
sudo systemctl start rpcbind
sudo systemctl status rpcbind
```
主節點,子節點檢驗:
```
[root@szy-k8s-master /]# showmount -e 192.168.84.75
Export list for 192.168.84.75:
/nfs/prometheus/data 192.168.84.75/24
[root@szy-k8s-salve/]# showmount -e 192.168.84.75
Export list for 192.168.84.75:
/nfs/prometheus/data 192.168.84.75/24
```
```
NFS客戶端的操作:
1、showmout命令對于NFS的操作和查錯有很大的幫助,所以我們先來看一下showmount的用法
showmout
-a :這個參數是一般在NFS SERVER上使用,是用來顯示已經mount上本機nfs目錄的cline機器。
-e :顯示指定的NFS SERVER上export出來的目錄。
2、mount nfs目錄的方法:
mount -t nfs hostname(orIP):/directory /mount/point
```
- Unity3D
- Unity3D學習路線
- U3D基礎
- UGUI
- 數據結構和算法
- 算法時間復雜度
- 二叉樹
- B樹 & B+樹
- 紅黑樹
- 跳躍表
- Lecod算法題目
- C++-排序算法
- sort排序
- 冒泡排序
- 選擇排序
- 插入排序
- 快速排序
- 希爾排序
- 堆排序
- 歸并排序
- 遞歸算法
- LSMs和B tree
- mysql引擎
- 匯編程序
- 匯編入門 Hello World
- 匯編語言整數加減法
- 寄存器的使用和說明
- 匯編語言常用知識點
- 匯編語言中的幾個偽指令
- 匯編語言數據類型以及數據定義
- 匯編語言計算數組和字符串長度
- 匯編語言中寄存器加[]的意思
- 匯編語言中$符號的用法
- 匯編語言系統調用(System Calls)
- 匯編語言push和pop指令
- 匯編語言尋址操作
- 匯編語言進階
- GNUx86-64匯編
- C/C++調用匯編函數
- 用匯編理解C函數的調用過程和返回值
- 從匯編的角度看C++
- C/C++
- C++-編程入門
- C/C++環境搭建
- JsonCPP的使用
- 連接數據庫
- 連接mysql
- connector
- C API
- 連接sqlite3
- 使用sqlite3步驟
- 使用Clion
- thread-多線程
- 初識thread
- detach陷阱
- 事實
- 陷阱總結
- 剪切板操作
- 剪切板基本操作
- 剪切板詳細api
- 文件操作
- 桌面右鍵菜單批處理
- Resource Hacker
- 獲取指定輸入法
- 學習網站
- C++11中的匿名函數(lambda函數,lambda表達式)
- sleep和usleep的區別
- 使用std::unique_ptr 管理 FILE 指針
- typedef的用法
- strtuct中的char*和char數組
- 各個平臺不同類型占用字節數
- C++進階
- C++淺拷貝和深拷貝的區別
- C++類型強制轉換
- C++11寫的定時器
- C調用java函數
- C++11 特性
- 二進制兼容
- GDB的基礎命令
- GDB調試死鎖
- 核心底層代碼
- 線程池的實現
- 線程池的應用場景
- C++協程庫
- C++定時器原理
- 通信協議
- Socket5協議
- https 協議
- TCP-擁塞控制
- C++-STL
- map/unordered_map/hash_map區別
- 初始化vector
- STL算法
- Effective STL
- 條款5:盡量使用區間成員函數代替它們的單元素兄弟
- 條款9:在刪除選項中仔細選擇
- 條款13:盡量使用vector和string來代替動態分配的數組
- 條款14:使用reserve來避免不必要的重新分配
- 條款16: 如何將vector和string的數據傳給遺留的API
- 條款17:使用“交換技巧”來修整過剩容量
- 條款18:避免使用vector<bool>
- 條款30:確保目標區間足夠大
- 編輯器
- VS Code
- 配置C++
- 命令行編譯
- CMake
- CMake 升級
- cmake-基本操作
- 設置入口
- 修改vs運行時庫
- CMake生成sln
- CMake設置輸出目錄
- CMake添加GDB調試
- 使靜態庫和動態庫同時存在
- C/C++網絡編程
- 網絡基礎
- 5種網絡IO模型總結
- 條件變量
- 設置阻塞socket超時時間
- ccnet
- 一個reactor單線程庫
- ccnet從單線程轉變為多線程
- IO多路復用
- IO多路復用的理解
- EPOLL
- select示例代碼
- epoll 示例代碼
- iocp示例代碼
- muduo庫
- muduo編譯
- Libevent的簡單使用
- 編譯libevent
- Libevent幾個簡單的api
- Libevent 定時器
- Libevent通用的編程技法
- Libevent簡單的Server/Client
- Boost庫學習
- Boost庫編譯
- 利用Boost 實現線程池
- boost::asio
- boost::mutex
- Boost解析Json
- Boost.Asio的一些想法
- win32t網絡編程
- 簡單的c/s socket通信
- 回響
- 迭代服務器跟客戶端
- 進行類創建
- socket文件傳輸
- 簡單的udp
- Reactor模型與Proactor模型
- Actor和CSP模型
- 大量的timewait
- EPOLL的bug
- C++-界面
- MFC
- mfc小知識
- MFC呂鑫
- 初識mfc
- 初始化
- 消息映射
- 組合鍵 與(&)運算
- WIN32+MFC自定義消息
- 對話框的相關消息
- DestroyWindow
- GDI
- 初窺
- 坐標
- 創建畫筆
- CDC
- CPaintDC
- CPen
- CBursh
- CFont
- CBitmap
- LoadImage
- CMemDC
- 自適應
- 雙緩沖問題
- 閃爍問題
- 小型軟件開發
- 記事本
- 圖形架構軟件
- 提綱圖形
- 操作
- 重載關閉按鈕
- 自定義消息
- 自繪按鈕
- 自繪基礎知識
- 自繪按鈕提綱
- 步驟
- 自會下拉列表
- 自繪下拉列表
- 自繪菜單欄
- MFC函數類
- SetTimer
- 高級控件應用
- 高級控件開發提綱
- 菜單欄
- 網絡通信協議
- 提綱
- sizeof====strlen
- 堆 == 棧
- Socket
- 基本代碼
- UDP協議
- Win32
- 窗口操作
- 創建窗口,自定義按鈕
- 給按鈕加背景圖
- 給窗口加背景
- 貼圖
- DLL組件創建
- HOOK鉤子
- MinGW
- duilib
- 地址
- 屬性列表
- 第一個duilib項目
- DUI自帶的完整
- ListControl
- TreeView
- 重設窗口大小
- 計算DPI
- HandleMessage跟MessageHandle
- CEF
- cef環境搭建
- cefsimple簡單流程
- 優化CEF
- P2P
- stun搭建
- QT5
- QT5環境安裝
- QT信號與槽的概念
- QT工程CMakeLists.txt文件的編寫
- QT32位
- libShadowQT
- GoflywayQT
- 計劃
- Protocol Buffer
- ProtoBuf安裝
- 包管理器
- vcpkg
- conan
- xmake
- C++面試總結
- 基礎
- 分布式鎖
- C++重載、覆蓋與多態性
- 20道必須掌握道C++面試題
- 傳值、傳地址、傳引用總結
- 50道面試題 (1)
- 50道面試題 (2)
- 內聯函數的作用以及使用限制
- vector的resize用法
- 虛函數/虛表/虛基類
- 公司面試
- 面試:簡單算法題目
- 面試:GetMemory
- 2021-3/11號面試記錄(lihe)
- leetcode
- leetcode331-驗證二叉樹的前序序列化
- leetcode141. 環形鏈表
- C/C++程序員面試秘籍
- 鏈表
- 使用C/C++實現atoi和itoa函數
- mysql面試題
- 協程解析
- 協程解析一(ucontext解析)
- 協程解析二(云風的coroutine)
- 進程、線程、協程
- 自己制作一個協程庫
- C語言中兩個指針間的運算
- Windows中一些宏的含義
- C++書籍在線觀看
- 安裝TeamTalk
- Lua和C/C++互相調用
- android環境配置
- TCP/IP
- 三次握手四次揮手
- 有限狀態機
- 游戲開發
- UE4
- 開發一個fps的游戲
- 環境安裝,讓人物跑起來
- 增加血條和護甲
- 再生盔甲和傷害功能
- 最后一戰
- 最后一戰安裝部署
- 登錄流程 LS & BS & CS
- 最后一戰-游戲場景服務器SS
- 降臨
- 降臨安裝部署
- skynet
- skynet安裝部署
- lua-protobuc庫--skynet使用自定義protobuf
- pbc庫--skynet使用自定義protobuf
- 掃雷
- 仙劍奇俠傳
- 爐石傳說
- unity環境搭建
- 尋路算法
- 音視頻
- WebRTC
- webrtc源碼下載
- webrtc 編譯
- gn和ninja文件作用
- webrtc 源碼目錄結構
- WebRTC實時互動入門
- web 服務
- nodejs 搭建http服務
- nodejs 搭建https服務
- webrtc 獲取音視頻設備
- webrtc 音視頻采集
- webrtc 音視頻約束
- webrtc 瀏覽器視頻特效
- webrtc 從視頻中獲取圖片
- webrtc 只采集音頻數據
- webrtc MediaStream和獲取視頻約束
- webrtc 媒體流的錄制
- webrtc 捕獲桌面
- webrtc 信令服務器
- webrtc 傳輸基本知識
- webrtc NAT
- webrtc ICE
- webrtc 媒體能力協商
- webrtc 端到端鏈接的基本流程
- webrtc SDP
- webrtc STUN/TURN
- webrtc 客戶端信令消息
- webrtc 視頻通話實現
- webrtc 傳輸速率控制
- webrtc 統計信息
- webrtc IOS
- Kamailio
- webrtc的分析
- Webrtc音視頻會議之Mesh/MCU/SFU三種架構
- RTSP / RTP / RTCP協議
- RTMP / RTSP / WebRTC之間的關系
- webrtc源碼
- PeerConnection解析
- FFmpeg
- FFmpeg命令行的使用
- ffmpeg命令語法
- FFmpeg設備采集
- FFmpeg生成水印
- FFmpeg畫中畫和視頻多宮格
- FFmpeg定時截圖
- FFmpeg基本概念
- FFmpeg基本模塊
- ffmpeg 濾鏡處理
- ffmpeg流的指定
- FFmpeg相關api
- 基本函數
- 打印音視頻信息
- 抽取音視頻數據
- 捕捉攝像頭并推流
- FFmpeg拉流截圖
- vs2017編譯錯誤
- 自定義跨平臺FFmpeg播放器
- ffmpeg拉流并且使用qt
- ffmpeg讀取攝像頭并且推流
- ASS和SRT字幕有何區別
- 解決ffmpeg 在avformat_find_stream_info執行時間太長
- sws_getContext()處理AV_PIX_FMT_NONE 幀格式引起的core dump
- OWT系列
- owt-server
- owt-server 編譯運行
- owt-server模塊
- owt-client-javascript解析
- owt-client-android
- owt-android編譯運行
- owt-client-android系列分析
- owt-conference
- Licode
- licode安裝
- licode 系列
- basic example client
- basic example server
- 音視頻基礎概念
- 視頻播放中的碼率的概念
- 幀率
- nginx-rtmp 模塊搭建與使用
- RTMP分析
- RTMP規范
- RTMP流媒體播放過程
- 一段簡單的CMakeLists.txt
- Go
- Go Base
- Go 環境安裝
- mod
- Go 流程控制
- interface convert to string/int/float64
- Go mod拉取私有倉庫
- VSCode配置go環境
- Go 設置代理
- Viper讀取配置文件
- vim打造成go的ide
- Go 交叉編譯
- GO 簡單功能
- Golang發起http請求
- Go 定時任務
- websocket協議
- Golang的定時器
- JWT認證
- Google Protobuf 請求參數為空的案例
- Go文件下載
- Go 服務熱更新方案
- Go 靜態服務器
- gocolly的使用
- golang中獲取字符串長度的幾種方法
- hugo搭建靜態博客
- go利用reids實現分布式鎖
- Go 代理
- Go 簡單http代理
- Go SS代理流程
- Go AES加密和解密的三種模式實現(CBC/ECB/CFB)
- Go 負載均衡
- Go 標準庫
- reflect.Type和reflect.Value
- container & list & ring & heap
- Context
- http 請求
- Go base64
- Go struct <=> json
- Go切片合并
- Go 包的使用
- pprof包的使用
- Go Grpc
- ymal 配置文件
- 日志包 logrus / zap
- Go 命令行多指令操作
- Cobra/viper 命令行解析
- Go sync/atomic
- zap日志
- Go 進階
- Go sync.Mutex詳解
- 使用自定義頭和protobuf解決沾包問題
- 使用 build tag 來自定義構建配置
- 使用valgrind檢測程序是否內存泄露
- Go參數傳遞是值傳遞還是引用傳遞
- Go 切片/數組
- Channel的使用
- Go Interface詳解
- GO-IM系統
- IM架構
- Go搭建一個http服務器
- mattermost-server
- matter編譯部署
- mattermost配置
- matter詳解
- Goim
- Centrifugo
- Tinode
- cgo入門
- GO語言中使用C語言
- reflect.StringHeader和reflect.SliceHeader
- Cgo使用libevent庫實現一個定時器
- cgo遍歷C結構體數組
- Go和C之間的類型轉換
- Elasticsearch
- Elasticsearch安裝
- etcd的使用
- etcd 安裝
- Docker
- Docker 安裝部署
- 修改Docker鏡像源
- 使用Dockerfile構建部署項目
- 使用Dockerfile多階段構建
- Dockerfile指令解析
- Volume
- 創建一個images
- Docker容器管理
- Shipyard
- Portainer
- lazydocker-docker 終端ui管理
- Docker 容器-ssh登錄
- Dockerfile CMD啟動命令
- Docker 容器獨立ip
- 清理 Docker文件
- Docker-Composer
- Docker遠程訪問
- Docker 遠程訪問API設置
- Docker 結合IDEA使用
- Docker 使用錯誤
- Docker鏡像瘦身
- Docker查看退出碼 exitCode
- Docker安裝寶塔
- Docker創建calibre-web
- Docker不能使用gdb調試的解決方案
- k8s
- K8s安裝部署
- 安裝部署coreDNS
- web管理之一 Dashboard
- dashboard的yaml文件
- 集群監控 heapster
- 資源監控 metrics
- web管理之二 Prometheus
- idea k8s插件
- 第一個 k8s應用
- k8s將pod在master上運行
- k8s網絡通信模型
- Deployment和Pod區別
- Statefulset的基本使用
- k8s的持久化存儲 PersistentVolume
- Ingress基本用法
- k8s錯誤處理
- 角色權限
- busybox k8s的調試工具
- nfs的安裝和使用
- Kafka
- kafka介紹
- Redis
- Redis的安裝
- Redis主從配置
- Redis數據類型
- Redis-Set
- Redis-Hash
- Redis設計與實現
- 第一節:sds
- 第二節:鏈表的實現
- 第三節:字典的實現(一) - 基本原理
- 第四節:字典的實現(二) - 哈希算法
- 第五節:字典的實現(三) - 哈希沖突解決方案
- 第六節:字典的實現(四) - rehash原理
- 第七節:跳躍表
- 第七節:整數集合
- 第八節:壓縮列表
- 第九節:對象
- 總結
- Redis源碼分析
- 配置VScode調試Redis源碼
- VScode調試Redis源碼,指針顯示的問題
- Redis模塊概述
- Redis的五個數據類型
- sds字符串分析
- adlist分析
- ziplist壓縮列表
- quicklist
- dict字典--hashtable
- zskiplist-跳躍表
- sparkline微線圖
- Redis源碼的一些基礎知識總結
- 在redis中遇見redisObject struct
- acl庫編寫Redis客戶端
- hireids操作
- 當內存耗盡時,redis怎么做
- 如何保證redis的高并發及高可用?
- 使用redis實現分布式鎖
- Redis管道技術測試
- MongoDB
- MongoDB安裝
- MongoDB免安裝版
- Mongodb C Driver驅動安裝
- MongoDB知識點
- MongoDB基礎
- MongodB原子操作
- MongoDB索引
- MongoDB主從/副本集
- MongoDB分片集群
- MongoDB性能檢測
- MongoDB構建模式
- Mongo-cxx-driver
- mongo-c-driver
- MongoDB用戶操作
- MySQL
- MySQL安裝
- 一個機器多個MySQL
- 創建遠程鏈接
- 字段編輯
- 存儲過程
- MySQL嚴格模式
- Mysql 丟失Root密碼
- 中國全省市表
- 高性能MySQL
- MySQL并發控制
- MySQL基準測試
- MySQL服務器性能剖析
- MySQLSchema與數據類型優化
- MySQL創建高性能索引
- MySQL復制
- MySQL-高可用
- MySQL引擎
- DB
- Oracle
- ORACLE9i安裝
- Oracle存儲過程
- Oracle 存儲過程基礎組件
- Oracle存儲過程示例
- Other Language
- Python
- python編程通用概念
- python安裝
- pycharm-docker調試
- Python安裝AES加密
- python安裝pip
- 錯誤
- py框架
- Django
- 開始一個項目
- 路由
- 模型層
- 創建博客文章模型
- Django Shell
- 初識Django Admin模塊
- 實現博客數據返回頁面
- 初始Django視圖與模板
- boot靜態頁面
- django分頁
- Django設置
- djangocms
- 語言特性
- 切片
- PHP
- php外部擴展
- 添加C擴展
- 添加外部C擴展
- 添加redis
- redis
- 下載
- 封裝
- 外部訪問配置
- redis基本操作
- 框架
- TP5
- Model
- 自動寫入時間戳
- Laravel
- 安裝
- TP3.2
- CACHE緩存
- create
- curl
- 文件下載
- 模塊名字
- 常用工具
- 功能代碼
- 檢測磁盤剩余空間
- 靜態類
- 消除html標簽
- 檢測手機號
- 毫秒 == 日期格式
- jQuery
- 找子元素
- php網絡編程
- socket
- socket_server.php
- socket_client.php
- websocket
- websocket_server.php
- websocket_client.html
- websocket_unit.js
- swoole
- 環境依賴及安裝
- 搭環境
- windows搭建apache+php7
- nginx做成服務順便配置php
- Lua
- Lua環境安裝
- lua api
- lua_pop & lua_settop
- lua_next
- JAVA
- Java通用編程概念
- Java環境安裝
- 編譯遇到的問題
- 請求接口
- java變量類型
- Android
- IDEA 配置 gradle
- Rust
- Rust編程通用概念
- Rust安裝
- 更換crates源
- 寫一個hello world
- 變量可變性
- 數據類型
- Struct+方法語法
- 賦值
- tokio網絡框架
- tokio安裝
- EchoServer
- 實現Future
- 組合器
- shadowsocket-rust
- shadowsocket-rust安裝
- Scheme
- 環境搭建及基本語法
- JavaScript
- NodeJs
- React
- React-Native
- 使用pkg打包
- Nginx
- Nginx-反向代理
- OpenResty初探
- OpenResty做一個postman
- lua沒有continue
- nginx 配置靜態服務器
- 將luarocks整合進openresty,并安裝lfs
- Git
- GitHub基本操作
- Github跟本地的配置和操作
- GitHub搜索
- Github鏡像
- git修改遠程倉庫
- Git基本操作
- 安裝gitlab
- VC工程的.gitignore
- Git 設置代理
- Git克隆部分文件
- Linux
- 用戶操作
- 防火墻操作
- 壓縮
- Linux時間同步
- CURL
- Linux samba文件共享
- 使用cat創建新文件并追加內容
- htop / glances / dstat
- IPC錯誤
- nc的使用
- 核與線程 CPU 4核8線程 的解釋
- Linux 使用 MLDonkey 下載 ed2k
- Linux技巧
- LINUX技巧-查找文件行中值重復的行
- tcpdump 抓包
- 日志查找
- nethogs 查看網絡流量
- 系統中加入庫目錄
- 將root權限的文件改為用戶權限
- linux 打開文件數 too many open files 解決方法
- 查看系統CPU/GPU/磁盤io
- 快速刪除大量文件的方法
- Linux-文件傳輸
- 安裝 nvidia 驅動
- 改造VIM
- 通過vimplus項目一鍵配置vim
- 自定義vim配置C++IDE
- 終端配色
- VIM+項目管理
- vimplus快捷鍵
- 自動切換輸入法
- Shell編程
- shell腳本守護進程
- if [ $# -eq 0 ]該語句是什么含義?
- 從命令行提示輸入,和自動輸入,自動交互
- grep指令
- cut指令
- awk指令
- xargs
- 使用except自動交互
- Ubuntu
- 界面安裝
- 更換源
- Ubuntu安裝docker
- Ubuntu18 安裝qt
- 更新密鑰
- Ubuntu開啟遠程登錄
- Ubuntu16.04界面無法啟動
- apt-get install 沒有自動安裝
- dpkg: 處理軟件包 nginx (--configure)時出錯
- ubuntu下瀏覽器使用代理
- Ubuntu把放大縮小按鈕移動到左邊
- wine 安裝錯誤
- Ubuntu下安裝Microsoft to do
- 在Ubuntu上使用ssh連接另外一臺機器出問題
- 解決windows和ubuntu16.04虛擬機拖放問題
- 解決apt-get /var/lib/dpkg/lock-frontend 問題
- Ubuntu安裝cinnamon
- sudo apt-get update錯誤
- googlechrome
- Ubuntu16.04安裝xmind
- Ubuntu下載迅雷
- Linux護眼寶
- 查看Ubuntu安裝的界面
- 使用aria2
- CentOS7使用yum安裝gcc
- System
- MAC
- 安裝軟件
- mac基本操作
- 安裝pod
- 改造終端
- VIM配置
- Chroom瀏覽器https訪問
- mac攝像頭打不開
- Mac與Windows或Linux的鍵鼠共享神器Synergy
- Windows
- 小工具
- bat文件的使用
- bat把exe文件做成單擊右鍵可運行的
- copy
- 注冊 dll
- 鏡像==分區
- choco
- BaiduPCS-go
- tail日志查看命令
- 右鍵菜單沒有選項
- Proxy SwitchyOmega
- Google云服務器配置
- 百度網盤不限速
- 遠程桌面
- 百度地圖離線開發
- 查看端口
- SC命令使用
- 開發
- TIME_WAIT過多導致服務不能被訪問
- 修改win的默認編碼
- 百度網盤二維碼刷新不出來
- 移動端
- Object-C
- 錄音跟播放
- 視頻的采集跟播放
- Swift
- Swift編程通用概念
- Switf環境安裝
- Swift Package Manager(SPM)
- 手動導入庫
- PerfectTemplate的使用
- PerfectTemplate環境搭建
- ios直播開發
- Simple-RTMP-Server
- Mac上安裝ffmpeg環境
- 推流拉流
- 仿直播app開發
- 框架搭建
- 開發流程
- React-Native
- React-native環境安裝
- 分布式追蹤系統
- Jaeger 客戶端庫
- LightStep 的使用
- 軟件
- PhpStorm
- 安裝ThinkStrom
- 添加xdebug
- Clion
- C++開發配置
- 激活碼
- 在linux上制作桌面圖標
- Vagrant
- VMWare
- VirtualBox
- proxifier + Shadowshocks
- Cmder
- Navicate For MongoDB
- MinDoc
- GitHub速度慢
- 科學
- VMware虛擬機磁盤操作占用過高問題
- PhotoShop+Premiere下載
- ActionView安裝部署
- 讀書筆記
- 博客
- hexo
- 部署
- jekyll
- 在線編譯器
- 書屋
- 如何閱讀一本書
- 個人發展
- Linux高性能服務器讀書筆記
- TCP/IP協議族
- IP協議
- TCP協議詳解
- TCP協議的擁塞控制
- 安全測試
- 常見web安全漏洞
- 程序設計
- log日志設計
- 爬蟲項目
- Python3.7的安裝
- Scrapy的安裝和使用
- Colly框架
- Crawlab是一款款里爬蟲的web框架
- 英文學習