
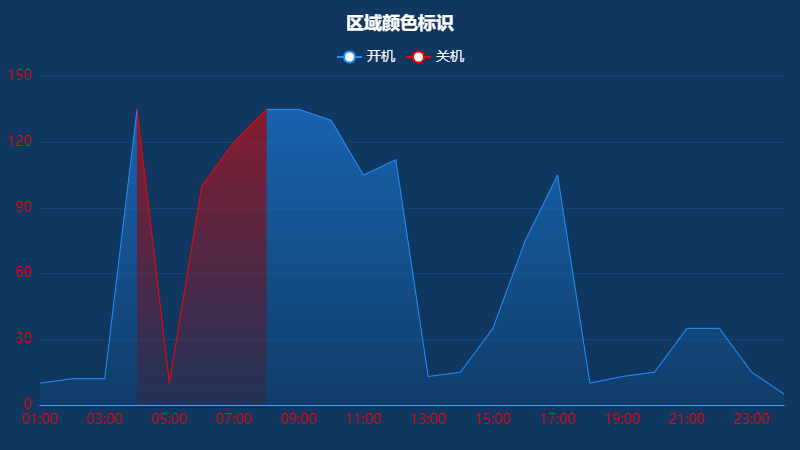
>#### 區域顏色標識
~~~
let seriesData = [];
let Xdata = [
'01:00',
'02:00',
'03:00',
'04:00',
'05:00',
'06:00',
'07:00',
'08:00',
'09:00',
'10:00',
'11:00',
'12:00',
'13:00',
'14:00',
'15:00',
'16:00',
'17:00',
'18:00',
'19:00',
'20:00',
'21:00',
'22:00',
'23:00',
'24:00',
];
let series = [
[
['01:00', 10],
['02:00', 12],
['03:00', 12],
['04:00', 135], null, ['08:00', 135],
['09:00', 135],
['10:00', 130],
['11:00', 105],
['12:00', 112],
['13:00', 13],
['14:00', 15],
['15:00', 35],
['16:00', 75],
['17:00', 105],
['18:00', 10],
['19:00', 13],
['20:00', 15],
['21:00', 35],
['22:00', 35],
['23:00', 15],
['24:00', 5]
],
[
['04:00', 135],
['05:00', 10],
['06:00', 100],
['07:00', 120],
['08:00', 135]
],
];
let colors = [
['rgba(34,143,254,1)', 'rgba(34,143,254,0.7)', 'rgba(34,143,254,0.1)'],
['rgba(254,0,0,1)', 'rgba(254,0,0,0.7)', 'rgba(254,0,0,0.1)'],
];
let line = ['開機', '關機',];
line.map((item, index) => {
seriesData.push({
name: item,
type: 'line',
showSymbol: false,
data: series[index],
areaStyle: {
normal: {
color: new echarts.graphic.LinearGradient(
0,
0,
0,
1,
[{
offset: 0,
color: colors[index][1],
},
{
offset: 1,
color: colors[index][2],
},
],
false
),
},
},
itemStyle: {
normal: {
color: colors[index][0],
},
},
lineStyle: {
width: 1,
},
});
});
option = {
toolbox: {
feature: {
saveAsImage: {}
}
},
backgroundColor: "#0f375f",
title: {
text: '區域顏色標識',
left: 'center',
top: '10px',
textStyle: {
color: '#ffffff'
}
},
legend: {
top: '10%',
show: true,
textStyle: {
color: '#f2f2f2',
fontSize: 14,
},
},
grid: {
show: false,
width: '93%',
left: '5%',
right: '2%',
bottom: '10%',
top: '17%',
},
tooltip: {
trigger: 'axis',
axisPointer: {
type: 'line',
},
textStyle: {
fontSize: 14,
},
},
xAxis: {
type: 'category',
interval: 5,
boundaryGap: false,
axisLabel: {
show: true,
color: 'red',
fontSize: 14,
},
axisLine: {
lineStyle: {
color: 'rgba(73, 163, 255, 1)',
width: 1,
},
},
axisTick: {
show: false,
},
data: Xdata,
},
yAxis: {
type: 'value',
nameTextStyle: {
color: 'red',
padding: [0, 0, 0, 0],
},
axisLabel: {
show: true,
color: 'red',
fontSize: 14,
},
axisLine: {
lineStyle: {
color: '#344755',
width: 0,
},
},
splitLine: {
show: true,
lineStyle: {
color: 'rgba(20, 82, 129, 1)',
width: 0.5,
},
},
axisTick: {
show: false,
},
},
series: seriesData,
};
~~~
>#### 效果圖
<hr>
- html
- 頭部標簽
- canvas
- md
- DOM
- git常用命令
- css
- 網站
- 默認
- 前綴
- 文本
- 圖片
- 選擇器
- 滾動條
- 強制橫屏
- 響應式
- 動畫
- animation(動畫)
- transition(過渡)
- transform(變形)
- translate(移動)
- 漸變
- 鼠標
- 自定義 Web 字體
- 可視化
- echarts
- 折線圖
- 區域顏色標識
- 分段顯示不同顏色
- 柱狀圖
- 子彈圖
- 分組、柱體寬度、指示器寬度
- 圓角
- 頂部顯示文字
- 雙軸柱狀折線圖
- 雙軸雙列柱狀圖
- 單個柱狀圖
- 多縱向坐標
- 走勢圖
- 橫向百分比
- 最大值和最小值
- 餅圖
- 嵌套
- 分組顯示
- 餅圖結合柱狀圖
- 折線結合餅圖
- 關系圖
- 樹圖
- 地圖
- 標點
- 選中
- 常用
- 圖片超出可拖拽
- 百度導航
- 短信驗證碼倒計時
- video
- TS
- 未整理
- 消失的邊界線問題
- 跟隨
- js
- 兼容
- 數組去重
- 解析 URL 參數為對象
- 圖片懶加載
- 正則
- Photoshop
- 快捷鍵
- 混合模式
- vscode
- vue
- 指令