
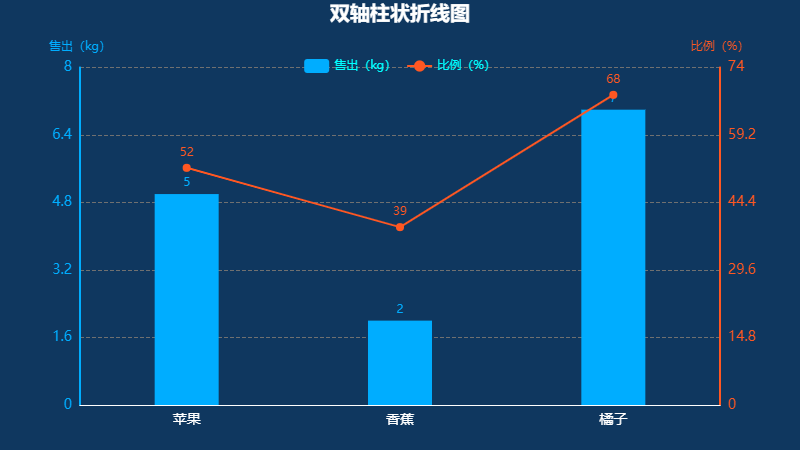
>#### 雙軸柱狀折線圖
~~~
// 顏色
let colors = ['#00adff', '#ff5722'];
let yNameOne = '售出(kg)';
let yNameTwo = '比例(%)';
let xData = ['蘋果', '香蕉', '橘子'];
let yData = {
one: [5, 2, 7],
two: [52, 39, 68],
};
let splitNumber = 5; // 分割段
//計算最大值
function calMax(arr) {
let min = Math.min.apply(null, arr);
let max = Math.max.apply(null, arr);
let interval = (max - min) / splitNumber; // 平均值
max = Math.ceil(max + interval); // 向上取整
return max;
}
//計算最小值
function calMin(arr) {
let min = Math.min.apply(null, arr);
let max = Math.max.apply(null, arr);
let interval = (max - min) / splitNumber; // 平均值
min = min > 0 ? min : Math.floor(min - interval); // 向下取整
// console.log(min, max, interval);
return min;
}
option = {
backgroundColor: "#0f375f",
title: {
text: '雙軸柱狀折線圖',
top: '0',
x: 'center',
textStyle: {
color: '#fff',
fontSize: '20',
fontWeight: 'bold'
},
},
color: colors,
grid: {
top: '15%',
bottom: '10%',
left: '80',
right: '80',
},
legend: {
top: '12%',
textStyle: {
color: '#00ffff',
margin: '10',
},
},
toolbox: {
feature: {
saveAsImage: {
},
},
iconStyle: {
borderColor: '#fff',
fontSize: '22px',
},
},
tooltip: {
trigger: 'axis',
axisPointer: {
type: 'shadow'
},
},
xAxis: {
type: 'category',
axisTick: {
show: false
},
axisLabel: {
textStyle: {
color: '#fff',
fontSize: 14
},
rotate: 0, //傾斜度
},
axisLine: {
show: true,
lineStyle: {
color: '#fff'
},
},
data: xData,
},
yAxis: [{
name: yNameOne,
type: 'value',
position: 'left',
min: 0,
max: calMax(yData.one),
splitNumber: splitNumber,
interval: (calMax(yData.one) - (calMin(yData.one) > 0 ? 0 : calMin(yData.one))) / splitNumber,
splitLine: {
lineStyle: {
type: 'dashed',
color: '#707070'
},
},
axisLabel: {
// formatter: '{value}mm',
formatter: function (value, index) {
return (value + '').indexOf('.') != -1 ? value.toFixed(1) : value;
},
textStyle: {
color: colors[0],
fontSize: 14
},
},
axisLine: {
show: true,
lineStyle: {
color: colors[0],
width: 2,
},
},
axisTick: {
show: false
},
},
{
name: yNameTwo,
type: 'value',
position: 'right',
min: 0,
max: calMax(yData.two),
splitNumber: splitNumber,
interval: (calMax(yData.two) - (calMin(yData.two) < 0 ? calMin(yData.two) : 0)) / splitNumber,
splitLine: {
show: false
},
axisLabel: {
// formatter: '{value}°C',
formatter: function (value, index) {
return (value + '').indexOf('.') != -1 ? value.toFixed(1) : value;
//return parseInt(value) + '%';
},
textStyle: {
color: colors[1],
fontSize: 14
},
},
axisLine: {
show: true,
lineStyle: {
color: colors[1],
width: 2,
},
},
axisTick: {
show: false
},
},
],
series: [{
name: yNameOne,
type: 'bar',
barWidth: '30%',
itemStyle: {
normal: {
label: {
show: true, //開啟顯示
position: 'top', //在上方顯示
textStyle: {
//數值樣式
color: colors[0],
fontSize: 12,
fontWeight: 400,
},
},
},
},
data: yData.one,
},
{
name: yNameTwo,
type: 'line',
symbol: 'circle',
symbolSize: 8,
yAxisIndex: 1,
itemStyle: {
normal: {
label: {
show: true, //開啟顯示
position: 'top', //在上方顯示
textStyle: {
//數值樣式
color: colors[1],
fontSize: 12,
fontWeight: 400,
},
},
},
},
data: yData.two,
},
],
};
~~~
>#### 效果圖
<hr>
- html
- 頭部標簽
- canvas
- md
- DOM
- git常用命令
- css
- 網站
- 默認
- 前綴
- 文本
- 圖片
- 選擇器
- 滾動條
- 強制橫屏
- 響應式
- 動畫
- animation(動畫)
- transition(過渡)
- transform(變形)
- translate(移動)
- 漸變
- 鼠標
- 自定義 Web 字體
- 可視化
- echarts
- 折線圖
- 區域顏色標識
- 分段顯示不同顏色
- 柱狀圖
- 子彈圖
- 分組、柱體寬度、指示器寬度
- 圓角
- 頂部顯示文字
- 雙軸柱狀折線圖
- 雙軸雙列柱狀圖
- 單個柱狀圖
- 多縱向坐標
- 走勢圖
- 橫向百分比
- 最大值和最小值
- 餅圖
- 嵌套
- 分組顯示
- 餅圖結合柱狀圖
- 折線結合餅圖
- 關系圖
- 樹圖
- 地圖
- 標點
- 選中
- 常用
- 圖片超出可拖拽
- 百度導航
- 短信驗證碼倒計時
- video
- TS
- 未整理
- 消失的邊界線問題
- 跟隨
- js
- 兼容
- 數組去重
- 解析 URL 參數為對象
- 圖片懶加載
- 正則
- Photoshop
- 快捷鍵
- 混合模式
- vscode
- vue
- 指令