
# 控制圖像的美學樣式(aesthetics)
> 譯者:[P3n9W31](https://github.com/P3n9W31)
繪制有吸引力的圖像很十分重要的。當你在探索一個數據集并為你自己做圖的時候,制作一些讓人看了心情愉悅的圖像是很好的。可視化對向觀眾傳達量化的簡介也是很重要的,在這種情況下制作能夠抓住查看者的注意力并牢牢吸引住他們的圖像就更有必要了。
Matplotlib 是高度可定制的,但是很難知道要如何設置圖像才能使得圖像更加吸引人。Seaborn 提供了許多定制好的主題和高級的接口,用于控制 Matplotlib 所做圖像的外觀。
```py
import numpy as np
import seaborn as sns
import matplotlib.pyplot as plt
```
讓我們定義一個簡單的函數來繪制一些偏移正弦波,這將幫助我們看到我們可以調整的能夠影響圖像風格的不同參數。
```py
def sinplot(flip=1):
x = np.linspace(0, 14, 100)
for i in range(1, 7):
plt.plot(x, np.sin(x + i * .5) * (7 - i) * flip)
```
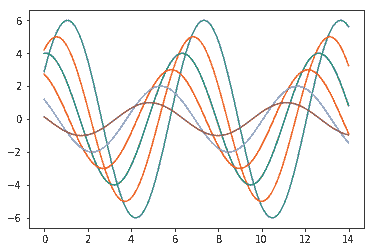
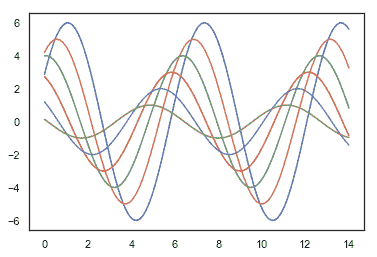
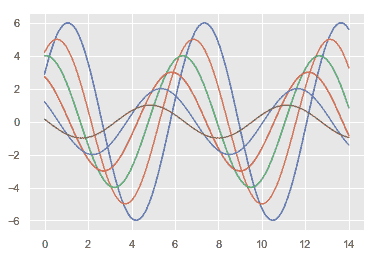
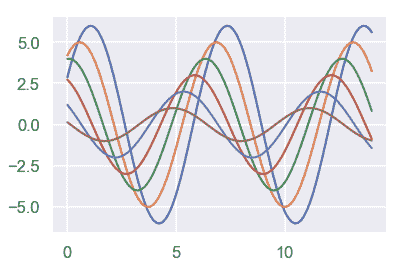
這是 Matplotlib 默認情況下的繪圖外觀:
```py
sinplot()
```
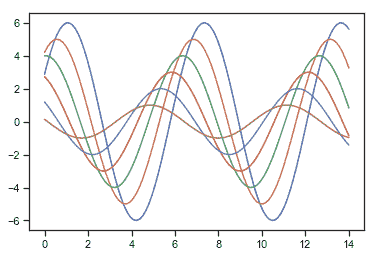
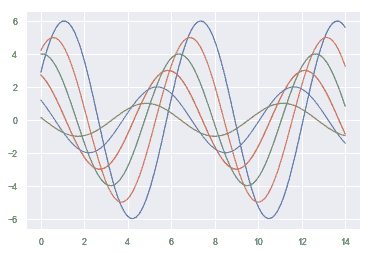
為了將圖像的風格轉變為 seaborn 的默認樣式,我們可以 [`set()`](../generated/seaborn.set.html#seaborn.set "seaborn.set") 函數。
```py
sns.set()
sinplot()
```
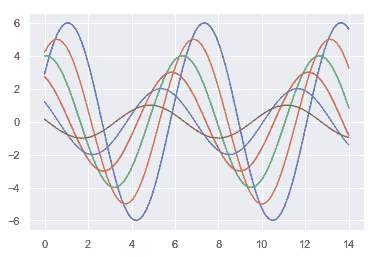
(注意,在 0.8 之前的 seaborn 版本中, [`set()`](../generated/seaborn.set.html#seaborn.set "seaborn.set") 已經在使用 impory 語句導入的時候就被調用了。但在以后的版本中,必須要顯式調用它)。
Seaborn 將 matplotlib 參數分成兩個獨立的組。第一組設置了圖像的美術風格,第二組則對圖像中不同的元素進行了控制,使得圖像可以很容易地融入不同的環境中。
操作這些參數的接口是兩對函數。要控制樣式,請使用 [`axes_style()`](../generated/seaborn.axes_style.html#seaborn.axes_style "seaborn.axes_style") 和 [`set_style()`](../generated/seaborn.set_style.html#seaborn.set_style "seaborn.set_style") 函數。要對圖像中元素的樣式進行修改,請使用 [`plotting_context()`](../generated/seaborn.plotting_context.html#seaborn.plotting_context "seaborn.plotting_context") 和 [`set_context()`](../generated/seaborn.set_context.html#seaborn.set_context "seaborn.set_context") 函數。在這兩種情況下(控制圖像樣式與修改元素樣式),第一個函數會返回一個參數字典,第二個函數設置 matplotlib 中相關參數的默認值。
## Seaborn 圖像參數
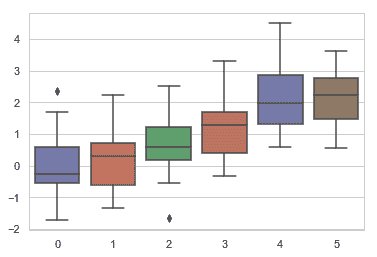
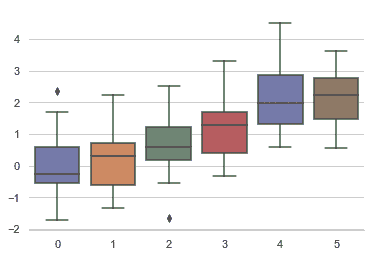
有五個預設的 Seaborn 主題: `darkgrid`,`whitegrid`,`dark`,`white`以及 `ticks`。它們分別適用于不同的應用程序和個人偏好。默認主題為 `darkgrid`。如上所述,坐標方格有助于將制出的圖像用作定量信息的查閱表,灰色背景上的白色有助于防止網格與表示數據的行發生競爭。 `whitegrid` 主題類似,但它更適用于包含大量數據元素的繪圖:
```py
sns.set_style("whitegrid")
data = np.random.normal(size=(20, 6)) + np.arange(6) / 2
sns.boxplot(data=data);
```
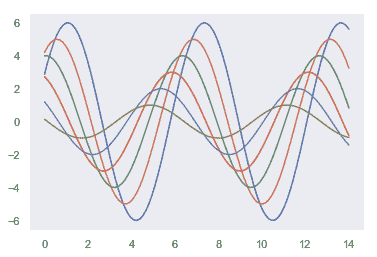
對許多的圖像而言,(尤其是在你只是想通過圖像來提供給人們一個對數據模式的印象時,比如說作報告時)坐標網格都是不必要的。
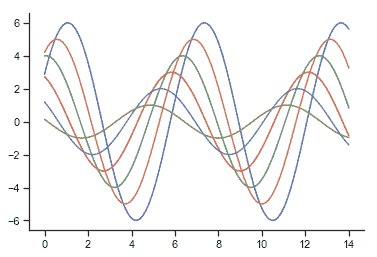
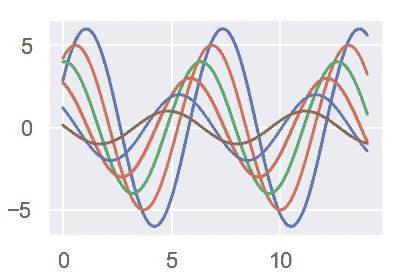
```py
sns.set_style("dark")
sinplot()
```
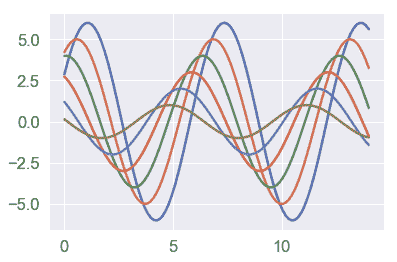
```py
sns.set_style("white")
sinplot()
```
有時,您可能希望為繪圖提供一點額外的結構,這正是 tick 樣式的用武之地:
```py
sns.set_style("ticks")
sinplot()
```
## 移除坐標軸
`white` 樣式與 `ticks` 樣式的好處是都能刪除所不需要的頂部與右部坐標軸。使用 seaborn 中的函數 [`despine()`](../generated/seaborn.despine.html#seaborn.despine "seaborn.despine") 可以來移除它們:
```py
sinplot()
sns.despine()
```
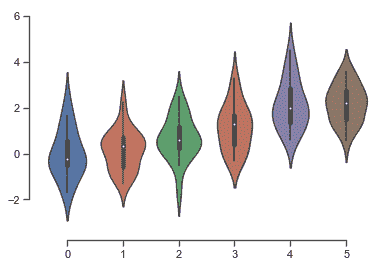
有些圖的好處在于,可以讓坐標的主軸隨著數據進行偏移,這可以使用 [`despine()`](../generated/seaborn.despine.html#seaborn.despine "seaborn.despine")函數來完成。當刻度無法覆蓋軸的整個范圍時,`trim`參數將限制不受影響的坐標軸的范圍。
```py
f, ax = plt.subplots()
sns.violinplot(data=data)
sns.despine(offset=10, trim=True);
```
你也可以通過控制 [`despine()`](../generated/seaborn.despine.html#seaborn.despine "seaborn.despine")的額外參數來刪除坐標軸:
```py
sns.set_style("whitegrid")
sns.boxplot(data=data, palette="deep")
sns.despine(left=True)
```
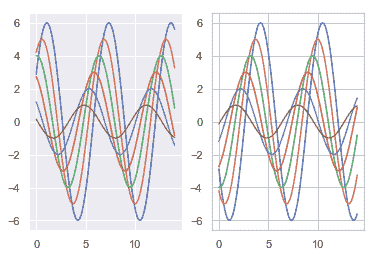
## 設置臨時圖像格式
雖然來回切換很容易,但你也可以在`with`語句中使用 [`axes_style()`](../generated/seaborn.axes_style.html#seaborn.axes_style "seaborn.axes_style") 函數來臨時設置繪圖參數。 這也允許您使用不同風格的坐標軸制作圖形:
```py
f = plt.figure()
with sns.axes_style("darkgrid"):
ax = f.add_subplot(1, 2, 1)
sinplot()
ax = f.add_subplot(1, 2, 2)
sinplot(-1)
```
## 覆蓋控制 seaborn 樣式的元素
如果你想要自己定制 seaborn 的樣式,你可以通過給 [`axes_style()`](../generated/seaborn.axes_style.html#seaborn.axes_style "seaborn.axes_style") 與[`set_style()`](../generated/seaborn.set_style.html#seaborn.set_style "seaborn.set_style")函數中的 `rc` 參數傳遞一個參數字典來實現。請注意,您只能通過此方法覆蓋作為樣式定義一部分的參數。(但是,更高級別的 [`set()`](../generated/seaborn.set.html#seaborn.set "seaborn.set") 函數會獲取任何 matplotlib 參數的字典)。
如果你想看看包含哪些參數,你可以只調用沒有參數的函數,這將返回當前設置:
```py
sns.axes_style()
```
```py
{'axes.axisbelow': True,
'axes.edgecolor': '.8',
'axes.facecolor': 'white',
'axes.grid': True,
'axes.labelcolor': '.15',
'axes.spines.bottom': True,
'axes.spines.left': True,
'axes.spines.right': True,
'axes.spines.top': True,
'figure.facecolor': 'white',
'font.family': ['sans-serif'],
'font.sans-serif': ['Arial',
'DejaVu Sans',
'Liberation Sans',
'Bitstream Vera Sans',
'sans-serif'],
'grid.color': '.8',
'grid.linestyle': '-',
'image.cmap': 'rocket',
'lines.solid_capstyle': 'round',
'patch.edgecolor': 'w',
'patch.force_edgecolor': True,
'text.color': '.15',
'xtick.bottom': False,
'xtick.color': '.15',
'xtick.direction': 'out',
'xtick.top': False,
'ytick.color': '.15',
'ytick.direction': 'out',
'ytick.left': False,
'ytick.right': False}
```
然后,您可以設置這些參數的不同版本:
```py
sns.set_style("darkgrid", {"axes.facecolor": ".9"})
sinplot()
```
## 縮放圖像元素
一組獨立的參數控制繪圖元素的比例,這允許您使用相同的代碼來制作在適合使用不同大小圖片場景下的圖片。
首先,讓我們通過調用 [`set()`](../generated/seaborn.set.html#seaborn.set "seaborn.set")來重置默認的參數:
```py
sns.set()
```
按照相對大小的順序排序,四個預設環境是 `paper`, `notebook`, `talk`與 `poster`。 `notebook`樣式是默認樣式,上文中的圖就是使用該樣式繪制的。
```py
sns.set_context("paper")
sinplot()
```
```py
sns.set_context("talk")
sinplot()
```
```py
sns.set_context("poster")
sinplot()
```
您現在知道的關于樣式函數的大部分內容應該轉移到環境函數中。
你可以通過在調用 [`set_context()`](../generated/seaborn.set_context.html#seaborn.set_context "seaborn.set_context") 時指定環境的名字來設置參數,你也可以通過提供一個參數字典來覆蓋原有的參數值。
你也在轉換環境的時候獨立地對字符元素的大小進行縮放。(這個操作也能夠頂層的 [`set()`](../generated/seaborn.set.html#seaborn.set "seaborn.set") 函數來實現)。
```py
sns.set_context("notebook", font_scale=1.5, rc={"lines.linewidth": 2.5})
sinplot()
```
同樣的,你也可以暫時的通過嵌套在 `with` 語句下的語句來實現圖像的縮放。
樣式和環境都可以使用 [`set()`](../generated/seaborn.set.html#seaborn.set "seaborn.set") 函數快速配置。 此函數還設置默認調色板,但更詳細的介紹將在本教程的 [下一節](color_palettes.html#palette-tutorial) 進行敘述。
- seaborn 0.9 中文文檔
- Seaborn 簡介
- 安裝和入門
- 可視化統計關系
- 可視化分類數據
- 可視化數據集的分布
- 線性關系可視化
- 構建結構化多圖網格
- 控制圖像的美學樣式
- 選擇調色板
- seaborn.relplot
- seaborn.scatterplot
- seaborn.lineplot
- seaborn.catplot
- seaborn.stripplot
- seaborn.swarmplot
- seaborn.boxplot
- seaborn.violinplot
- seaborn.boxenplot
- seaborn.pointplot
- seaborn.barplot
- seaborn.countplot
- seaborn.jointplot
- seaborn.pairplot
- seaborn.distplot
- seaborn.kdeplot
- seaborn.rugplot
- seaborn.lmplot
- seaborn.regplot
- seaborn.residplot
- seaborn.heatmap
- seaborn.clustermap
- seaborn.FacetGrid
- seaborn.FacetGrid.map
- seaborn.FacetGrid.map_dataframe
- seaborn.PairGrid
- seaborn.PairGrid.map
- seaborn.PairGrid.map_diag
- seaborn.PairGrid.map_offdiag
- seaborn.PairGrid.map_lower
- seaborn.PairGrid.map_upper
- seaborn.JointGrid
- seaborn.JointGrid.plot
- seaborn.JointGrid.plot_joint
- seaborn.JointGrid.plot_marginals
- seaborn.set
- seaborn.axes_style
- seaborn.set_style
- seaborn.plotting_context
- seaborn.set_context
- seaborn.set_color_codes
- seaborn.reset_defaults
- seaborn.reset_orig
- seaborn.set_palette
- seaborn.color_palette
- seaborn.husl_palette
- seaborn.hls_palette
- seaborn.cubehelix_palette
- seaborn.dark_palette
- seaborn.light_palette
- seaborn.diverging_palette
- seaborn.blend_palette
- seaborn.xkcd_palette
- seaborn.crayon_palette
- seaborn.mpl_palette
- seaborn.choose_colorbrewer_palette
- seaborn.choose_cubehelix_palette
- seaborn.choose_light_palette
- seaborn.choose_dark_palette
- seaborn.choose_diverging_palette
- seaborn.load_dataset
- seaborn.despine
- seaborn.desaturate
- seaborn.saturate
- seaborn.set_hls_values