
# 選擇調色板
> 譯者:[Modrisco](https://github.com/Modrisco)
顏色在圖像風格中比起其他元素顯得更為重要。當合理有效地使用顏色時,數據模式會被凸顯出來;反之,則會被掩蓋。這里有很多數據可視化中關于顏色使用的優秀資源,我推薦閱讀這些 Rob Simmon 的[博客文章](https://earthobservatory.nasa.gov/blogs/elegantfigures/2013/08/05/subtleties-of-color-part-1-of-6/)以及這篇更加學術性的[論文](https://cfwebprod.sandia.gov/cfdocs/CompResearch/docs/ColorMapsExpanded.pdf)。 此外,matplotlib 文檔也提供了一篇很好的[教程](https://matplotlib.org/users/colormaps.html)來說明一些內置 Colormap 的感知屬性。
seaborn 讓您在選擇與您處理的數據類型和可視化過程中搭配的配色方案變得簡單。
```py
import numpy as np
import seaborn as sns
import matplotlib.pyplot as plt
sns.set()
```
## 創建調色板
使用離散調色板過程中最重要函數是[`color_palette()`](../generated/seaborn.color_palette.html#seaborn.color_palette "seaborn.color_palette")。這個函數為許多(但不是全部)可以在 seaborn 中生成顏色的方式提供了一個接口,并且在任何具有`palette`參數的函數的內部都可以使用(以及某些需要多種顏色時具有`color`參數的情況)。
[`color_palette()`](../generated/seaborn.color_palette.html#seaborn.color_palette "seaborn.color_palette") 會接受所有的 seaborn 調色板或者 matplotlib Colormap (除了 `jet`, 您永遠都不應該使用它). 它還可以獲取以任何有效 matplotlib 格式(RGB 元組、十六進制顏色代碼或 HTML 顏色名字)指定的顏色列表。返回值始終是 RGB 元組的列表。
最后,在沒有參數的情況下調用[`color_palette()`](../generated/seaborn.color_palette.html#seaborn.color_palette "seaborn.color_palette")函數將會返回當前默認的顏色循環。
函數[`set_palette()`](../generated/seaborn.set_palette.html#seaborn.set_palette "seaborn.set_palette")接受相同的參數,并將為所有圖像設置默認的顏色循環。您也可以在`with`語句中調用[`color_palette()`](../generated/seaborn.color_palette.html#seaborn.color_palette "seaborn.color_palette")來臨時改變調色板。([參見](#palette-contexts))
在不了解數據特征的情況下,通常也不可能知道哪種調色板或 Colormap 最適合一組數據。接下來,我們將通過三種常見的調色板 _ 定性調色板 _, _ 順序調色板 _, 和 _ 發散調色板 _ 來拆分介紹[`color_palette()`](../generated/seaborn.color_palette.html#seaborn.color_palette "seaborn.color_palette")函數的使用方法以及其他 seaborn 函數。
## 定性調色板
當您想要區分不具有內在順序的離散數據塊時,定性(分類)調色板是最佳方案。
導入 seaborn 的同時,會引入默認的顏色循環,由 6 種顏色構成。并將調用標準 matplotlib 顏色循環,看起來也更加賞心悅目。
```py
current_palette = sns.color_palette()
sns.palplot(current_palette)
```

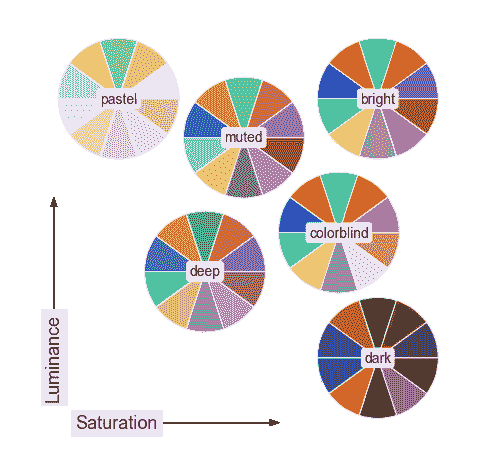
默認主題有六種變體,分別為`deep`, `muted`, `pastel`, `bright`, `dark`, and `colorblind`。
### 使用循環顏色系統
當您要區分任意數量的類別而不強調任何類別時,最簡單的方法是在循環顏色空間中繪制間距相等的顏色(在此顏色空間中,色調會發生變化,同時保持亮度和飽和度不變)。這是大多數 seaborn 函數在處理當需要區分的數據集超過顏色循環中的 6 種顏色時時所使用的默認方法。
最為常用的方法是使用`hls`顏色空間——一種簡單的 RGB 值變體。
```py
sns.palplot(sns.color_palette("hls", 8))
```

[`hls_palette()`](../generated/seaborn.hls_palette.html#seaborn.hls_palette "seaborn.hls_palette")函數允許您控制顏色的亮度(lightness)和飽和度(saturation)。
```py
sns.palplot(sns.hls_palette(8, l=.3, s=.8))
```

然而,由于人類視覺系統的工作方式,RGB 強度很高的顏色也不一定看起來同樣強烈。[我們認為](https://en.wikipedia.org/wiki/Color_vision)黃色和綠色是相對較亮的,藍色是相對較暗的,當目標是與`hls`系統保持一致性時可能會帶來一些問題。
為了解決這一問題,seaborn 提供了一個[husl](http://www.hsluv.org/)系統(后來更名為 HSLuv)的接口,這也使選擇間隔均勻的色調變得容易,同時使亮度和飽和度都更加均勻。
```py
sns.palplot(sns.color_palette("husl", 8))
```
類似地,[`husl_palette()`](../generated/seaborn.husl_palette.html#seaborn.husl_palette "seaborn.husl_palette")函數也為這個系統提供了一個更靈活的接口。
### 使用 Color Brewer 調色板
[Color Brewer](http://colorbrewer2.org/)為定性調色板提供了另一種美觀的配色方案(同樣包含順序調色板包括和發散調色板,詳情見下文)。這些也作為 matplotlib Colormap 存在,但并沒有得到很好的處理。在 seaborn 中,當您需要定性(qualitative)的 Color Brewer 方案時,你總是會得到離散的顏色,但這意味著在某些情況下顏色會循環重復。
Color Brewer 的一個很好的特點是它對色盲比較友好。[色盲](https:/en.wikipea.org/wiki/Color_Blinity)有很多種,最為常見的是紅綠色盲。通常,對于需要根據顏色進行元素區分時,應該盡量避免使用這兩種顏色。
```py
sns.palplot(sns.color_palette("Paired"))
```

```py
sns.palplot(sns.color_palette("Set2"))
```

為了幫助您從 Color Brewer 庫中選取配色方案,seaborn 提供了[`choose_colorbrewer_palette()`](../generated/seaborn.choose_colorbrewer_palette.html#seaborn.choose_colorbrewer_palette "seaborn.choose_colorbrewer_palette")函數。這個函數能夠啟動交互式組件來幫助您瀏覽各種選項,修改不同的參數。但是只能在 Jupyter notebook 中使用。
當然,您可能只希望手動指定一組您喜歡的顏色。[`color_palette()`](../generated/seaborn.color_palette.html#seaborn.color_palette "seaborn.color_palette")函數會接受一個顏色列表,操作起來也很簡單。
```py
flatui = ["#9b59b6", "#3498db", "#95a5a6", "#e74c3c", "#34495e", "#2ecc71"]
sns.palplot(sns.color_palette(flatui))
```

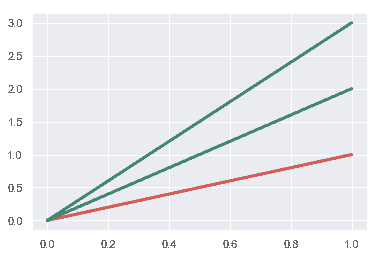
### 使用來自 xkcd color survey 的顏色名字
不久前,[xkcd](https://xkcd.com/)開展了一項[眾包工作](https://blog.xkcd.com/2010/05/03/color-survey-results/)來為隨機 RGB 顏色命名。產生了[954 個顏色名字](https://xkcd.com/color/rgb/),您現在可以在 seaborn 中使用`xkcd_rgb`字典來引用它們:
```py
plt.plot([0, 1], [0, 1], sns.xkcd_rgb["pale red"], lw=3)
plt.plot([0, 1], [0, 2], sns.xkcd_rgb["medium green"], lw=3)
plt.plot([0, 1], [0, 3], sns.xkcd_rgb["denim blue"], lw=3);
```
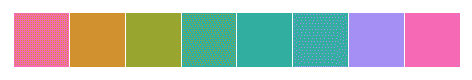
除了從`xkcd_rgb`字典中提取單一顏色外,您也可以向[`xkcd_palette()`](../generated/seaborn.xkcd_palette.html#seaborn.xkcd_palette "seaborn.xkcd_palette")函數傳遞一個顏色名字列表。
```py
colors = ["windows blue", "amber", "greyish", "faded green", "dusty purple"]
sns.palplot(sns.xkcd_palette(colors))
```

## 順序調色板
第二類主要的調色板被稱為“順序調色板”(sequential),當數據集的范圍從相對低值(不感興趣)到相對高值(很感興趣)時,最好使用順序調色板,盡管在某些情況下您可能需要順序調色板中的離散顏色。在[`kdeplot()`](../generated/seaborn.kdeplot.html#seaborn.kdeplot "seaborn.kdeplot")和[`heatmap()`](../generated/seaborn.heatmap.html#seaborn.heatmap "seaborn.heatmap")函數中使用它們來作為 Colormap 則更為常見(以及類似的 matplotlib 函數)。
在這種情況下使用`jet`(或其他彩虹調色板)等 Colormap 是很常見的,因為色調范圍給人的印象是提供有關數據的額外信息。然而,具有較大色調變化的 Colormap 往往會引入數據中不存在的不連續性,并且我們的視覺系統無法自然地將彩虹光譜映射到諸如“高”或“低”的定量區分。導致來這些可視化的結果更加令人困惑,因為它們掩蓋了數據中的模式,而不是揭示它們。`jet` 調色板使用了最亮的顏色(黃色和青色)的中間數據值,導致效果是強調無趣的(和任意的)值,而不是強調極端的值。
對于連續性的數據,最好使用色調變化幅度較小,而亮度和飽和度變化幅度較大的配色方案。這種方法會很自然地吸引人們注意數據中相對重要的部分。
Color Brewer 庫有大量這樣的配色方案,它們以調色板中主要的一種或多種顏色命名。
```py
sns.palplot(sns.color_palette("Blues"))
```

與 matplotlib 類似,您可以通過添加加后綴`_r`來倒置順序調色板的順序。
```py
sns.palplot(sns.color_palette("BuGn_r"))
```

seaborn 同樣添加了一個小竅門來幫助您創建“深色”調色板,它沒有一個很寬的動態范圍。在當您需要按順序映射直線或點時這可能會很有用,因為顏色較亮的線條會比較難以區分。
```py
sns.palplot(sns.color_palette("GnBu_d"))
```

您可能想要使用[`choose_colorbrewer_palette()`](../generated/seaborn.choose_colorbrewer_palette.html#seaborn.choose_colorbrewer_palette "seaborn.choose_colorbrewer_palette")函數來嘗試多種選項,當您希望傳遞給 seaborn 或者 matplotlib 的返回值為 Colormap 對象時,您可以將`as_cmap`對象設置為`True`。
### 順序 “cubehelix” 調色板
[cubehelix](https://www.mrao.cam.ac.uk/~dag/CUBEHELIX/)調色板系統使順序調色板的亮度產生線性變化,色調也會產生一些變化。這意味著您的 Colormap 在轉換為黑白模式時(用于打印)的信息將得到保留,且對色盲友好。
Matplotlib 內置了默認的 cubehelix 版本:
```py
sns.palplot(sns.color_palette("cubehelix", 8))
```

Seborn 為 cubehelix 系統提供了一個接口,以便您可以制作各種調色板,這些調色板都具有良好的線性亮度漸變。
由 seborn [`cubehelix_palette()`](../generated/seaborn.cubehelix_palette.html#seaborn.cubehelix_palette "seaborn.cubehelix_palette") 函數返回的默認調色板與 matplotlib 的默認值稍有不同,因為它不會圍繞色輪旋轉很遠,也不會覆蓋很寬的強度范圍。它還反轉順序,以便讓更重要的值的顏色更暗:
```py
sns.palplot(sns.cubehelix_palette(8))
```

[`cubehelix_palette()`](../generated/seaborn.cubehelix_palette.html#seaborn.cubehelix_palette "seaborn.cubehelix_palette") 函數的其他參數控制調色板的外觀。您將更改的兩個主要參數為 `start` (介于 0 到 3 之間的值)和 `rot` —— 旋轉次數(任意值,但可能在-1 和 1 之間)。
```py
sns.palplot(sns.cubehelix_palette(8, start=.5, rot=-.75))
```

您還可以控制端點的亮度,甚至反轉漸變:
```py
sns.palplot(sns.cubehelix_palette(8, start=2, rot=0, dark=0, light=.95, reverse=True))
```

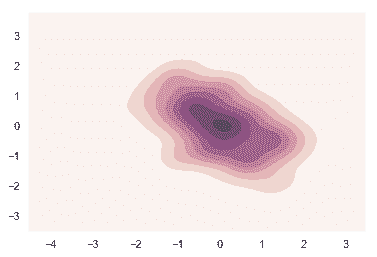
如同其他 seaborn 函數,您將默認得到一個顏色列表。但您也可以通過修改 `as_cmap=True` 將調色板作為 Colormap 對象的返回值來傳遞給 seaborn 或 matplotlib 函數。
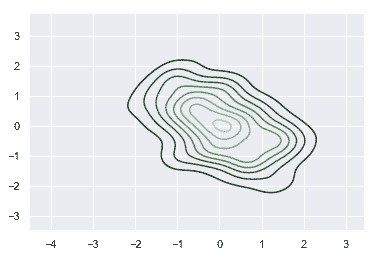
```py
x, y = np.random.multivariate_normal([0, 0], [[1, -.5], [-.5, 1]], size=300).T
cmap = sns.cubehelix_palette(light=1, as_cmap=True)
sns.kdeplot(x, y, cmap=cmap, shade=True);
```
為了幫助您選擇更好的調色板或者 Colormap,您可以在 Jupyter notebook 中使用 [`choose_cubehelix_palette()`](../generated/seaborn.choose_cubehelix_palette.html#seaborn.choose_cubehelix_palette "seaborn.choose_cubehelix_palette") 函數來啟動互動界面幫助您測試、修改不同的參數。如果您希望函數返回一個 Colormap(而不是列表),則在例如像 `hexbin` 這樣的函數中設置 `as_Cmap=True`。
### 自定義調色板
為了更簡單地生成自定義順序調色板,您可以使用 [`light_palette()`](../generated/seaborn.light_palette.html#seaborn.light_palette "seaborn.light_palette") 或 [`dark_palette()`](../generated/seaborn.dark_palette.html#seaborn.dark_palette "seaborn.dark_palette") 函數。它們都是以某個顏色為種子,從明向暗或從暗向明漸變,產生順序調色板。與這些函數相搭配的還有 [`choose_light_palette()`](../generated/seaborn.choose_light_palette.html#seaborn.choose_light_palette "seaborn.choose_light_palette") 和 [`choose_dark_palette()`](../generated/seaborn.choose_dark_palette.html#seaborn.choose_dark_palette "seaborn.choose_dark_palette") 來提供交互式組件便于創建調色板。
```py
sns.palplot(sns.light_palette("green"))
```

```py
sns.palplot(sns.dark_palette("purple"))
```

這些調色板同樣可以被反轉。
```py
sns.palplot(sns.light_palette("navy", reverse=True))
```

這些調色板同樣可以被用來創建 Colormap 對象而不是顏色列表。
```py
pal = sns.dark_palette("palegreen", as_cmap=True)
sns.kdeplot(x, y, cmap=pal);
```
默認情況下,輸入可以是任何有效的 matplotlib 顏色。替代解釋由 `input` 參數控制。現在,您可以在 `hls` 或 `husl` 空間中提供元組以及默認的 `rgb`,您也可以使用任何有效的 `xkcd` 顏色來生成調色板。
```py
sns.palplot(sns.light_palette((210, 90, 60), input="husl"))
```

```py
sns.palplot(sns.dark_palette("muted purple", input="xkcd"))
```

注意,交互式調色板小部件的默認輸入空間是 `husl`,它不同于函數本身的默認設置,但是在這種情況下更有用。
## 發散調色板
第三類調色板稱為“發散調色板”(diverging)。當數據集的低值和高值都很重要,且數據集中有明確定義的中點時,這會是您的最佳選擇。例如,繪制溫度相對于基準時間點的變化圖時,最好使用發散 Colormap 來同時顯示溫度相對于基準值的上升和下降
選擇良好分散調色板的規則類似于良好的順序調色板。不過在這種情況時需要注意兩端顏色向中間顏色漸變時中間點的顏色不應該喧賓奪主,兩端的顏色也應該具有相似的亮度和飽和度。
這里還需要強調的是,應該避免使用紅色和綠色,因為需要考慮到[紅綠色盲](https://en.wikipedia.org/wiki/Color_blindness)患者的觀感。
不出所料,Color Brewer 庫也同樣提供了一些精心挑選的發散調色板。
```py
sns.palplot(sns.color_palette("BrBG", 7))
```

```py
sns.palplot(sns.color_palette("RdBu_r", 7))
```

matplotlib 庫中內置的 `coolwarm` 調色板也是一個很好的選擇。請注意,這個 Colormap 的中間值和極值之間的對比度較小。
```py
sns.palplot(sns.color_palette("coolwarm", 7))
```

### 自定義發散調色板
您可以使用 seaborn 的[`diverging_palette()`](../generated/seaborn.diverging_palette.html#seaborn.diverging_palette "seaborn.diverging_palette")函數來創建自定義 colormap 來描述發散數據(搭配有交互式組件[`choose_diverging_palette()`](../generated/seaborn.choose_diverging_palette.html#seaborn.choose_diverging_palette "seaborn.choose_diverging_palette"))。此函數使用 `husl` 顏色系統來創建發散調色板,您需要在函數中設置兩個色調參數(用度表示),也可以選擇設置兩端顏色的亮度和飽和度。 使用 `husl` 意味著兩端到中間點的色調變化將是平衡的。
```py
sns.palplot(sns.diverging_palette(220, 20, n=7))
```

```py
sns.palplot(sns.diverging_palette(145, 280, s=85, l=25, n=7))
```

`sep` 參數控制兩端到中間點色調變化的間隔。
```py
sns.palplot(sns.diverging_palette(10, 220, sep=80, n=7))
```

也可以將中間點的顏色設置成暗色而非亮色。
```py
sns.palplot(sns.diverging_palette(255, 133, l=60, n=7, center="dark"))
```

## 設置默認調色板
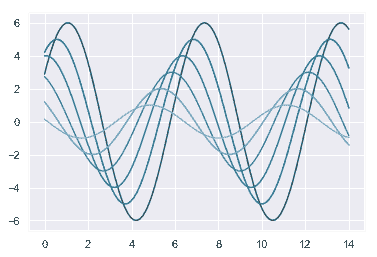
與[`color_palette()`](../generated/seaborn.color_palette.html#seaborn.color_palette "seaborn.color_palette")函數相伴隨的有[`set_palette()`](../generated/seaborn.set_palette.html#seaborn.set_palette "seaborn.set_palette")。 兩者之間的關系與[美學教程](aesthetics.html#aesthetics-tutorial)中介紹的[`set_palette()`](../generated/seaborn.set_palette.html#seaborn.set_palette "seaborn.set_palette")函數和[`color_palette()`](../generated/seaborn.color_palette.html#seaborn.color_palette "seaborn.color_palette")函數接受相同參數的關系相類似。但它會更改默認的 matplotlib 參數,以便調色板應用于所有圖像。
```py
def sinplot(flip=1):
x = np.linspace(0, 14, 100)
for i in range(1, 7):
plt.plot(x, np.sin(x + i * .5) * (7 - i) * flip)
```
```py
sns.set_palette("husl")
sinplot()
```

您可以在 `with` 語句中通過 [`color_palette()`](../generated/seaborn.color_palette.html#seaborn.color_palette "seaborn.color_palette") 函數來臨時改變調色板。
```py
with sns.color_palette("PuBuGn_d"):
sinplot()
```
- seaborn 0.9 中文文檔
- Seaborn 簡介
- 安裝和入門
- 可視化統計關系
- 可視化分類數據
- 可視化數據集的分布
- 線性關系可視化
- 構建結構化多圖網格
- 控制圖像的美學樣式
- 選擇調色板
- seaborn.relplot
- seaborn.scatterplot
- seaborn.lineplot
- seaborn.catplot
- seaborn.stripplot
- seaborn.swarmplot
- seaborn.boxplot
- seaborn.violinplot
- seaborn.boxenplot
- seaborn.pointplot
- seaborn.barplot
- seaborn.countplot
- seaborn.jointplot
- seaborn.pairplot
- seaborn.distplot
- seaborn.kdeplot
- seaborn.rugplot
- seaborn.lmplot
- seaborn.regplot
- seaborn.residplot
- seaborn.heatmap
- seaborn.clustermap
- seaborn.FacetGrid
- seaborn.FacetGrid.map
- seaborn.FacetGrid.map_dataframe
- seaborn.PairGrid
- seaborn.PairGrid.map
- seaborn.PairGrid.map_diag
- seaborn.PairGrid.map_offdiag
- seaborn.PairGrid.map_lower
- seaborn.PairGrid.map_upper
- seaborn.JointGrid
- seaborn.JointGrid.plot
- seaborn.JointGrid.plot_joint
- seaborn.JointGrid.plot_marginals
- seaborn.set
- seaborn.axes_style
- seaborn.set_style
- seaborn.plotting_context
- seaborn.set_context
- seaborn.set_color_codes
- seaborn.reset_defaults
- seaborn.reset_orig
- seaborn.set_palette
- seaborn.color_palette
- seaborn.husl_palette
- seaborn.hls_palette
- seaborn.cubehelix_palette
- seaborn.dark_palette
- seaborn.light_palette
- seaborn.diverging_palette
- seaborn.blend_palette
- seaborn.xkcd_palette
- seaborn.crayon_palette
- seaborn.mpl_palette
- seaborn.choose_colorbrewer_palette
- seaborn.choose_cubehelix_palette
- seaborn.choose_light_palette
- seaborn.choose_dark_palette
- seaborn.choose_diverging_palette
- seaborn.load_dataset
- seaborn.despine
- seaborn.desaturate
- seaborn.saturate
- seaborn.set_hls_values