
# seaborn.diverging_palette
> 譯者:[Modrisco](https://github.com/Modrisco)
```py
seaborn.diverging_palette(h_neg, h_pos, s=75, l=50, sep=10, n=6, center='light', as_cmap=False)
```
在兩個 HUSL 顏色直接建立一個發散調色板。
如果您在使用 IPython notebook,您還可以通過 [`choose_diverging_palette()`](seaborn.choose_diverging_palette.html#seaborn.choose_diverging_palette "seaborn.choose_diverging_palette") 函數交互式選擇調色板。
參數:`h_neg, h_pos`:float in [0, 359]
> 圖的正負范圍的錨定色調
`s`:[0, 100] 范圍內的浮點數,可選
> 圖的兩個范圍的錨定飽和度
`l`:[0, 100] 范圍內的浮點數,可選
> 圖的兩個范圍的錨定亮度
`n`:int,可選
> 調色板中的顏色數(如果為 not,返回一個 colormap)
`center`:{“light”, “dark”}, 可選
> 調色板中心為亮或暗
`as_cmap`:bool, 可選
> 如果為 true,返回一個 matplotlib colormap 而不是一個顏色列表。
返回值:`palette or cmap`:seaborn color palette or matplotlib colormap
> 類似列表的顏色對象的 RGB 元組,或者可以將連續值映射到顏色的 colormap 對象,具體取決于 `as_cmap` 參數的值。
另外
創建具有暗值的連續調色板。創建具有亮值的連續調色板。
例子
生成一個藍-白-紅調色板:
```py
>>> import seaborn as sns; sns.set()
>>> sns.palplot(sns.diverging_palette(240, 10, n=9))
```

生成一個更亮的綠-白-紫調色板:
```py
>>> sns.palplot(sns.diverging_palette(150, 275, s=80, l=55, n=9))
```

生成一個藍-黑-紅調色板:
```py
>>> sns.palplot(sns.diverging_palette(250, 15, s=75, l=40,
... n=9, center="dark"))
```

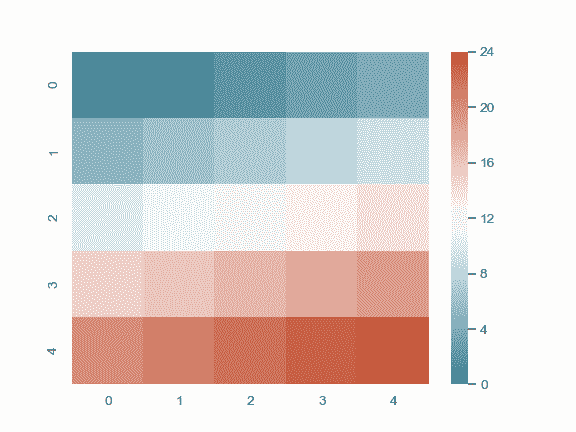
生成一個 colormap 對象:
```py
>>> from numpy import arange
>>> x = arange(25).reshape(5, 5)
>>> cmap = sns.diverging_palette(220, 20, sep=20, as_cmap=True)
>>> ax = sns.heatmap(x, cmap=cmap)
```
- seaborn 0.9 中文文檔
- Seaborn 簡介
- 安裝和入門
- 可視化統計關系
- 可視化分類數據
- 可視化數據集的分布
- 線性關系可視化
- 構建結構化多圖網格
- 控制圖像的美學樣式
- 選擇調色板
- seaborn.relplot
- seaborn.scatterplot
- seaborn.lineplot
- seaborn.catplot
- seaborn.stripplot
- seaborn.swarmplot
- seaborn.boxplot
- seaborn.violinplot
- seaborn.boxenplot
- seaborn.pointplot
- seaborn.barplot
- seaborn.countplot
- seaborn.jointplot
- seaborn.pairplot
- seaborn.distplot
- seaborn.kdeplot
- seaborn.rugplot
- seaborn.lmplot
- seaborn.regplot
- seaborn.residplot
- seaborn.heatmap
- seaborn.clustermap
- seaborn.FacetGrid
- seaborn.FacetGrid.map
- seaborn.FacetGrid.map_dataframe
- seaborn.PairGrid
- seaborn.PairGrid.map
- seaborn.PairGrid.map_diag
- seaborn.PairGrid.map_offdiag
- seaborn.PairGrid.map_lower
- seaborn.PairGrid.map_upper
- seaborn.JointGrid
- seaborn.JointGrid.plot
- seaborn.JointGrid.plot_joint
- seaborn.JointGrid.plot_marginals
- seaborn.set
- seaborn.axes_style
- seaborn.set_style
- seaborn.plotting_context
- seaborn.set_context
- seaborn.set_color_codes
- seaborn.reset_defaults
- seaborn.reset_orig
- seaborn.set_palette
- seaborn.color_palette
- seaborn.husl_palette
- seaborn.hls_palette
- seaborn.cubehelix_palette
- seaborn.dark_palette
- seaborn.light_palette
- seaborn.diverging_palette
- seaborn.blend_palette
- seaborn.xkcd_palette
- seaborn.crayon_palette
- seaborn.mpl_palette
- seaborn.choose_colorbrewer_palette
- seaborn.choose_cubehelix_palette
- seaborn.choose_light_palette
- seaborn.choose_dark_palette
- seaborn.choose_diverging_palette
- seaborn.load_dataset
- seaborn.despine
- seaborn.desaturate
- seaborn.saturate
- seaborn.set_hls_values