
# seaborn.distplot
> 譯者:[hyuuo](https://github.com/hyuuo)
```py
seaborn.distplot(a, bins=None, hist=True, kde=True, rug=False, fit=None, hist_kws=None, kde_kws=None, rug_kws=None, fit_kws=None, color=None, vertical=False, norm_hist=False, axlabel=None, label=None, ax=None)
```
靈活繪制單變量觀測值分布圖。
該函數結合了 matplotlib 中的 `hist`函數(自動計算一個默認的合適的 bin 大小)、seaborn 的[`kdeplot()`](seaborn.kdeplot.html#seaborn.kdeplot "seaborn.kdeplot")和[`rugplot()`](seaborn.rugplot.html#seaborn.rugplot "seaborn.rugplot")函數。它還可以擬合`scipy.stats`分布并在數據上繪制估計的 PDF(概率分布函數)。
參數:`a`:Series、1 維數組或者列表。
> 觀察數據。如果是具有`name`屬性的 Series 對象,則該名稱將用于標記數據軸。
`bins`:matplotlib hist()的參數,或 None。可選參數。
> 直方圖 bins(柱)的數目,若填 None,則默認使用 Freedman-Diaconis 規則指定柱的數目。
`hist`:布爾值,可選參數。
> 是否繪制(標準化)直方圖。
`kde`:布爾值,可選參數。
> 是否繪制高斯核密度估計圖。
`rug`:布爾值,可選參數。
> 是否在橫軸上繪制觀測值豎線。
`fit`:隨機變量對象,可選參數。
> 一個帶有*fit*方法的對象,返回一個元組,該元組可以傳遞給*pdf*方法一個位置參數,該位置參數遵循一個值的網格用于評估 pdf。
`{hist, kde, rug, fit}_kws`:字典,可選參數。
> 底層繪圖函數的關鍵字參數。
`color`:matplotlib color,可選參數。
> 可以繪制除了擬合曲線之外所有內容的顏色。
`vertical`:布爾值,可選參數。
> 如果為 True,則觀測值在 y 軸顯示。
`norm_hist`:布爾值,可選參數。
> 如果為 True,則直方圖的高度顯示密度而不是計數。如果繪制 KDE 圖或擬合密度,則默認為 True。
`axlabel`:字符串,False 或者 None,可選參數。
> 橫軸的名稱。如果為 None,將嘗試從 a.name 獲取它;如果為 False,則不設置標簽。
`label`:字符串,可選參數。
> 圖形相關組成部分的圖例標簽。
`ax`:matplotlib axis,可選參數。
> 若提供該參數,則在參數設定的軸上繪圖。
返回值:`ax`:matplotlib Axes
> 返回 Axes 對象以及用于進一步調整的繪圖。
**另請參見**
[`kdeplot`](seaborn.kdeplot.html#seaborn.kdeplot "seaborn.kdeplot")
顯示具有核密度估計圖的單變量或雙變量分布。
[`rugplot`](seaborn.rugplot.html#seaborn.rugplot "seaborn.rugplot")
繪制小的垂直線以顯示分布中的每個觀測值。
**范例**
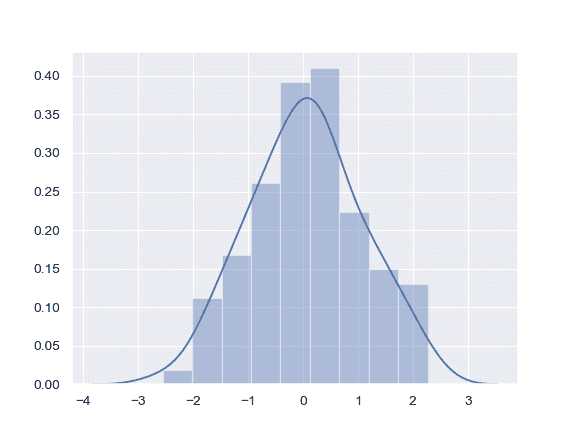
顯示具有核密度估計的默認圖和使用參考規則自動確定 bin 大小的直方圖:
```py
>>> import seaborn as sns, numpy as np
>>> sns.set(); np.random.seed(0)
>>> x = np.random.randn(100)
>>> ax = sns.distplot(x)
```
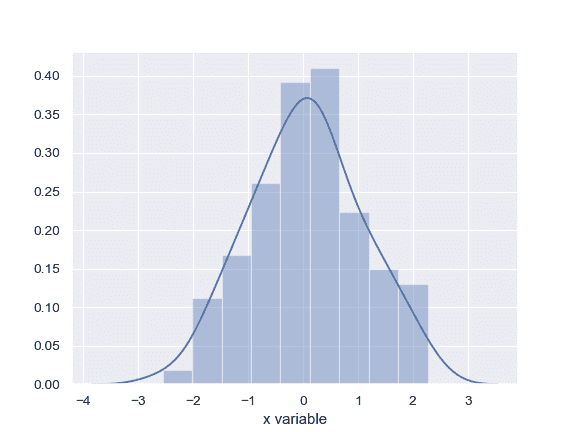
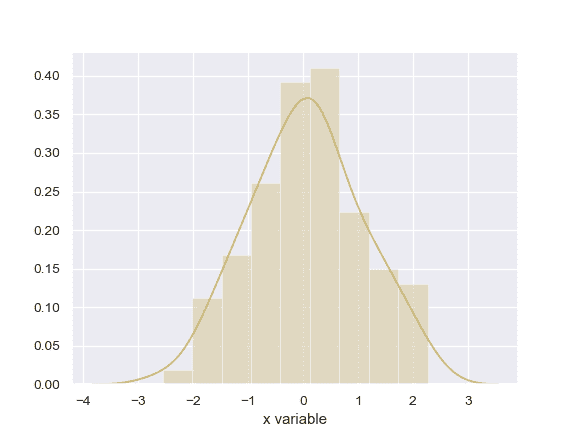
使用 Pandas 對象獲取信息軸標簽:
```py
>>> import pandas as pd
>>> x = pd.Series(x, name="x variable")
>>> ax = sns.distplot(x)
```
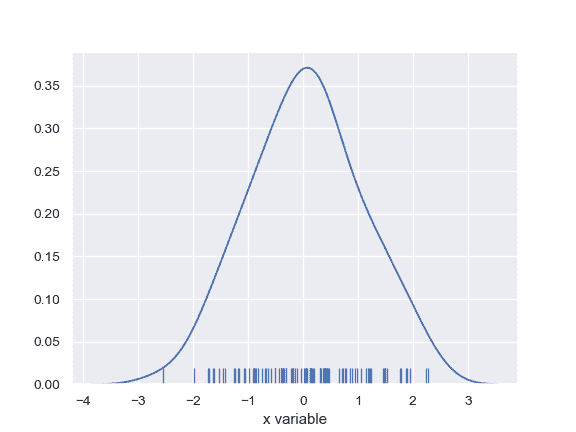
使用核密度估計和小的垂直線繪制分布圖:
```py
>>> ax = sns.distplot(x, rug=True, hist=False)
```
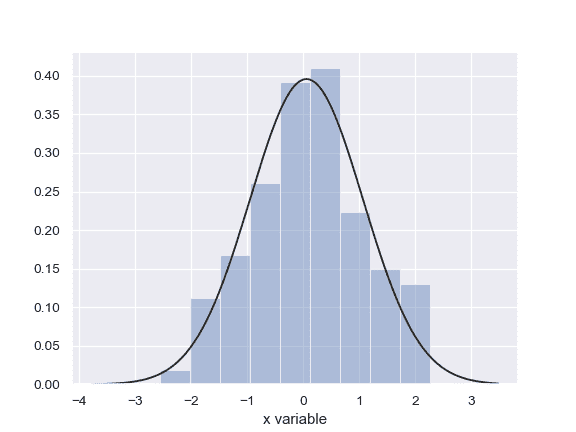
使用直方圖和最大似然高斯分布擬合繪制分布圖:
```py
>>> from scipy.stats import norm
>>> ax = sns.distplot(x, fit=norm, kde=False)
```
在垂直軸上繪制分布圖:
```py
>>> ax = sns.distplot(x, vertical=True)
```

更改所有繪圖元素的顏色:
```py
>>> sns.set_color_codes()
>>> ax = sns.distplot(x, color="y")
```
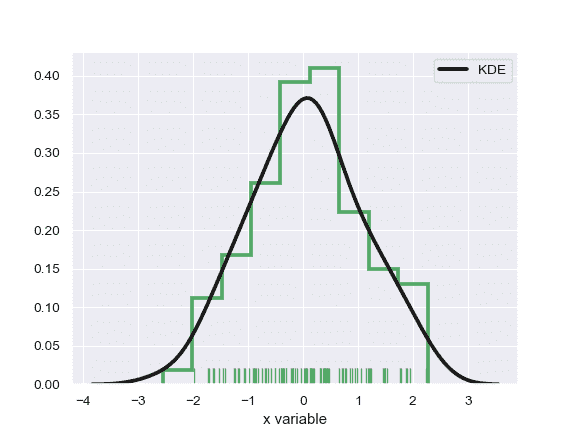
將特定參數傳遞給基礎繪圖函數:
```py
>>> ax = sns.distplot(x, rug=True, rug_kws={"color": "g"},
... kde_kws={"color": "k", "lw": 3, "label": "KDE"},
... hist_kws={"histtype": "step", "linewidth": 3,
... "alpha": 1, "color": "g"})
```
- seaborn 0.9 中文文檔
- Seaborn 簡介
- 安裝和入門
- 可視化統計關系
- 可視化分類數據
- 可視化數據集的分布
- 線性關系可視化
- 構建結構化多圖網格
- 控制圖像的美學樣式
- 選擇調色板
- seaborn.relplot
- seaborn.scatterplot
- seaborn.lineplot
- seaborn.catplot
- seaborn.stripplot
- seaborn.swarmplot
- seaborn.boxplot
- seaborn.violinplot
- seaborn.boxenplot
- seaborn.pointplot
- seaborn.barplot
- seaborn.countplot
- seaborn.jointplot
- seaborn.pairplot
- seaborn.distplot
- seaborn.kdeplot
- seaborn.rugplot
- seaborn.lmplot
- seaborn.regplot
- seaborn.residplot
- seaborn.heatmap
- seaborn.clustermap
- seaborn.FacetGrid
- seaborn.FacetGrid.map
- seaborn.FacetGrid.map_dataframe
- seaborn.PairGrid
- seaborn.PairGrid.map
- seaborn.PairGrid.map_diag
- seaborn.PairGrid.map_offdiag
- seaborn.PairGrid.map_lower
- seaborn.PairGrid.map_upper
- seaborn.JointGrid
- seaborn.JointGrid.plot
- seaborn.JointGrid.plot_joint
- seaborn.JointGrid.plot_marginals
- seaborn.set
- seaborn.axes_style
- seaborn.set_style
- seaborn.plotting_context
- seaborn.set_context
- seaborn.set_color_codes
- seaborn.reset_defaults
- seaborn.reset_orig
- seaborn.set_palette
- seaborn.color_palette
- seaborn.husl_palette
- seaborn.hls_palette
- seaborn.cubehelix_palette
- seaborn.dark_palette
- seaborn.light_palette
- seaborn.diverging_palette
- seaborn.blend_palette
- seaborn.xkcd_palette
- seaborn.crayon_palette
- seaborn.mpl_palette
- seaborn.choose_colorbrewer_palette
- seaborn.choose_cubehelix_palette
- seaborn.choose_light_palette
- seaborn.choose_dark_palette
- seaborn.choose_diverging_palette
- seaborn.load_dataset
- seaborn.despine
- seaborn.desaturate
- seaborn.saturate
- seaborn.set_hls_values