
# seaborn.cubehelix_palette
> 譯者:[Modrisco](https://github.com/Modrisco)
```py
seaborn.cubehelix_palette(n_colors=6, start=0, rot=0.4, gamma=1.0, hue=0.8, light=0.85, dark=0.15, reverse=False, as_cmap=False)
```
用 cubehelix 系統制作順序調色板。
生成亮度呈線性減小(或增大)的 colormap。這意味著 colormap 在轉換為黑白模式時(用于打印)的信息將得到保留,且對色盲友好。“cubehelix” 也可以作為基于 matplotlib 的調色板使用,但此函數使用戶可以更好地控制調色板的外觀,并且具有一組不同的默認值。
除了使用這個函數,還可以在 seaborn 中使用字符串速記生成 cubehelix 調色板。 請參見下面的示例。
參數:`n_colors`:int
> 調色板中的顏色數。
`start`:float, 0 <= start <= 3
> 第一個色調。
`rot`:float
> 圍繞調色板范圍內的色相控制盤旋轉。
`gamma`:float 0 <= gamma
> Gamma 系數用以強調較深 (Gamma < 1) 或較淺 (Gamma > 1) 的顏色。
`hue`:float, 0 <= hue <= 1
> 顏色的飽和度。
`dark`:float 0 <= dark <= 1
> 調色板中最暗顏色的強度。
`light`:float 0 <= light <= 1
> 調色板中最淺顏色的強度。
`reverse`:bool
> 如果為 True 值,則調色板將從暗到亮。
`as_cmap`:bool
> 如果為 True 值,則返回 matplotlib colormap 而不是顏色列表。
返回值:`palette or cmap`:seaborn 調色板或者 matplotlib colormap
> 類似列表的顏色對象的 RGB 元組,或者可以將連續值映射到顏色的 colormap 對象,具體取決于 `as_cmap` 參數的值。
另外
啟動交互式小部件以調整 cubehelix 調色板參數。創建具有暗低值的連續調色板。創建具有亮低值的連續調色板。
參考
Green, D. A. (2011). “一種用于顯示天文強度圖像的配色方案”. Bulletin of the Astromical Society of India, Vol. 39, p. 289-295.
例子
生成默認調色板:
```py
>>> import seaborn as sns; sns.set()
>>> sns.palplot(sns.cubehelix_palette())
```

從相同的起始位置向后旋轉:
```py
>>> sns.palplot(sns.cubehelix_palette(rot=-.4))
```

使用不同的起點和較短的旋轉:
```py
>>> sns.palplot(sns.cubehelix_palette(start=2.8, rot=.1))
```

反轉亮度漸變方向:
```py
>>> sns.palplot(sns.cubehelix_palette(reverse=True))
```

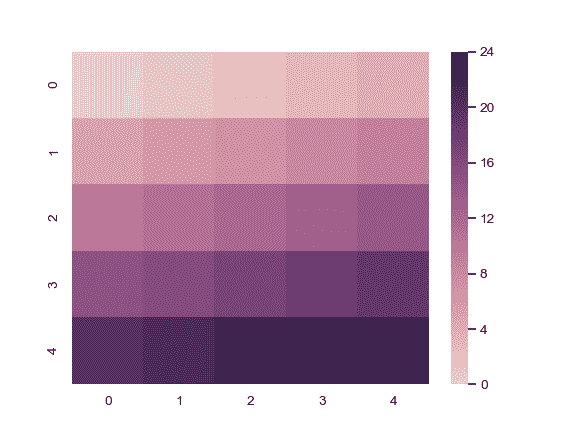
生成一個 colormap 對象:
```py
>>> from numpy import arange
>>> x = arange(25).reshape(5, 5)
>>> cmap = sns.cubehelix_palette(as_cmap=True)
>>> ax = sns.heatmap(x, cmap=cmap)
```
使用完整的亮度范圍:
```py
>>> cmap = sns.cubehelix_palette(dark=0, light=1, as_cmap=True)
>>> ax = sns.heatmap(x, cmap=cmap)
```

使用 [`color_palette()`](seaborn.color_palette.html#seaborn.color_palette "seaborn.color_palette") 函數接口:
```py
>>> sns.palplot(sns.color_palette("ch:2,r=.2,l=.6"))
```

- seaborn 0.9 中文文檔
- Seaborn 簡介
- 安裝和入門
- 可視化統計關系
- 可視化分類數據
- 可視化數據集的分布
- 線性關系可視化
- 構建結構化多圖網格
- 控制圖像的美學樣式
- 選擇調色板
- seaborn.relplot
- seaborn.scatterplot
- seaborn.lineplot
- seaborn.catplot
- seaborn.stripplot
- seaborn.swarmplot
- seaborn.boxplot
- seaborn.violinplot
- seaborn.boxenplot
- seaborn.pointplot
- seaborn.barplot
- seaborn.countplot
- seaborn.jointplot
- seaborn.pairplot
- seaborn.distplot
- seaborn.kdeplot
- seaborn.rugplot
- seaborn.lmplot
- seaborn.regplot
- seaborn.residplot
- seaborn.heatmap
- seaborn.clustermap
- seaborn.FacetGrid
- seaborn.FacetGrid.map
- seaborn.FacetGrid.map_dataframe
- seaborn.PairGrid
- seaborn.PairGrid.map
- seaborn.PairGrid.map_diag
- seaborn.PairGrid.map_offdiag
- seaborn.PairGrid.map_lower
- seaborn.PairGrid.map_upper
- seaborn.JointGrid
- seaborn.JointGrid.plot
- seaborn.JointGrid.plot_joint
- seaborn.JointGrid.plot_marginals
- seaborn.set
- seaborn.axes_style
- seaborn.set_style
- seaborn.plotting_context
- seaborn.set_context
- seaborn.set_color_codes
- seaborn.reset_defaults
- seaborn.reset_orig
- seaborn.set_palette
- seaborn.color_palette
- seaborn.husl_palette
- seaborn.hls_palette
- seaborn.cubehelix_palette
- seaborn.dark_palette
- seaborn.light_palette
- seaborn.diverging_palette
- seaborn.blend_palette
- seaborn.xkcd_palette
- seaborn.crayon_palette
- seaborn.mpl_palette
- seaborn.choose_colorbrewer_palette
- seaborn.choose_cubehelix_palette
- seaborn.choose_light_palette
- seaborn.choose_dark_palette
- seaborn.choose_diverging_palette
- seaborn.load_dataset
- seaborn.despine
- seaborn.desaturate
- seaborn.saturate
- seaborn.set_hls_values