
# seaborn.heatmap
> 譯者:[hyuuo](https://github.com/hyuuo)
```py
seaborn.heatmap(data, vmin=None, vmax=None, cmap=None, center=None, robust=False, annot=None, fmt='.2g', annot_kws=None, linewidths=0, linecolor='white', cbar=True, cbar_kws=None, cbar_ax=None, square=False, xticklabels='auto', yticklabels='auto', mask=None, ax=None, **kwargs)
```
將矩形數據繪制為顏色編碼矩陣。
這是一個坐標軸級的函數,如果沒有提供給`ax`參數,它會將熱力圖繪制到當前活動的軸中。除非`cbar`為 False 或為`cbar_ax`提供單獨的 Axes,否則將使用此軸空間的一部分繪制顏色圖。
參數:`data`:矩形數據集
> 可以強制轉換為 ndarray 格式數據的 2 維數據集。如果提供了 Pandas DataFrame 數據,索引/列信息將用于標記列和行。
`vmin, vmax`:浮點型數據,可選參數。
> 用于錨定色彩映射的值,否則它們是從數據和其他關鍵字參數推斷出來的。
`cmap`:matplotlib 顏色條名稱或者對象,或者是顏色列表,可選參數。
> 從數據值到顏色空間的映射。 如果沒有提供,默認值將取決于是否設置了“center”。
`center`:浮點數,可選參數。
> 繪制有色數據時將色彩映射居中的值。 如果沒有指定,則使用此參數將更改默認的`cmap`。
`robust`:布爾值,可選參數。
> 如果是 True,并且`vmin`或`vmax`為空,則使用穩健分位數而不是極值來計算色彩映射范圍。
`annot`:布爾值或者矩形數據,可選參數。
> 如果為 True,則在每個熱力圖單元格中寫入數據值。 如果數組的形狀與`data`相同,則使用它來代替原始數據注釋熱力圖。
`fmt`:字符串,可選參數。
> 添加注釋時要使用的字符串格式代碼。
`annot_kws`:字典或者鍵值對,可選參數。
> 當`annot`為 True 時,`ax.text`的關鍵字參數。
`linewidths`:浮點數,可選參數。
> 劃分每個單元格的行的寬度。
`linecolor`:顏色,可選參數
> 劃分每個單元的線條的顏色。
`cbar`:布爾值,可選參數。
> 描述是否繪制顏色條。
`cbar_kws`:字典或者鍵值對,可選參數。
> *fig.colorbar*的關鍵字參數。
`cbar_ax`:matplotlib Axes,可選參數。
> 用于繪制顏色條的軸,否則從主軸獲取。
`square`:布爾值,可選參數。
> 如果為 True,則將坐標軸方向設置為“equal”,以使每個單元格為方形。
`xticklabels, yticklabels`:“auto”,布爾值,類列表值,或者整形數值,可選參數。
> 如果為 True,則繪制數據框的列名稱。如果為 False,則不繪制列名稱。如果是列表,則將這些替代標簽繪制為 xticklabels。如果是整數,則使用列名稱,但僅繪制每個 n 標簽。如果是“auto”,將嘗試密集繪制不重疊的標簽。
`mask`:布爾數組或者 DataFrame 數據,可選參數。
> 如果為空值,數據將不會顯示在`mask`為 True 的單元格中。 具有缺失值的單元格將自動被屏蔽。
`ax`:matplotlib Axes,可選參數。
> 繪制圖的坐標軸,否則使用當前活動的坐標軸。
`kwargs`:其他關鍵字參數。
> 所有其他關鍵字參數都傳遞給`ax.pcolormesh`。
返回值:`ax`:matplotlib Axes
> 熱力圖的軸對象。
**另請參見**
[`clustermap`](seaborn.clustermap.html#seaborn.clustermap "seaborn.clustermap")
使用分層聚類繪制矩陣以排列行和列。
范例
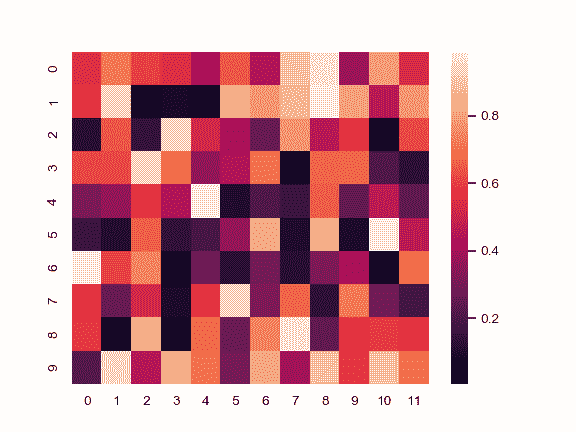
為 numpy 數組繪制熱力圖:
```py
>>> import numpy as np; np.random.seed(0)
>>> import seaborn as sns; sns.set()
>>> uniform_data = np.random.rand(10, 12)
>>> ax = sns.heatmap(uniform_data)
```
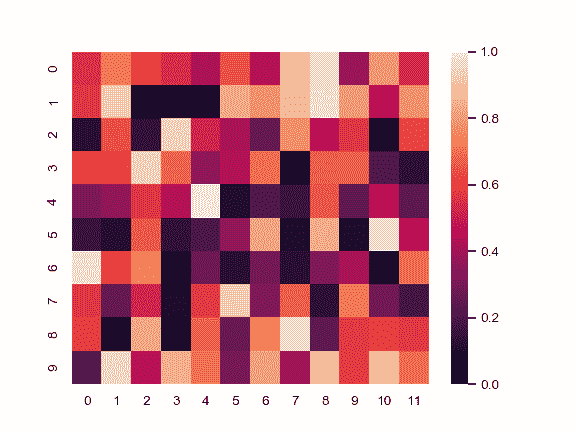
更改默認的 colormap 范圍:
```py
>>> ax = sns.heatmap(uniform_data, vmin=0, vmax=1)
```
使用發散色圖繪制以 0 為中心的數據的熱力圖:
```py
>>> normal_data = np.random.randn(10, 12)
>>> ax = sns.heatmap(normal_data, center=0)
```

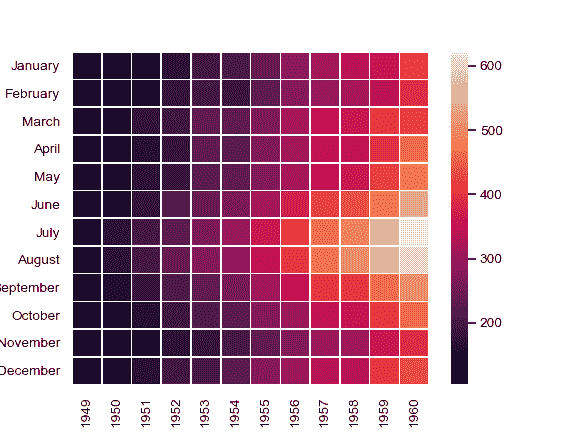
使用特定的行和列標簽繪制 dataframe:
```py
>>> flights = sns.load_dataset("flights")
>>> flights = flights.pivot("month", "year", "passengers")
>>> ax = sns.heatmap(flights)
```

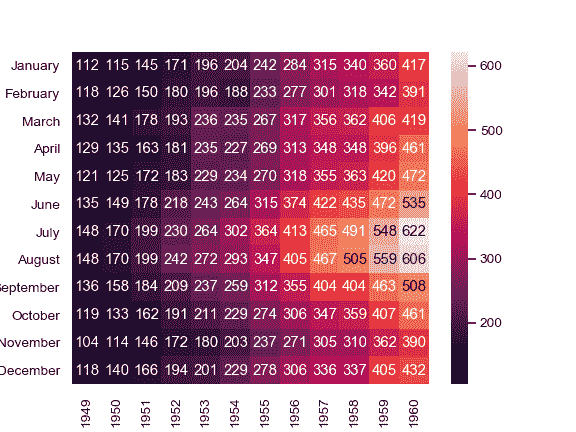
使用整數格式的數字值注釋每個小單元格:
```py
>>> ax = sns.heatmap(flights, annot=True, fmt="d")
```
在每個單元格之間添加線:
```py
>>> ax = sns.heatmap(flights, linewidths=.5)
```
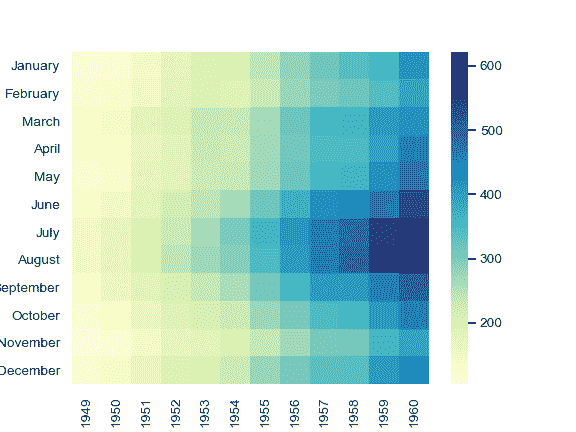
使用不同的 colormap:
```py
>>> ax = sns.heatmap(flights, cmap="YlGnBu")
```
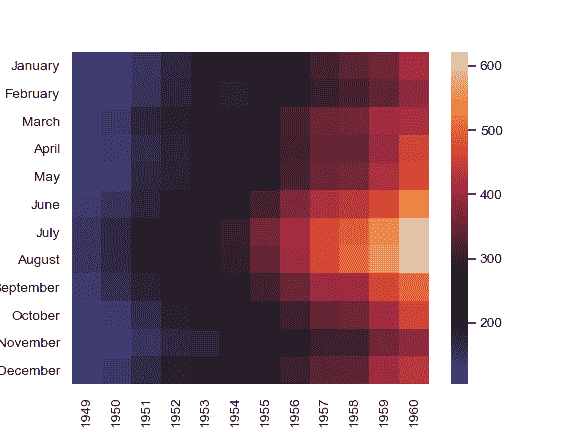
將 colormap 置于特定值的中心:
```py
>>> ax = sns.heatmap(flights, center=flights.loc["January", 1955])
```
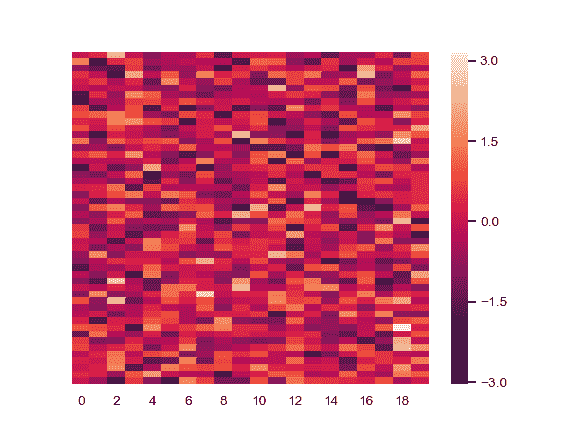
繪制每個其他列標簽,而不繪制行標簽:
```py
>>> data = np.random.randn(50, 20)
>>> ax = sns.heatmap(data, xticklabels=2, yticklabels=False)
```
不繪制顏色條:
```py
>>> ax = sns.heatmap(flights, cbar=False)
```

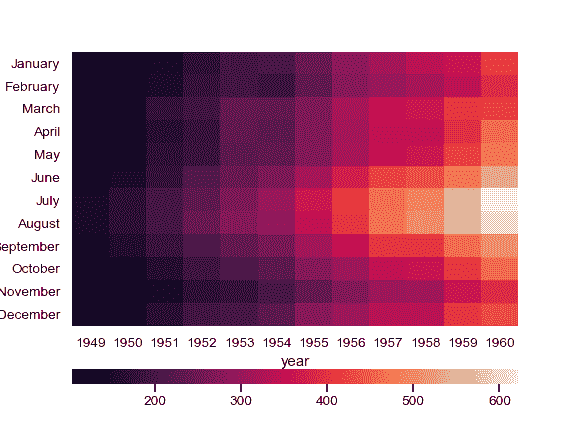
在不同的坐標軸方向繪制顏色條:
```py
>>> grid_kws = {"height_ratios": (.9, .05), "hspace": .3}
>>> f, (ax, cbar_ax) = plt.subplots(2, gridspec_kw=grid_kws)
>>> ax = sns.heatmap(flights, ax=ax,
... cbar_ax=cbar_ax,
... cbar_kws={"orientation": "horizontal"})
```
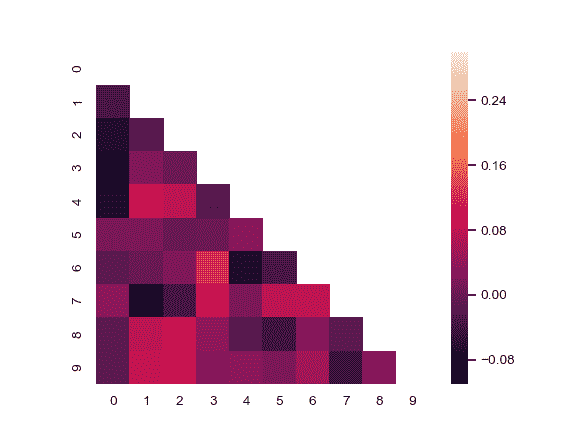
使用遮罩繪制矩陣中的一部分
```py
>>> corr = np.corrcoef(np.random.randn(10, 200))
>>> mask = np.zeros_like(corr)
>>> mask[np.triu_indices_from(mask)] = True
>>> with sns.axes_style("white"):
... ax = sns.heatmap(corr, mask=mask, vmax=.3, square=True)
```
- seaborn 0.9 中文文檔
- Seaborn 簡介
- 安裝和入門
- 可視化統計關系
- 可視化分類數據
- 可視化數據集的分布
- 線性關系可視化
- 構建結構化多圖網格
- 控制圖像的美學樣式
- 選擇調色板
- seaborn.relplot
- seaborn.scatterplot
- seaborn.lineplot
- seaborn.catplot
- seaborn.stripplot
- seaborn.swarmplot
- seaborn.boxplot
- seaborn.violinplot
- seaborn.boxenplot
- seaborn.pointplot
- seaborn.barplot
- seaborn.countplot
- seaborn.jointplot
- seaborn.pairplot
- seaborn.distplot
- seaborn.kdeplot
- seaborn.rugplot
- seaborn.lmplot
- seaborn.regplot
- seaborn.residplot
- seaborn.heatmap
- seaborn.clustermap
- seaborn.FacetGrid
- seaborn.FacetGrid.map
- seaborn.FacetGrid.map_dataframe
- seaborn.PairGrid
- seaborn.PairGrid.map
- seaborn.PairGrid.map_diag
- seaborn.PairGrid.map_offdiag
- seaborn.PairGrid.map_lower
- seaborn.PairGrid.map_upper
- seaborn.JointGrid
- seaborn.JointGrid.plot
- seaborn.JointGrid.plot_joint
- seaborn.JointGrid.plot_marginals
- seaborn.set
- seaborn.axes_style
- seaborn.set_style
- seaborn.plotting_context
- seaborn.set_context
- seaborn.set_color_codes
- seaborn.reset_defaults
- seaborn.reset_orig
- seaborn.set_palette
- seaborn.color_palette
- seaborn.husl_palette
- seaborn.hls_palette
- seaborn.cubehelix_palette
- seaborn.dark_palette
- seaborn.light_palette
- seaborn.diverging_palette
- seaborn.blend_palette
- seaborn.xkcd_palette
- seaborn.crayon_palette
- seaborn.mpl_palette
- seaborn.choose_colorbrewer_palette
- seaborn.choose_cubehelix_palette
- seaborn.choose_light_palette
- seaborn.choose_dark_palette
- seaborn.choose_diverging_palette
- seaborn.load_dataset
- seaborn.despine
- seaborn.desaturate
- seaborn.saturate
- seaborn.set_hls_values