
### Echarts實現地圖高亮輪播
*****
前言:地圖數據定時選中時經典展示之一吧,最近剛好使用到,在此順便記錄保存一個案例,以備不時之需,如下圖:

### 下面開始準備
*****
* 前往[下載china.json](http://datav.aliyun.com/tools/atlas/index.html),并保存文件到工程中;
* 導入 `import gzData from './china.json'`
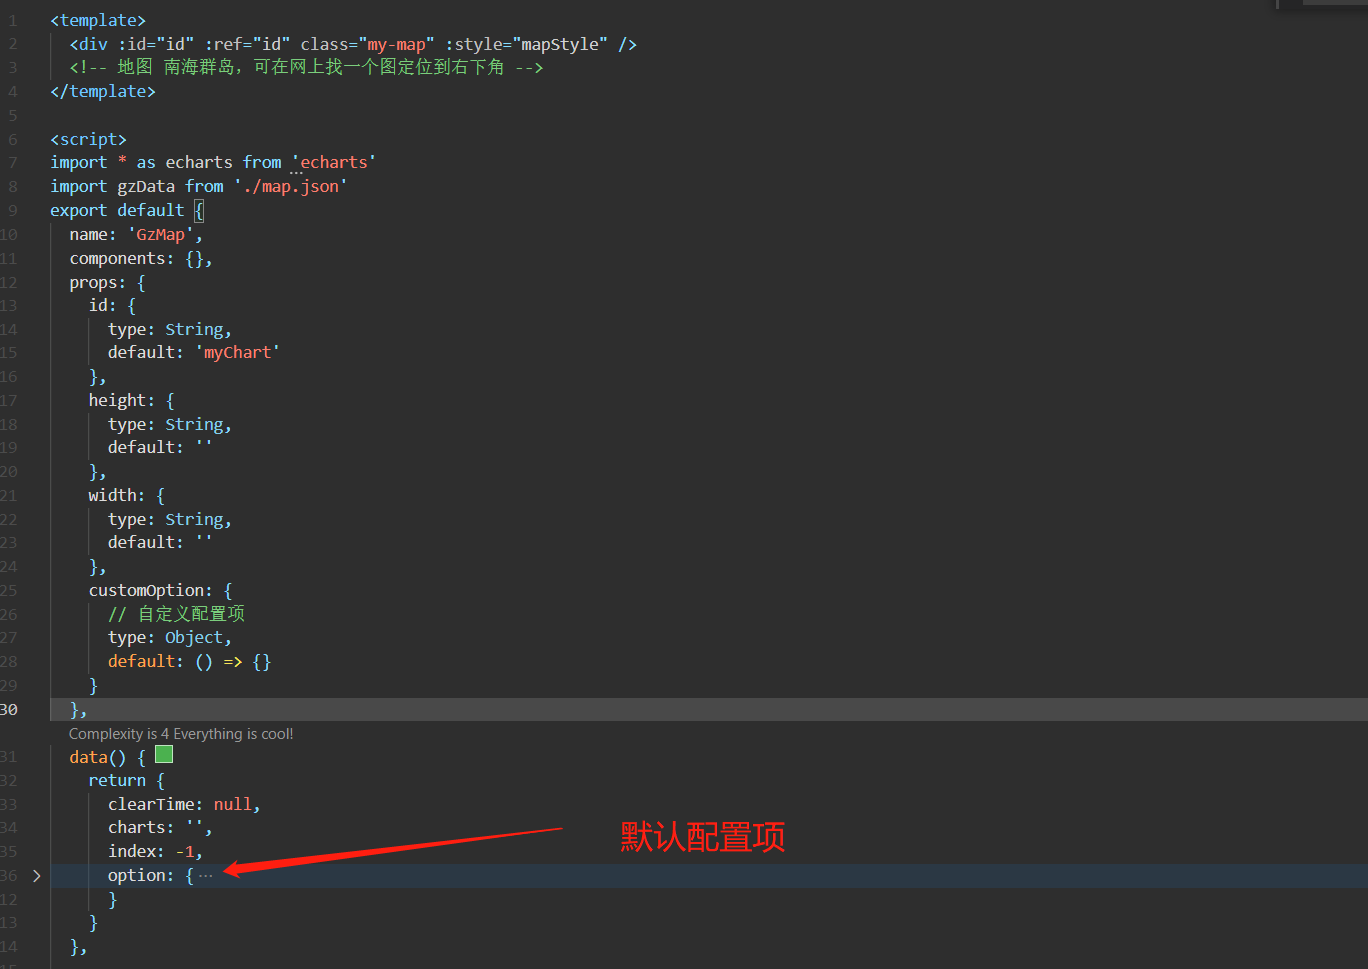
* 組件中添加:
```
<template>
??<div?:id="id"?:ref="id"?class="my-map"?:style="mapStyle"?/>
</template>
```
* 視圖更新完成,**掛載**
```
setMyEchart()?{
??????const?myChart?=?this.$refs[this.id]?//?通過ref獲取到DOM節點
??????if?(myChart)?{
????????const?eChart?=?echarts.init(myChart)?//?調取Echarts的初始化方法
????????this.charts?=?eChart
????????const?option?=?{?...this.option,?...this.customOption?}?//?配置項合并
????????eChart.setOption(option)?//?配置項掛載
????????window.addEventListener('resize',?function()?{
??????????eChart.resize()?//?重繪
????????})
??????}
?},
```
* 定時輪播,借助以下`dispatchAction()`的不同type類型,實現選中和清空
```
//?清除當前地圖區塊的高亮
this.charts.dispatchAction({
??????????type:?'downplay',
??????????seriesIndex:?0,
??????????dataIndex:?this.index
})
????????this.index++
//?當前地圖區塊下標高亮
this.charts.dispatchAction({
??????????type:?'highlight',
??????????seriesIndex:?0,
??????????dataIndex:?this.index
?})
//?tooltip?跟隨顯示
this.charts.dispatchAction({
??????????type:?'showTip',
??????????seriesIndex:?0,
??????????dataIndex:?this.index
})
```
* 加上定時輪播
```
mouseEvents()?{
??????//?鼠標劃入
??????this.charts.on('mouseover',?()?=>?{
????????//?停止定時器
????????clearInterval(this.clearTime)
????????this.clearTime?=?null
????????//?清除之前的高亮
????????this.charts.dispatchAction({
??????????type:?'downplay',
??????????seriesIndex:?0,
??????????dataIndex:?this.index
????????})
??????})
??????//?鼠標劃出重新開始定時器
??????this.charts.on('mouseout',?()?=>?{
????????this.mapActive()
??????})
?}
```
* 父組件使用
```
<MapEchart?style="height:?412px;?width:?100%;"?/>
```
### 最后附上組件代碼:
*****
```
<template>
<div :id="id" :ref="id" class="my-map" :style="mapStyle" />
<!-- 地圖 南海群島,可在網上找一個圖定位到右下角 -->
</template>
<script>
import * as echarts from 'echarts'
import gzData from './map.json'
export default {
name: 'GzMap',
components: {},
props: {
id: {
type: String,
default: 'myChart'
},
height: {
type: String,
default: ''
},
width: {
type: String,
default: ''
},
customOption: {
// 自定義配置項
type: Object,
default: () => {}
}
},
data() {
return {
clearTime: null,
charts: '',
index: -1,
option: {
tooltip: {
backgroundColor: 'rgba(0,0,0,0)', // 窗口外框
trigger: 'item'
},
series: [
{
tooltip: {
// 顯示的窗口
trigger: 'item',
formatter: function(item) {
var tipHtml = ''
tipHtml = `<div style="padding: 6px 12px;font-size: 12px;color:#fff;border-radius:6px;background-color:rgba(230, 93, 110, 0.6);">${item.data.name}: <span style="color:#FEC171;font-size:14px;">${item.value}萬</span> </div>`
return tipHtml
},
borderWidth: 0
},
name: '中國各省數據',
type: 'map',
map: '中國', // 自定義擴展圖表類型
zoom: 0.75, // 縮放
roam: true, // 允許縮放,移動
showLegendSymbol: true,
label: {
// 文字
show: true,
color: '#fff',
fontSize: 10
},
itemStyle: {
// 地圖樣式
borderColor: 'rgba(147, 235, 248, 1)',
borderWidth: 1,
areaColor: {
type: 'radial',
x: 0.5,
y: 0.5,
r: 0.8,
colorStops: [
{
offset: 0,
color: 'rgba(24, 146, 121, 0.8)' // 0% 處的顏色
},
{
offset: 1,
color: 'rgba(24, 146, 121, 1)' // 100% 處的顏色
}
],
globalCoord: false // 缺省為 false
},
shadowColor: 'rgba(24, 146, 121, 1)',
shadowOffsetX: -1,
shadowOffsetY: 3,
shadowBlur: 10
},
emphasis: {
// 鼠標移入動態的時候顯示的默認樣式
itemStyle: {
areaColor: '#E65D6E',
borderColor: '#C03639',
borderWidth: 1
},
label: {
show: true, // 文字
color: '#FEC171',
fontSize: 10
}
},
layoutCenter: ['50%', '65%'],
layoutSize: '160%',
markPoint: {
symbol: 'none'
},
data: [] // 數據,可在setOption()掛載前設置即可
}
]
}
}
},
computed: {
mapStyle() {
return {
height: this.height,
width: this.width
}
}
},
mounted() {},
created() {
echarts.registerMap('中國', gzData)
this.getData()
},
methods: {
// 掛在
setMyEchart() {
const myChart = this.$refs[this.id] // 通過ref獲取到DOM節點
if (myChart) {
const eChart = echarts.init(myChart) // 調取Echarts的初始化方法
this.charts = eChart
this.mapActive()
this.mouseEvents()
const option = { ...this.option, ...this.customOption } // 配置項合并
eChart.setOption(option) // 配置項掛載
window.addEventListener('resize', function() {
eChart.resize() // 重繪
})
}
},
mouseEvents() {
// 鼠標劃入
this.charts.on('mouseover', () => {
// 停止定時器
clearInterval(this.clearTime)
this.clearTime = null
// 清除之前的高亮
this.charts.dispatchAction({
type: 'downplay',
seriesIndex: 0,
dataIndex: this.index
})
})
// 鼠標劃出重新開始定時器
this.charts.on('mouseout', () => {
this.mapActive()
})
},
// 高亮輪播
mapActive() {
const dataLength = gzData.features.length
// 用定時器控制高亮
this.clearTime = setInterval(() => {
// 清除當前地圖區塊的高亮
this.charts.dispatchAction({
type: 'downplay',
seriesIndex: 0,
dataIndex: this.index
})
this.index++
// 當前地圖區塊下標高亮
this.charts.dispatchAction({
type: 'highlight',
seriesIndex: 0,
dataIndex: this.index
})
// tooltip 跟隨顯示
this.charts.dispatchAction({
type: 'showTip',
seriesIndex: 0,
dataIndex: this.index
})
if (this.index > dataLength) {
this.index = 0
}
}, 2000)
},
/**
* 模擬地圖數據請求
* 這個本不應該在組件內請求,本組件只作為一個公共地圖組件
* 應當通過父組件傳遞,可結合watch進行處理和掛載數據
* 具體視情況而定
*/
getData() {
setTimeout(() => {
// 模擬異步請求數據
this.option.series[0].data = gzData.features.map(item => {
return {
value: (Math.random() * 10000).toFixed(2), // 隨機生成替代,當實際情況應當和Ajax請求數據,通過item.properties.name與實際數據匹配,從而取到實際數據value
name: item.properties.name
}
})
this.$nextTick(() => {
this.setMyEchart() // 頁面掛載完成后執行,此時不宜在mounted生命周期執行,因為他執行時間或許小于請求時間(500ms)
})
}, 500) // 假設請求花了500ms
}
}
}
</script>
<style lang="scss" scoped>
.my-map {
width: 100%;
height: 100%;
}
</style>
```
### 其他
*****
[參考文章](https://juejin.cn/post/6997978246839042079):https://juejin.cn/post/6997978246839042079
- 首頁
- 2021年
- 基礎知識
- 同源策略
- 跨域
- css
- less
- scss
- reset
- 超出文本顯示省略號
- 默認滾動條
- 清除浮動
- line-height與vertical-align
- box-sizing
- 動畫
- 布局
- JavaScript
- 設計模式
- 深淺拷貝
- 排序
- canvas
- 防抖節流
- 獲取屏幕/可視區域寬高
- 正則
- 重繪重排
- rem換算
- 手寫算法
- apply、call和bind原理與實現
- this的理解-普通函數、箭頭函數
- node
- nodejs
- express
- koa
- egg
- 基于nodeJS的全棧項目
- 小程序
- 常見問題
- ec-canvas之橫豎屏切換重繪
- 公眾號后臺基本配置
- 小程序發布協議更新
- 小程序引入iconfont字體
- Uni-app
- 環境搭建
- 項目搭建
- 數據庫
- MySQL數據庫安裝
- 數據庫圖形化界面常用命令行
- cmd命令行操作數據庫
- Redis安裝
- APP
- 控制縮放meta
- GIT
- 常用命令
- vsCode
- 常用插件
- Ajax
- axios-services
- 文章
- 如何讓代碼更加優雅
- 虛擬滾動
- 網站收藏
- 防抖節流之定時器清除問題
- 號稱破解全網會員的腳本
- 資料筆記
- 資料筆記2
- 公司面試題
- 服務器相關
- 前端自動化部署-jenkins
- nginx.conf配置
- https添加證書
- shell基本命令
- 微型ssh-deploy前端部署插件
- webpack
- 深入理解loader
- 深入理解plugin
- webpack注意事項
- vite和webpack區別
- React
- react+antd搭建
- Vue
- vue-cli
- vue.config.js
- 面板分割左右拖動
- vvmily-admin-template
- v-if與v-for那個優先級高?
- 下載excel
- 導入excel
- Echart-China-Map
- vue-xlsx(解析excel)
- 給elementUI的el-table添加骨架
- cdn引入配置
- Vue2.x之defineProperty應用
- 徹底弄懂diff算法的key作用
- 復制模板內容
- 表格操作按鈕太多
- element常用組件二次封裝
- Vue3.x
- Vue3快速上手(第一天)
- Vue3.x快速上手(第二天)
- Vue3.x快速上手(第三天)
- vue3+element-plus搭建項目
- vue3
- 腳手架
- vvmily-cli
- TS
- ts筆記
- common
- Date
- utils
- axios封裝
- 2022年
- HTML
- CSS基礎
- JavaScript 基礎
- 前端框架Vue
- 計算機網絡
- 瀏覽器相關
- 性能優化
- js手寫代碼
- 前端安全
- 前端算法
- 前端構建與編譯
- 操作系統
- Node.js
- 一些開放問題、智力題