
# Using the Metrics Dashboard
> 原文:[https://docs.gitlab.com/ee/operations/metrics/dashboards/](https://docs.gitlab.com/ee/operations/metrics/dashboards/)
* [Manage the metrics dashboard settings](#manage-the-metrics-dashboard-settings)
* [Chart Context Menu](#chart-context-menu)
* [View and edit the source file of a custom dashboard](#view-and-edit-the-source-file-of-a-custom-dashboard)
* [Expand panel](#expand-panel)
* [View Logs](#view-logs-ultimate)
* [Timeline zoom and URL sharing](#timeline-zoom-and-url-sharing)
* [Downloading data as CSV](#downloading-data-as-csv)
* [Dashboard Annotations](#dashboard-annotations)
* [Retention policy](#retention-policy)
* [Add related links to custom dashboards](#add-related-links-to-custom-dashboards)
* [Links Syntax](#links-syntax)
* [Defining custom dashboards per project](#defining-custom-dashboards-per-project)
* [Adding a new dashboard to your project](#adding-a-new-dashboard-to-your-project)
* [Navigating to a custom dashboard](#navigating-to-a-custom-dashboard)
* [Duplicating a GitLab-defined dashboard](#duplicating-a-gitlab-defined-dashboard)
* [Troubleshooting](#troubleshooting)
* [“No data found” error on Metrics dashboard page](#no-data-found-error-on-metrics-dashboard-page)
# Using the Metrics Dashboard[](#using-the-metrics-dashboard "Permalink")
## Manage the metrics dashboard settings[](#manage-the-metrics-dashboard-settings "Permalink")
在 GitLab 13.2 中[引入](https://gitlab.com/gitlab-org/gitlab/-/issues/223204) .
要管理指標信息中心的設置,請執行以下操作:
1. 以具有項目維護者或管理員[權限](../../../user/permissions.html#project-members-permissions)的用戶身份登錄.
2. 導航至以下位置的信息中心 **操作>指標** .
3. 在資訊主頁的右上角,按一下 **指標設置** :
[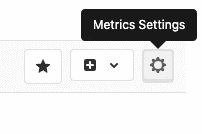](../../../user/project/integrations/img/metrics_settings_button_v13_2.png)
## Chart Context Menu[](#chart-context-menu "Permalink")
在信息中心的每個面板上,您都可以通過以下方式訪問上下文菜單: 面板右上角上方的" **更多操作"**下拉框可采取與圖表數據相關的操作.
[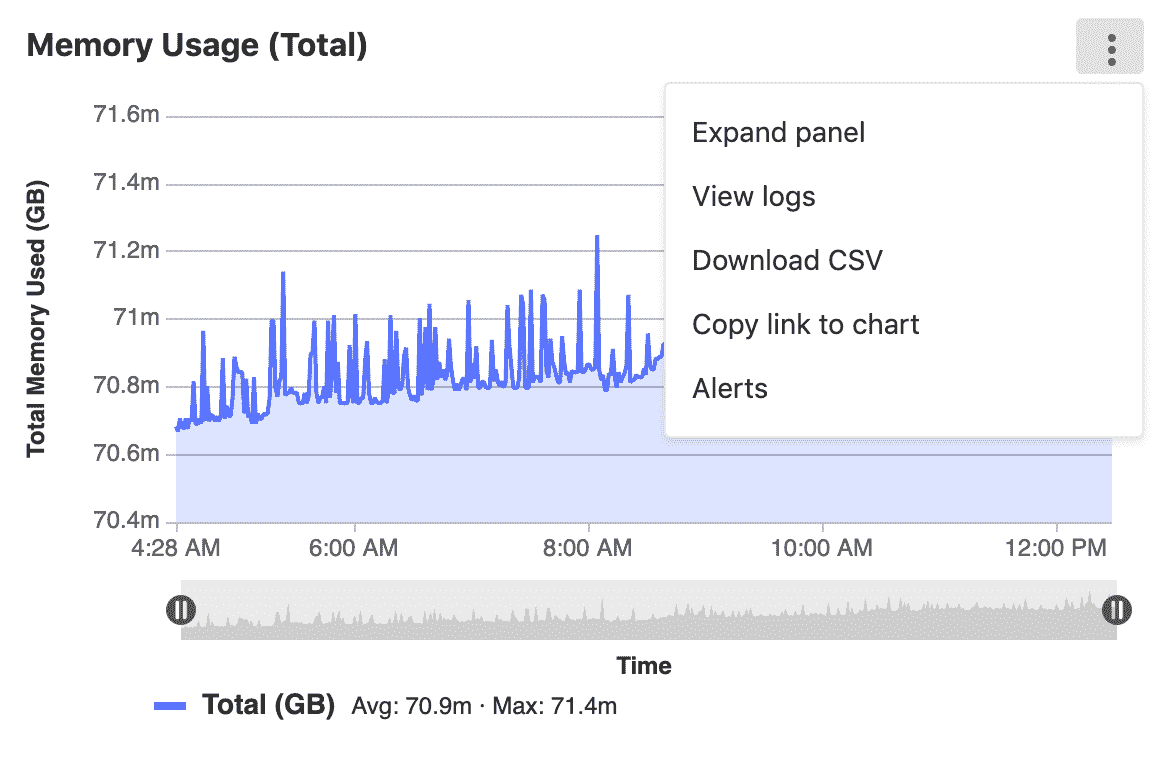](../../../user/project/integrations/img/panel_context_menu_v13_0.png)
選項包括:
* [Expand panel](#expand-panel)
* [View logs](#view-logs-ultimate)
* [Download CSV](#downloading-data-as-csv)
* [Copy link to chart](../embed.html#embedding-gitlab-managed-kubernetes-metrics)
* [Alerts](../alerts.html)
### View and edit the source file of a custom dashboard[](#view-and-edit-the-source-file-of-a-custom-dashboard "Permalink")
在 GitLab 12.5 中[引入](https://gitlab.com/gitlab-org/gitlab/-/issues/34779) .
查看項目的自定義儀表板時,可以通過單擊" **編輯儀表板"**按鈕來查看原始的`.yml`文件.
### Expand panel[](#expand-panel "Permalink")
在 GitLab 13.0 中[引入](https://gitlab.com/groups/gitlab-org/-/epics/3100) .
要查看較大的可視化版本,請點擊 **更多操作**圖標,然后選擇**展開面板** .
要返回指標儀表板,請單擊瀏覽器中的" **后退"**按鈕,或按`Esc`鍵.
### View Logs[](#view-logs-ultimate "Permalink")
在 GitLab 12.8 中[引入](https://gitlab.com/gitlab-org/gitlab/-/issues/122013) .
如果啟用了[日志](../../../user/project/clusters/kubernetes_pod_logs.html) ,則可以通過單擊右上角的上下文菜單從儀表板中的圖表導航以查看日志.
如果使用圖表底部的**時間軸縮放**功能,日志將縮小到您選擇的時間范圍.
### Timeline zoom and URL sharing[](#timeline-zoom-and-url-sharing "Permalink")
在 GitLab 12.8 中[引入](https://gitlab.com/gitlab-org/gitlab/-/issues/198910) .
您可以使用圖表底部的**時間軸縮放**功能來放大所選的日期和時間. 單擊并拖動滑塊以選擇要顯示的數據的其他開始或結束日期時,GitLab 會將所選的開始和結束時間添加到 URL,從而使您可以更輕松地共享特定的時間范圍.
### Downloading data as CSV[](#downloading-data-as-csv "Permalink")
指標儀表板上 Prometheus 圖表中的數據可以 CSV 格式下載.
## Dashboard Annotations[](#dashboard-annotations "Permalink")
版本歷史
* 在 GitLab 12.10 中[引入](https://gitlab.com/gitlab-org/gitlab/-/issues/211330) (由功能標志`metrics_dashboard_annotations`啟用).
* 在 GitLab 13.0 中[刪除](https://gitlab.com/gitlab-org/gitlab/-/issues/215224)了[功能標志](https://gitlab.com/gitlab-org/gitlab/-/issues/215224) .
您可以使用" **指標儀表板注釋"**通過在每個指標儀表板上添加注釋來標記任何重要事件. 在查看儀表板時,分配給所選時間范圍的注釋條目將自動獲取并顯示在該儀表板內的每個圖表上. 鼠標懸停時,每個注釋都會顯示其他詳細信息,包括事件的確切時間及其描述.
您可以通過向[Metrics 儀表板注釋 API](../../../api/metrics_dashboard_annotations.html)發出請求來創建注釋
[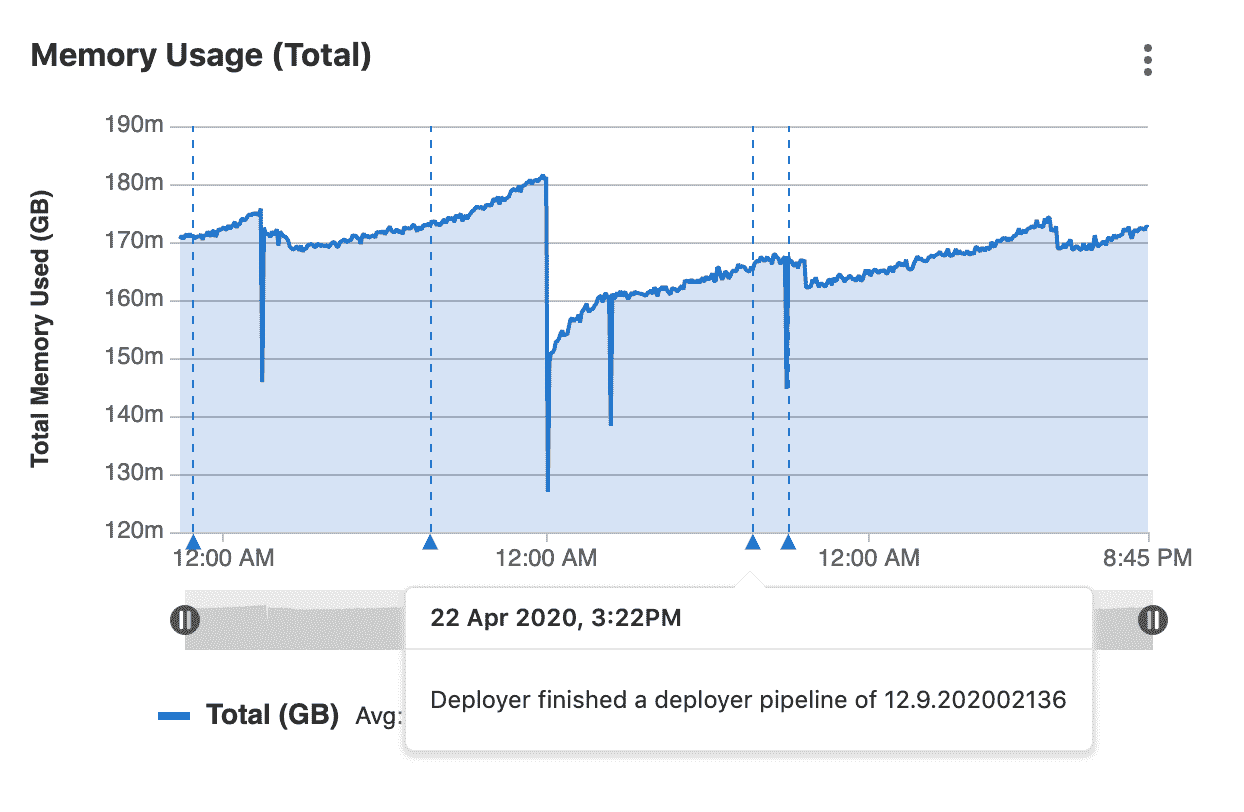](../../../user/project/integrations/img/metrics_dashboard_annotations_ui_v13.0.png)
### Retention policy[](#retention-policy "Permalink")
在 GitLab 13.01 中[引入](https://gitlab.com/gitlab-org/gitlab/-/issues/211433) .
為了避免過時的注釋浪費過多的存儲空間,每天都會刪除附加到超過兩周時間段的記錄. 此重復后臺作業在本地服務器時間上午 1:00 運行.
## Add related links to custom dashboards[](#add-related-links-to-custom-dashboards "Permalink")
在 GitLab 13.1 中[引入](https://gitlab.com/gitlab-org/gitlab/-/issues/216385) .
You can embed links to other dashboards or external services in your custom dashboard by adding **相關鏈接** to your dashboard’s YAML file. Related links open in the same tab as the dashboard. Related links can be displayed in the following locations on your dashboard:
* 在儀表板頂部,作為頂層[`links`儀表板屬性](../../../operations/metrics/dashboards/yaml.html#dashboard-top-level-properties) .
* 在圖表中,上下文菜單作為[面板](../../../operations/metrics/dashboards/yaml.html#panel-panels-properties)的[`links`屬性](../../../operations/metrics/dashboards/yaml.html#panel-panels-properties) .
相關鏈接可以包含以下屬性:
* `url` :鏈接的完整 URL. 需要.
* `title` :描述鏈接的短語. 可選的. 如果未設置此屬性,則將完整的 URL 用于鏈接標題.
* `type` :一個聲明鏈接類型的字符串. 可選的. 如果設置為`grafana` ,則儀表板的時間范圍值將轉換為 Grafana 的時間范圍格式并附加到`url` .
儀表板的時間范圍作為 URL 參數附加到`url` .
以下示例顯示了添加到儀表板的兩個相關鏈接( `GitLab.com`和`GitLab Documentation` ):
[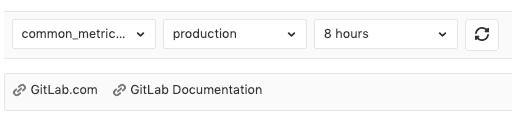](../../../user/project/integrations/img/related_links_v13_1.png)
### Links Syntax[](#links-syntax "Permalink")
```
links:
- title: GitLab.com
url: https://gitlab.com
- title: GitLab Documentation
url: https://docs.gitlab.com
- title: Public Grafana playground dashboard
url: https://play.grafana.org/d/000000012/grafana-play-home?orgId=1
type: grafana
```
## Defining custom dashboards per project[](#defining-custom-dashboards-per-project "Permalink")
在 GitLab 12.1 中[引入](https://gitlab.com/gitlab-org/gitlab-foss/-/issues/59974) .
默認情況下,所有項目都包含一個由 GitLab 定義的 Prometheus 儀表板,其中包括一些關鍵指標,但是您也可以定義自己的自定義儀表板.
您可以從頭開始創建新文件,也可以復制 GitLab 定義的 Prometheus 儀表板.
**注意:**與[自定義指標](../index.html#adding-custom-metrics)不同,以下[定義的指標](../index.html#adding-custom-metrics)不支持警報.
### Adding a new dashboard to your project[](#adding-a-new-dashboard-to-your-project "Permalink")
GitLab 13.2 中[引入的](https://gitlab.com/gitlab-org/gitlab/-/issues/223204) UI 選項.
您可以通過將新的 YAML 文件添加到項目的`.gitlab/dashboards/`目錄中來配置自定義儀表`.gitlab/dashboards/` . 為了將儀表板顯示在項目的 **在"操作">"度量標準"**頁面上,文件必須具有`.yml`擴展名,并且應存在于項目的**默認**分支中.
要從 GitLab 用戶界面創建新的儀表板,請執行以下操作:
1. 以具有"維護者"或"所有者" [權限](../../../user/permissions.html#project-members-permissions)的用戶身份登錄到 GitLab.
2. 導航至以下位置的信息中心 **操作>指標** .
3. 在信息中心的右上角,點擊 **在"操作"**菜單上,然后選擇" **新建"** : [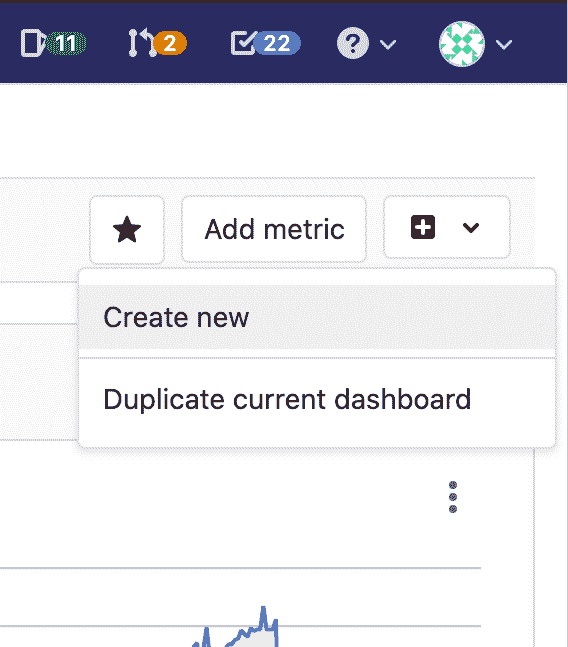](../../../user/project/integrations/img/actions_menu_create_new_dashboard_v13_2.png)
4. 在模式窗口中,單擊**打開存儲庫** ,然后按照說明從命令行創建新的儀表板.
要從命令行創建新的儀表板:
1. 在存儲庫的根目錄下創建`.gitlab/dashboards/prom_alerts.yml` . 每個 YAML 文件都應定義儀表板的布局以及用于填充數據的 Prometheus 查詢. 此示例儀表板顯示一個面積圖:
```
dashboard: 'Dashboard Title'
panel_groups:
- group: 'Group Title'
panels:
- type: area-chart
title: "Chart Title"
y_label: "Y-Axis"
y_axis:
format: number
precision: 0
metrics:
- id: my_metric_id
query_range: 'http_requests_total'
label: "Instance: {{instance}}, method: {{method}}"
unit: "count"
```
2. 保存文件,提交并推送到您的存儲庫. 該文件必須存在于您的**默認**分支中.
3. 導航到項目的" **操作">"指標",**然后從下拉列表中選擇自定義儀表板.
**注意:**不支持嵌套在`.gitlab/dashboards`子目錄下的配置文件,并且在 UI 中將不可用.
### Navigating to a custom dashboard[](#navigating-to-a-custom-dashboard "Permalink")
自定義儀表板通過其文件名唯一標識. 為了快速查看自定義儀表板,只需通過以下方式在 URL 中使用儀表板文件名: `https://gitlab-instance.example.com/project/-/metrics/custom_dashboard_name.yml` : `https://gitlab-instance.example.com/project/-/metrics/custom_dashboard_name.yml` .
### Duplicating a GitLab-defined dashboard[](#duplicating-a-gitlab-defined-dashboard "Permalink")
版本歷史
* 在 GitLab 12.7 中[引入](https://gitlab.com/gitlab-org/gitlab/-/issues/37238) .
* 從[GitLab 12.8 開始](https://gitlab.com/gitlab-org/gitlab/-/issues/39505) ,自定義指標也將在您復制儀表板時被復制.
您可以保存 GitLab 定義的儀表板的完整副本以及添加到其中的所有自定義指標. 可以對生成的`.yml`文件進行自定義并使其適合您的項目. 您可以決定將儀表板`.yml`文件保存在項目的**默認**分支或新分支中.
1. 在儀表板下拉菜單或操作菜單中,單擊**重復儀表**板.
**注意:**您只能復制 GitLab 定義的儀表板.
2. 輸入文件名和其他信息,例如新提交的消息,然后單擊**Duplicate** .
如果選擇**默認**分支,新的儀表板將立即可用. 如果選擇另一個分支,則應首先將此分支合并到**默認**分支.
## Troubleshooting[](#troubleshooting "Permalink")
對托管的 Prometheus 應用程序的問題進行故障排除時, [查看 Prometheus UI](../../../development/prometheus.html#access-the-ui-of-a-prometheus-managed-application-in-kubernetes)通常很有用.
### “No data found” error on Metrics dashboard page[](#no-data-found-error-on-metrics-dashboard-page "Permalink")
如果繼續出現"找不到數據"屏幕,則可能是由于:
* 此環境尚未成功部署.
* Prometheus 沒有此環境的性能數據,或者指標未正確標記. 要對此進行測試,請連接到 Prometheus 服務器并[運行查詢](../../../user/project/integrations/prometheus_library/kubernetes.html#metrics-supported) ,將`$CI_ENVIRONMENT_SLUG`替換`$CI_ENVIRONMENT_SLUG`您的環境名稱.
* 您可能需要重新添加 GitLab 預定義的通用指標. 這可以通過運行[導入公用度量 Rake 任務來完成](../../../administration/raketasks/maintenance.html#import-common-metrics) .
- GitLab Docs
- Installation
- Requirements
- GitLab cloud native Helm Chart
- Install GitLab with Docker
- Installation from source
- Install GitLab on Microsoft Azure
- Installing GitLab on Google Cloud Platform
- Installing GitLab on Amazon Web Services (AWS)
- Analytics
- Code Review Analytics
- Productivity Analytics
- Value Stream Analytics
- Kubernetes clusters
- Adding and removing Kubernetes clusters
- Adding EKS clusters
- Adding GKE clusters
- Group-level Kubernetes clusters
- Instance-level Kubernetes clusters
- Canary Deployments
- Cluster Environments
- Deploy Boards
- GitLab Managed Apps
- Crossplane configuration
- Cluster management project (alpha)
- Kubernetes Logs
- Runbooks
- Serverless
- Deploying AWS Lambda function using GitLab CI/CD
- Securing your deployed applications
- Groups
- Contribution Analytics
- Custom group-level project templates
- Epics
- Manage epics
- Group Import/Export
- Insights
- Issues Analytics
- Iterations
- Public access
- SAML SSO for GitLab.com groups
- SCIM provisioning using SAML SSO for GitLab.com groups
- Subgroups
- Roadmap
- Projects
- GitLab Secure
- Security Configuration
- Container Scanning
- Dependency Scanning
- Dependency List
- Static Application Security Testing (SAST)
- Secret Detection
- Dynamic Application Security Testing (DAST)
- GitLab Security Dashboard
- Offline environments
- Standalone Vulnerability pages
- Security scanner integration
- Badges
- Bulk editing issues and merge requests at the project level
- Code Owners
- Compliance
- License Compliance
- Compliance Dashboard
- Create a project
- Description templates
- Deploy Keys
- Deploy Tokens
- File finder
- Project integrations
- Integrations
- Atlassian Bamboo CI Service
- Bugzilla Service
- Custom Issue Tracker service
- Discord Notifications service
- Enabling emails on push
- GitHub project integration
- Hangouts Chat service
- Atlassian HipChat
- Irker IRC Gateway
- GitLab Jira integration
- Mattermost Notifications Service
- Mattermost slash commands
- Microsoft Teams service
- Mock CI Service
- Prometheus integration
- Redmine Service
- Slack Notifications Service
- Slack slash commands
- GitLab Slack application
- Webhooks
- YouTrack Service
- Insights
- Issues
- Crosslinking Issues
- Design Management
- Confidential issues
- Due dates
- Issue Boards
- Issue Data and Actions
- Labels
- Managing issues
- Milestones
- Multiple Assignees for Issues
- Related issues
- Service Desk
- Sorting and ordering issue lists
- Issue weight
- Associate a Zoom meeting with an issue
- Merge requests
- Allow collaboration on merge requests across forks
- Merge Request Approvals
- Browser Performance Testing
- How to create a merge request
- Cherry-pick changes
- Code Quality
- Load Performance Testing
- Merge Request dependencies
- Fast-forward merge requests
- Merge when pipeline succeeds
- Merge request conflict resolution
- Reverting changes
- Reviewing and managing merge requests
- Squash and merge
- Merge requests versions
- Draft merge requests
- Members of a project
- Migrating projects to a GitLab instance
- Import your project from Bitbucket Cloud to GitLab
- Import your project from Bitbucket Server to GitLab
- Migrating from ClearCase
- Migrating from CVS
- Import your project from FogBugz to GitLab
- Gemnasium
- Import your project from GitHub to GitLab
- Project importing from GitLab.com to your private GitLab instance
- Import your project from Gitea to GitLab
- Import your Jira project issues to GitLab
- Migrating from Perforce Helix
- Import Phabricator tasks into a GitLab project
- Import multiple repositories by uploading a manifest file
- Import project from repo by URL
- Migrating from SVN to GitLab
- Migrating from TFVC to Git
- Push Options
- Releases
- Repository
- Branches
- Git Attributes
- File Locking
- Git file blame
- Git file history
- Repository mirroring
- Protected branches
- Protected tags
- Push Rules
- Reduce repository size
- Signing commits with GPG
- Syntax Highlighting
- GitLab Web Editor
- Web IDE
- Requirements Management
- Project settings
- Project import/export
- Project access tokens (Alpha)
- Share Projects with other Groups
- Snippets
- Static Site Editor
- Wiki
- Project operations
- Monitor metrics for your CI/CD environment
- Set up alerts for Prometheus metrics
- Embedding metric charts within GitLab-flavored Markdown
- Embedding Grafana charts
- Using the Metrics Dashboard
- Dashboard YAML properties
- Metrics dashboard settings
- Panel types for dashboards
- Using Variables
- Templating variables for metrics dashboards
- Prometheus Metrics library
- Monitoring AWS Resources
- Monitoring HAProxy
- Monitoring Kubernetes
- Monitoring NGINX
- Monitoring NGINX Ingress Controller
- Monitoring NGINX Ingress Controller with VTS metrics
- Alert Management
- Error Tracking
- Tracing
- Incident Management
- GitLab Status Page
- Feature Flags
- GitLab CI/CD
- GitLab CI/CD pipeline configuration reference
- GitLab CI/CD include examples
- Introduction to CI/CD with GitLab
- Getting started with GitLab CI/CD
- How to enable or disable GitLab CI/CD
- Using SSH keys with GitLab CI/CD
- Migrating from CircleCI
- Migrating from Jenkins
- Auto DevOps
- Getting started with Auto DevOps
- Requirements for Auto DevOps
- Customizing Auto DevOps
- Stages of Auto DevOps
- Upgrading PostgreSQL for Auto DevOps
- Cache dependencies in GitLab CI/CD
- GitLab ChatOps
- Cloud deployment
- Docker integration
- Building Docker images with GitLab CI/CD
- Using Docker images
- Building images with kaniko and GitLab CI/CD
- GitLab CI/CD environment variables
- Predefined environment variables reference
- Where variables can be used
- Deprecated GitLab CI/CD variables
- Environments and deployments
- Protected Environments
- GitLab CI/CD Examples
- Test a Clojure application with GitLab CI/CD
- Using Dpl as deployment tool
- Testing a Phoenix application with GitLab CI/CD
- End-to-end testing with GitLab CI/CD and WebdriverIO
- DevOps and Game Dev with GitLab CI/CD
- Deploy a Spring Boot application to Cloud Foundry with GitLab CI/CD
- How to deploy Maven projects to Artifactory with GitLab CI/CD
- Testing PHP projects
- Running Composer and NPM scripts with deployment via SCP in GitLab CI/CD
- Test and deploy Laravel applications with GitLab CI/CD and Envoy
- Test and deploy a Python application with GitLab CI/CD
- Test and deploy a Ruby application with GitLab CI/CD
- Test and deploy a Scala application to Heroku
- GitLab CI/CD for external repositories
- Using GitLab CI/CD with a Bitbucket Cloud repository
- Using GitLab CI/CD with a GitHub repository
- GitLab Pages
- GitLab Pages
- GitLab Pages domain names, URLs, and baseurls
- Create a GitLab Pages website from scratch
- Custom domains and SSL/TLS Certificates
- GitLab Pages integration with Let's Encrypt
- GitLab Pages Access Control
- Exploring GitLab Pages
- Incremental Rollouts with GitLab CI/CD
- Interactive Web Terminals
- Optimizing GitLab for large repositories
- Metrics Reports
- CI/CD pipelines
- Pipeline Architecture
- Directed Acyclic Graph
- Multi-project pipelines
- Parent-child pipelines
- Pipelines for Merge Requests
- Pipelines for Merged Results
- Merge Trains
- Job artifacts
- Pipeline schedules
- Pipeline settings
- Triggering pipelines through the API
- Review Apps
- Configuring GitLab Runners
- GitLab CI services examples
- Using MySQL
- Using PostgreSQL
- Using Redis
- Troubleshooting CI/CD
- GitLab Package Registry
- GitLab Container Registry
- Dependency Proxy
- GitLab Composer Repository
- GitLab Conan Repository
- GitLab Maven Repository
- GitLab NPM Registry
- GitLab NuGet Repository
- GitLab PyPi Repository
- API Docs
- API resources
- .gitignore API
- GitLab CI YMLs API
- Group and project access requests API
- Appearance API
- Applications API
- Audit Events API
- Avatar API
- Award Emoji API
- Project badges API
- Group badges API
- Branches API
- Broadcast Messages API
- Project clusters API
- Group clusters API
- Instance clusters API
- Commits API
- Container Registry API
- Custom Attributes API
- Dashboard annotations API
- Dependencies API
- Deploy Keys API
- Deployments API
- Discussions API
- Dockerfiles API
- Environments API
- Epics API
- Events
- Feature Flags API
- Feature flag user lists API
- Freeze Periods API
- Geo Nodes API
- Group Activity Analytics API
- Groups API
- Import API
- Issue Boards API
- Group Issue Boards API
- Issues API
- Epic Issues API
- Issues Statistics API
- Jobs API
- Keys API
- Labels API
- Group Labels API
- License
- Licenses API
- Issue links API
- Epic Links API
- Managed Licenses API
- Markdown API
- Group and project members API
- Merge request approvals API
- Merge requests API
- Project milestones API
- Group milestones API
- Namespaces API
- Notes API
- Notification settings API
- Packages API
- Pages domains API
- Pipeline schedules API
- Pipeline triggers API
- Pipelines API
- Project Aliases API
- Project import/export API
- Project repository storage moves API
- Project statistics API
- Project templates API
- Projects API
- Protected branches API
- Protected tags API
- Releases API
- Release links API
- Repositories API
- Repository files API
- Repository submodules API
- Resource label events API
- Resource milestone events API
- Resource weight events API
- Runners API
- SCIM API
- Search API
- Services API
- Application settings API
- Sidekiq Metrics API
- Snippets API
- Project snippets
- Application statistics API
- Suggest Changes API
- System hooks API
- Tags API
- Todos API
- Users API
- Project-level Variables API
- Group-level Variables API
- Version API
- Vulnerabilities API
- Vulnerability Findings API
- Wikis API
- GraphQL API
- Getting started with GitLab GraphQL API
- GraphQL API Resources
- API V3 to API V4
- Validate the .gitlab-ci.yml (API)
- User Docs
- Abuse reports
- User account
- Active sessions
- Deleting a User account
- Permissions
- Personal access tokens
- Profile preferences
- Threads
- GitLab and SSH keys
- GitLab integrations
- Git
- GitLab.com settings
- Infrastructure as code with Terraform and GitLab
- GitLab keyboard shortcuts
- GitLab Markdown
- AsciiDoc
- GitLab Notification Emails
- GitLab Quick Actions
- Autocomplete characters
- Reserved project and group names
- Search through GitLab
- Advanced Global Search
- Advanced Syntax Search
- Time Tracking
- GitLab To-Do List
- Administrator Docs
- Reference architectures
- Reference architecture: up to 1,000 users
- Reference architecture: up to 2,000 users
- Reference architecture: up to 3,000 users
- Reference architecture: up to 5,000 users
- Reference architecture: up to 10,000 users
- Reference architecture: up to 25,000 users
- Reference architecture: up to 50,000 users
- Troubleshooting a reference architecture set up
- Working with the bundled Consul service
- Configuring PostgreSQL for scaling
- Configuring GitLab application (Rails)
- Load Balancer for multi-node GitLab
- Configuring a Monitoring node for Scaling and High Availability
- NFS
- Working with the bundled PgBouncer service
- Configuring Redis for scaling
- Configuring Sidekiq
- Admin Area settings
- Continuous Integration and Deployment Admin settings
- Custom instance-level project templates
- Diff limits administration
- Enable and disable GitLab features deployed behind feature flags
- Geo nodes Admin Area
- GitLab Pages administration
- Health Check
- Job logs
- Labels administration
- Log system
- PlantUML & GitLab
- Repository checks
- Repository storage paths
- Repository storage types
- Account and limit settings
- Service templates
- System hooks
- Changing your time zone
- Uploads administration
- Abuse reports
- Activating and deactivating users
- Audit Events
- Blocking and unblocking users
- Broadcast Messages
- Elasticsearch integration
- Gitaly
- Gitaly Cluster
- Gitaly reference
- Monitoring GitLab
- Monitoring GitLab with Prometheus
- Performance Bar
- Usage statistics
- Object Storage
- Performing Operations in GitLab
- Cleaning up stale Redis sessions
- Fast lookup of authorized SSH keys in the database
- Filesystem Performance Benchmarking
- Moving repositories managed by GitLab
- Run multiple Sidekiq processes
- Sidekiq MemoryKiller
- Switching to Puma
- Understanding Unicorn and unicorn-worker-killer
- User lookup via OpenSSH's AuthorizedPrincipalsCommand
- GitLab Package Registry administration
- GitLab Container Registry administration
- Replication (Geo)
- Geo database replication
- Geo with external PostgreSQL instances
- Geo configuration
- Using a Geo Server
- Updating the Geo nodes
- Geo with Object storage
- Docker Registry for a secondary node
- Geo for multiple nodes
- Geo security review (Q&A)
- Location-aware Git remote URL with AWS Route53
- Tuning Geo
- Removing secondary Geo nodes
- Geo data types support
- Geo Frequently Asked Questions
- Geo Troubleshooting
- Geo validation tests
- Disaster Recovery (Geo)
- Disaster recovery for planned failover
- Bring a demoted primary node back online
- Automatic background verification
- Rake tasks
- Back up and restore GitLab
- Clean up
- Namespaces
- Maintenance Rake tasks
- Geo Rake Tasks
- GitHub import
- Import bare repositories
- Integrity check Rake task
- LDAP Rake tasks
- Listing repository directories
- Praefect Rake tasks
- Project import/export administration
- Repository storage Rake tasks
- Generate sample Prometheus data
- Uploads migrate Rake tasks
- Uploads sanitize Rake tasks
- User management
- Webhooks administration
- X.509 signatures
- Server hooks
- Static objects external storage
- Updating GitLab
- GitLab release and maintenance policy
- Security
- Password Storage
- Custom password length limits
- Restrict allowed SSH key technologies and minimum length
- Rate limits
- Webhooks and insecure internal web services
- Information exclusivity
- How to reset your root password
- How to unlock a locked user from the command line
- User File Uploads
- How we manage the TLS protocol CRIME vulnerability
- User email confirmation at sign-up
- Security of running jobs
- Proxying assets
- CI/CD Environment Variables
- Contributor and Development Docs
- Contribute to GitLab
- Community members & roles
- Implement design & UI elements
- Issues workflow
- Merge requests workflow
- Code Review Guidelines
- Style guides
- GitLab Architecture Overview
- CI/CD development documentation
- Database guides
- Database Review Guidelines
- Database Review Guidelines
- Migration Style Guide
- What requires downtime?
- Understanding EXPLAIN plans
- Rake tasks for developers
- Mass inserting Rails models
- GitLab Documentation guidelines
- Documentation Style Guide
- Documentation structure and template
- Documentation process
- Documentation site architecture
- Global navigation
- GitLab Docs monthly release process
- Telemetry Guide
- Usage Ping Guide
- Snowplow Guide
- Experiment Guide
- Feature flags in development of GitLab
- Feature flags process
- Developing with feature flags
- Feature flag controls
- Document features deployed behind feature flags
- Frontend Development Guidelines
- Accessibility & Readability
- Ajax
- Architecture
- Axios
- Design Patterns
- Frontend Development Process
- DropLab
- Emojis
- Filter
- Frontend FAQ
- GraphQL
- Icons and SVG Illustrations
- InputSetter
- Performance
- Principles
- Security
- Tooling
- Vuex
- Vue
- Geo (development)
- Geo self-service framework (alpha)
- Gitaly developers guide
- GitLab development style guides
- API style guide
- Go standards and style guidelines
- GraphQL API style guide
- Guidelines for shell commands in the GitLab codebase
- HTML style guide
- JavaScript style guide
- Migration Style Guide
- Newlines style guide
- Python Development Guidelines
- SCSS style guide
- Shell scripting standards and style guidelines
- Sidekiq debugging
- Sidekiq Style Guide
- SQL Query Guidelines
- Vue.js style guide
- Instrumenting Ruby code
- Testing standards and style guidelines
- Flaky tests
- Frontend testing standards and style guidelines
- GitLab tests in the Continuous Integration (CI) context
- Review Apps
- Smoke Tests
- Testing best practices
- Testing levels
- Testing Rails migrations at GitLab
- Testing Rake tasks
- End-to-end Testing
- Beginner's guide to writing end-to-end tests
- End-to-end testing Best Practices
- Dynamic Element Validation
- Flows in GitLab QA
- Page objects in GitLab QA
- Resource class in GitLab QA
- Style guide for writing end-to-end tests
- Testing with feature flags
- Translate GitLab to your language
- Internationalization for GitLab
- Translating GitLab
- Proofread Translations
- Merging translations from CrowdIn
- Value Stream Analytics development guide
- GitLab subscription
- Activate GitLab EE with a license