
# Performance Bar
> 原文:[https://docs.gitlab.com/ee/administration/monitoring/performance/performance_bar.html](https://docs.gitlab.com/ee/administration/monitoring/performance/performance_bar.html)
* [Request warnings](#request-warnings)
* [Enable the Performance Bar via the Admin panel](#enable-the-performance-bar-via-the-admin-panel)
* [Keyboard shortcut for the Performance Bar](#keyboard-shortcut-for-the-performance-bar)
# Performance Bar[](#performance-bar "Permalink")
您可以顯示 GitLab 性能欄以查看頁面性能的統計信息. 激活后,其外觀如下:
[](img/performance_bar.png)
從左到右,它顯示:
* **當前主機** :服務于該頁面的當前主機.
* **數據庫查詢** :花費的時間(毫秒)和數據庫查詢的總數,以`00ms / 00pg`的格式顯示. 單擊以顯示更多信息的模式窗口: [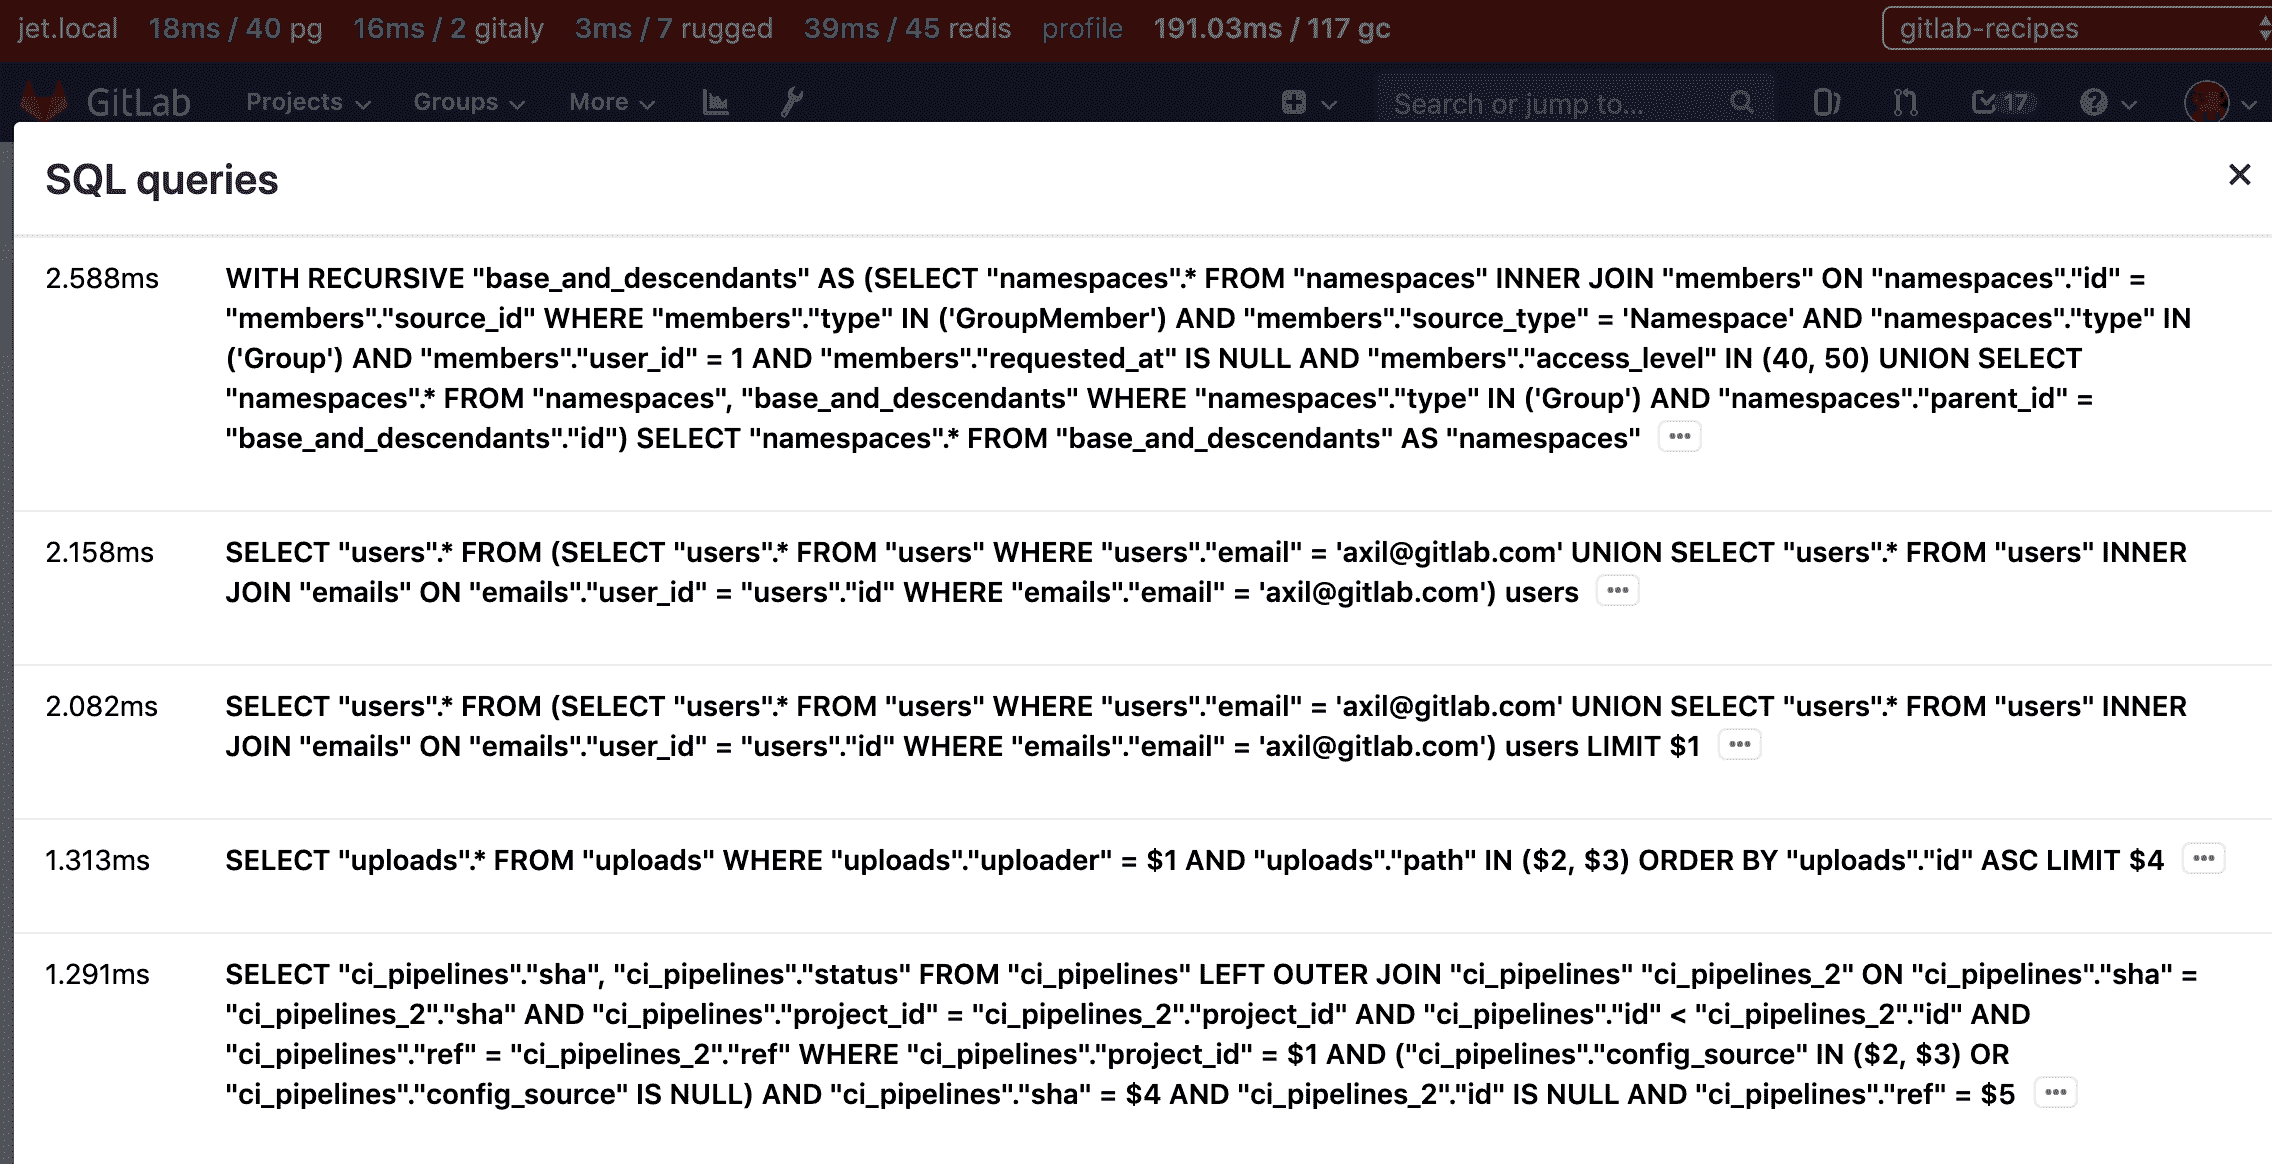](img/performance_bar_sql_queries.png)
* **Gitaly 通話** :所花費的時間(以毫秒為單位)和[Gitaly](../../gitaly/index.html)通話的總數. 單擊以顯示更多信息的模式窗口: [](img/performance_bar_gitaly_calls.png)
* **堅固通話** :花費的時間(以毫秒為單位)和[堅固](../../high_availability/nfs.html#improving-nfs-performance-with-gitlab)通話的總數. 單擊以顯示更多信息的模式窗口: [](img/performance_bar_rugged_calls.png)
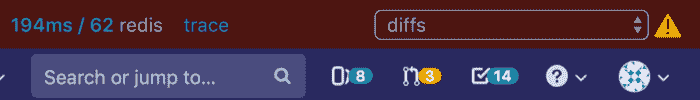
* **Redis 呼叫** :花費的時間(以毫秒為單位)和 Redis 呼叫的總數. 單擊以顯示更多信息的模式窗口: [](img/performance_bar_redis_calls.png)
* **Elasticsearch 調用** :花費的時間(以毫秒為單位)和 Elasticsearch 調用的總數. 單擊以顯示更多信息的模式窗口.
* 頁面的**加載時間** :如果您的瀏覽器支持加載時間(Chromium 和 Chrome),則以毫秒為單位的多個值(以斜杠分隔). 單擊以顯示更多信息的模式窗口. 值從左到右:
* **后端** :加載基本頁面所需的時間.
* [**First Contentful Paint**](https://s0web0dev.icopy.site/first-contentful-paint/) :直到用戶看到某些東西為止的時間.
* [**DomContentLoaded**](https://developers.google.com/web/fundamentals/performance/critical-rendering-path/measure-crp)事件.
* 頁面加載**的請求總數** : [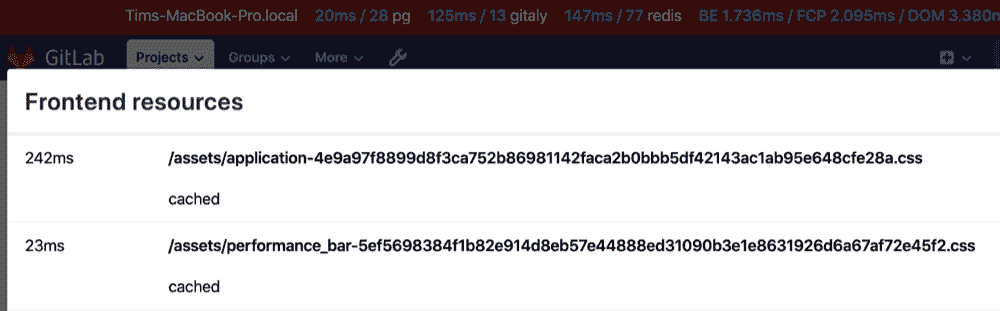](img/performance_bar_frontend.png)
* **跟蹤** :如果集成了 Jaeger,則**Trace**鏈接到 Jaeger 跟蹤頁面,其中包含當前請求的`correlation_id` .
* **+** :用于將請求的詳細信息添加到性能欄的鏈接. 可以通過其完整 URL(已認證為當前用戶)或其`X-Request-Id`標頭的值來添加`X-Request-Id` .
* **下載** :下載用于生成 Performance Bar 報告的原始 JSON 的鏈接.
* **請求選擇器** :顯示在性能欄右側的選擇框,通過該選擇框,您可以查看當前頁面打開時發出的所有請求的這些指標. 每個唯一 URL 僅捕獲前兩個請求.
## Request warnings[](#request-warnings "Permalink")
超出預定義限制的請求顯示警告 指標旁邊的圖標和說明. 在此示例中,Gitaly 通話時間超過了閾值:
[](img/performance_bar_gitaly_threshold.png)
如果當前頁面上的任何請求生成警告,則警告圖標將顯示在" **請求"選擇器**旁邊:
[](img/performance_bar_request_selector_warning.png)
帶有警告的**請求**在**請求選擇器中**的路徑后顯示`(!)` :
[](img/performance_bar_request_selector_warning_expanded.png)
## Enable the Performance Bar via the Admin panel[](#enable-the-performance-bar-via-the-admin-panel "Permalink")
默認情況下,GitLab 性能欄是禁用的. 要為給定的組啟用它:
1. 以具有管理員[權限](../../../user/permissions.html)的用戶身份登錄.
2. 在菜單欄中,單擊 **管理區域**圖標.
3. 導航 **設置>指標和分析** ( `admin/application_settings/metrics_and_profiling` ),然后展開" **分析-性能欄** "部分.
4. Click **啟用對性能欄的訪問**.
5. 在**允許的組**字段中,提供允許訪問 GitLab 性能欄的組的完整路徑.
6. Click **保存更改**.
## Keyboard shortcut for the Performance Bar[](#keyboard-shortcut-for-the-performance-bar "Permalink")
啟用 GitLab 性能欄后,按[`p` + `b`鍵盤快捷鍵](../../../user/shortcuts.html)將其顯示,然后再次將其隱藏.
- GitLab Docs
- Installation
- Requirements
- GitLab cloud native Helm Chart
- Install GitLab with Docker
- Installation from source
- Install GitLab on Microsoft Azure
- Installing GitLab on Google Cloud Platform
- Installing GitLab on Amazon Web Services (AWS)
- Analytics
- Code Review Analytics
- Productivity Analytics
- Value Stream Analytics
- Kubernetes clusters
- Adding and removing Kubernetes clusters
- Adding EKS clusters
- Adding GKE clusters
- Group-level Kubernetes clusters
- Instance-level Kubernetes clusters
- Canary Deployments
- Cluster Environments
- Deploy Boards
- GitLab Managed Apps
- Crossplane configuration
- Cluster management project (alpha)
- Kubernetes Logs
- Runbooks
- Serverless
- Deploying AWS Lambda function using GitLab CI/CD
- Securing your deployed applications
- Groups
- Contribution Analytics
- Custom group-level project templates
- Epics
- Manage epics
- Group Import/Export
- Insights
- Issues Analytics
- Iterations
- Public access
- SAML SSO for GitLab.com groups
- SCIM provisioning using SAML SSO for GitLab.com groups
- Subgroups
- Roadmap
- Projects
- GitLab Secure
- Security Configuration
- Container Scanning
- Dependency Scanning
- Dependency List
- Static Application Security Testing (SAST)
- Secret Detection
- Dynamic Application Security Testing (DAST)
- GitLab Security Dashboard
- Offline environments
- Standalone Vulnerability pages
- Security scanner integration
- Badges
- Bulk editing issues and merge requests at the project level
- Code Owners
- Compliance
- License Compliance
- Compliance Dashboard
- Create a project
- Description templates
- Deploy Keys
- Deploy Tokens
- File finder
- Project integrations
- Integrations
- Atlassian Bamboo CI Service
- Bugzilla Service
- Custom Issue Tracker service
- Discord Notifications service
- Enabling emails on push
- GitHub project integration
- Hangouts Chat service
- Atlassian HipChat
- Irker IRC Gateway
- GitLab Jira integration
- Mattermost Notifications Service
- Mattermost slash commands
- Microsoft Teams service
- Mock CI Service
- Prometheus integration
- Redmine Service
- Slack Notifications Service
- Slack slash commands
- GitLab Slack application
- Webhooks
- YouTrack Service
- Insights
- Issues
- Crosslinking Issues
- Design Management
- Confidential issues
- Due dates
- Issue Boards
- Issue Data and Actions
- Labels
- Managing issues
- Milestones
- Multiple Assignees for Issues
- Related issues
- Service Desk
- Sorting and ordering issue lists
- Issue weight
- Associate a Zoom meeting with an issue
- Merge requests
- Allow collaboration on merge requests across forks
- Merge Request Approvals
- Browser Performance Testing
- How to create a merge request
- Cherry-pick changes
- Code Quality
- Load Performance Testing
- Merge Request dependencies
- Fast-forward merge requests
- Merge when pipeline succeeds
- Merge request conflict resolution
- Reverting changes
- Reviewing and managing merge requests
- Squash and merge
- Merge requests versions
- Draft merge requests
- Members of a project
- Migrating projects to a GitLab instance
- Import your project from Bitbucket Cloud to GitLab
- Import your project from Bitbucket Server to GitLab
- Migrating from ClearCase
- Migrating from CVS
- Import your project from FogBugz to GitLab
- Gemnasium
- Import your project from GitHub to GitLab
- Project importing from GitLab.com to your private GitLab instance
- Import your project from Gitea to GitLab
- Import your Jira project issues to GitLab
- Migrating from Perforce Helix
- Import Phabricator tasks into a GitLab project
- Import multiple repositories by uploading a manifest file
- Import project from repo by URL
- Migrating from SVN to GitLab
- Migrating from TFVC to Git
- Push Options
- Releases
- Repository
- Branches
- Git Attributes
- File Locking
- Git file blame
- Git file history
- Repository mirroring
- Protected branches
- Protected tags
- Push Rules
- Reduce repository size
- Signing commits with GPG
- Syntax Highlighting
- GitLab Web Editor
- Web IDE
- Requirements Management
- Project settings
- Project import/export
- Project access tokens (Alpha)
- Share Projects with other Groups
- Snippets
- Static Site Editor
- Wiki
- Project operations
- Monitor metrics for your CI/CD environment
- Set up alerts for Prometheus metrics
- Embedding metric charts within GitLab-flavored Markdown
- Embedding Grafana charts
- Using the Metrics Dashboard
- Dashboard YAML properties
- Metrics dashboard settings
- Panel types for dashboards
- Using Variables
- Templating variables for metrics dashboards
- Prometheus Metrics library
- Monitoring AWS Resources
- Monitoring HAProxy
- Monitoring Kubernetes
- Monitoring NGINX
- Monitoring NGINX Ingress Controller
- Monitoring NGINX Ingress Controller with VTS metrics
- Alert Management
- Error Tracking
- Tracing
- Incident Management
- GitLab Status Page
- Feature Flags
- GitLab CI/CD
- GitLab CI/CD pipeline configuration reference
- GitLab CI/CD include examples
- Introduction to CI/CD with GitLab
- Getting started with GitLab CI/CD
- How to enable or disable GitLab CI/CD
- Using SSH keys with GitLab CI/CD
- Migrating from CircleCI
- Migrating from Jenkins
- Auto DevOps
- Getting started with Auto DevOps
- Requirements for Auto DevOps
- Customizing Auto DevOps
- Stages of Auto DevOps
- Upgrading PostgreSQL for Auto DevOps
- Cache dependencies in GitLab CI/CD
- GitLab ChatOps
- Cloud deployment
- Docker integration
- Building Docker images with GitLab CI/CD
- Using Docker images
- Building images with kaniko and GitLab CI/CD
- GitLab CI/CD environment variables
- Predefined environment variables reference
- Where variables can be used
- Deprecated GitLab CI/CD variables
- Environments and deployments
- Protected Environments
- GitLab CI/CD Examples
- Test a Clojure application with GitLab CI/CD
- Using Dpl as deployment tool
- Testing a Phoenix application with GitLab CI/CD
- End-to-end testing with GitLab CI/CD and WebdriverIO
- DevOps and Game Dev with GitLab CI/CD
- Deploy a Spring Boot application to Cloud Foundry with GitLab CI/CD
- How to deploy Maven projects to Artifactory with GitLab CI/CD
- Testing PHP projects
- Running Composer and NPM scripts with deployment via SCP in GitLab CI/CD
- Test and deploy Laravel applications with GitLab CI/CD and Envoy
- Test and deploy a Python application with GitLab CI/CD
- Test and deploy a Ruby application with GitLab CI/CD
- Test and deploy a Scala application to Heroku
- GitLab CI/CD for external repositories
- Using GitLab CI/CD with a Bitbucket Cloud repository
- Using GitLab CI/CD with a GitHub repository
- GitLab Pages
- GitLab Pages
- GitLab Pages domain names, URLs, and baseurls
- Create a GitLab Pages website from scratch
- Custom domains and SSL/TLS Certificates
- GitLab Pages integration with Let's Encrypt
- GitLab Pages Access Control
- Exploring GitLab Pages
- Incremental Rollouts with GitLab CI/CD
- Interactive Web Terminals
- Optimizing GitLab for large repositories
- Metrics Reports
- CI/CD pipelines
- Pipeline Architecture
- Directed Acyclic Graph
- Multi-project pipelines
- Parent-child pipelines
- Pipelines for Merge Requests
- Pipelines for Merged Results
- Merge Trains
- Job artifacts
- Pipeline schedules
- Pipeline settings
- Triggering pipelines through the API
- Review Apps
- Configuring GitLab Runners
- GitLab CI services examples
- Using MySQL
- Using PostgreSQL
- Using Redis
- Troubleshooting CI/CD
- GitLab Package Registry
- GitLab Container Registry
- Dependency Proxy
- GitLab Composer Repository
- GitLab Conan Repository
- GitLab Maven Repository
- GitLab NPM Registry
- GitLab NuGet Repository
- GitLab PyPi Repository
- API Docs
- API resources
- .gitignore API
- GitLab CI YMLs API
- Group and project access requests API
- Appearance API
- Applications API
- Audit Events API
- Avatar API
- Award Emoji API
- Project badges API
- Group badges API
- Branches API
- Broadcast Messages API
- Project clusters API
- Group clusters API
- Instance clusters API
- Commits API
- Container Registry API
- Custom Attributes API
- Dashboard annotations API
- Dependencies API
- Deploy Keys API
- Deployments API
- Discussions API
- Dockerfiles API
- Environments API
- Epics API
- Events
- Feature Flags API
- Feature flag user lists API
- Freeze Periods API
- Geo Nodes API
- Group Activity Analytics API
- Groups API
- Import API
- Issue Boards API
- Group Issue Boards API
- Issues API
- Epic Issues API
- Issues Statistics API
- Jobs API
- Keys API
- Labels API
- Group Labels API
- License
- Licenses API
- Issue links API
- Epic Links API
- Managed Licenses API
- Markdown API
- Group and project members API
- Merge request approvals API
- Merge requests API
- Project milestones API
- Group milestones API
- Namespaces API
- Notes API
- Notification settings API
- Packages API
- Pages domains API
- Pipeline schedules API
- Pipeline triggers API
- Pipelines API
- Project Aliases API
- Project import/export API
- Project repository storage moves API
- Project statistics API
- Project templates API
- Projects API
- Protected branches API
- Protected tags API
- Releases API
- Release links API
- Repositories API
- Repository files API
- Repository submodules API
- Resource label events API
- Resource milestone events API
- Resource weight events API
- Runners API
- SCIM API
- Search API
- Services API
- Application settings API
- Sidekiq Metrics API
- Snippets API
- Project snippets
- Application statistics API
- Suggest Changes API
- System hooks API
- Tags API
- Todos API
- Users API
- Project-level Variables API
- Group-level Variables API
- Version API
- Vulnerabilities API
- Vulnerability Findings API
- Wikis API
- GraphQL API
- Getting started with GitLab GraphQL API
- GraphQL API Resources
- API V3 to API V4
- Validate the .gitlab-ci.yml (API)
- User Docs
- Abuse reports
- User account
- Active sessions
- Deleting a User account
- Permissions
- Personal access tokens
- Profile preferences
- Threads
- GitLab and SSH keys
- GitLab integrations
- Git
- GitLab.com settings
- Infrastructure as code with Terraform and GitLab
- GitLab keyboard shortcuts
- GitLab Markdown
- AsciiDoc
- GitLab Notification Emails
- GitLab Quick Actions
- Autocomplete characters
- Reserved project and group names
- Search through GitLab
- Advanced Global Search
- Advanced Syntax Search
- Time Tracking
- GitLab To-Do List
- Administrator Docs
- Reference architectures
- Reference architecture: up to 1,000 users
- Reference architecture: up to 2,000 users
- Reference architecture: up to 3,000 users
- Reference architecture: up to 5,000 users
- Reference architecture: up to 10,000 users
- Reference architecture: up to 25,000 users
- Reference architecture: up to 50,000 users
- Troubleshooting a reference architecture set up
- Working with the bundled Consul service
- Configuring PostgreSQL for scaling
- Configuring GitLab application (Rails)
- Load Balancer for multi-node GitLab
- Configuring a Monitoring node for Scaling and High Availability
- NFS
- Working with the bundled PgBouncer service
- Configuring Redis for scaling
- Configuring Sidekiq
- Admin Area settings
- Continuous Integration and Deployment Admin settings
- Custom instance-level project templates
- Diff limits administration
- Enable and disable GitLab features deployed behind feature flags
- Geo nodes Admin Area
- GitLab Pages administration
- Health Check
- Job logs
- Labels administration
- Log system
- PlantUML & GitLab
- Repository checks
- Repository storage paths
- Repository storage types
- Account and limit settings
- Service templates
- System hooks
- Changing your time zone
- Uploads administration
- Abuse reports
- Activating and deactivating users
- Audit Events
- Blocking and unblocking users
- Broadcast Messages
- Elasticsearch integration
- Gitaly
- Gitaly Cluster
- Gitaly reference
- Monitoring GitLab
- Monitoring GitLab with Prometheus
- Performance Bar
- Usage statistics
- Object Storage
- Performing Operations in GitLab
- Cleaning up stale Redis sessions
- Fast lookup of authorized SSH keys in the database
- Filesystem Performance Benchmarking
- Moving repositories managed by GitLab
- Run multiple Sidekiq processes
- Sidekiq MemoryKiller
- Switching to Puma
- Understanding Unicorn and unicorn-worker-killer
- User lookup via OpenSSH's AuthorizedPrincipalsCommand
- GitLab Package Registry administration
- GitLab Container Registry administration
- Replication (Geo)
- Geo database replication
- Geo with external PostgreSQL instances
- Geo configuration
- Using a Geo Server
- Updating the Geo nodes
- Geo with Object storage
- Docker Registry for a secondary node
- Geo for multiple nodes
- Geo security review (Q&A)
- Location-aware Git remote URL with AWS Route53
- Tuning Geo
- Removing secondary Geo nodes
- Geo data types support
- Geo Frequently Asked Questions
- Geo Troubleshooting
- Geo validation tests
- Disaster Recovery (Geo)
- Disaster recovery for planned failover
- Bring a demoted primary node back online
- Automatic background verification
- Rake tasks
- Back up and restore GitLab
- Clean up
- Namespaces
- Maintenance Rake tasks
- Geo Rake Tasks
- GitHub import
- Import bare repositories
- Integrity check Rake task
- LDAP Rake tasks
- Listing repository directories
- Praefect Rake tasks
- Project import/export administration
- Repository storage Rake tasks
- Generate sample Prometheus data
- Uploads migrate Rake tasks
- Uploads sanitize Rake tasks
- User management
- Webhooks administration
- X.509 signatures
- Server hooks
- Static objects external storage
- Updating GitLab
- GitLab release and maintenance policy
- Security
- Password Storage
- Custom password length limits
- Restrict allowed SSH key technologies and minimum length
- Rate limits
- Webhooks and insecure internal web services
- Information exclusivity
- How to reset your root password
- How to unlock a locked user from the command line
- User File Uploads
- How we manage the TLS protocol CRIME vulnerability
- User email confirmation at sign-up
- Security of running jobs
- Proxying assets
- CI/CD Environment Variables
- Contributor and Development Docs
- Contribute to GitLab
- Community members & roles
- Implement design & UI elements
- Issues workflow
- Merge requests workflow
- Code Review Guidelines
- Style guides
- GitLab Architecture Overview
- CI/CD development documentation
- Database guides
- Database Review Guidelines
- Database Review Guidelines
- Migration Style Guide
- What requires downtime?
- Understanding EXPLAIN plans
- Rake tasks for developers
- Mass inserting Rails models
- GitLab Documentation guidelines
- Documentation Style Guide
- Documentation structure and template
- Documentation process
- Documentation site architecture
- Global navigation
- GitLab Docs monthly release process
- Telemetry Guide
- Usage Ping Guide
- Snowplow Guide
- Experiment Guide
- Feature flags in development of GitLab
- Feature flags process
- Developing with feature flags
- Feature flag controls
- Document features deployed behind feature flags
- Frontend Development Guidelines
- Accessibility & Readability
- Ajax
- Architecture
- Axios
- Design Patterns
- Frontend Development Process
- DropLab
- Emojis
- Filter
- Frontend FAQ
- GraphQL
- Icons and SVG Illustrations
- InputSetter
- Performance
- Principles
- Security
- Tooling
- Vuex
- Vue
- Geo (development)
- Geo self-service framework (alpha)
- Gitaly developers guide
- GitLab development style guides
- API style guide
- Go standards and style guidelines
- GraphQL API style guide
- Guidelines for shell commands in the GitLab codebase
- HTML style guide
- JavaScript style guide
- Migration Style Guide
- Newlines style guide
- Python Development Guidelines
- SCSS style guide
- Shell scripting standards and style guidelines
- Sidekiq debugging
- Sidekiq Style Guide
- SQL Query Guidelines
- Vue.js style guide
- Instrumenting Ruby code
- Testing standards and style guidelines
- Flaky tests
- Frontend testing standards and style guidelines
- GitLab tests in the Continuous Integration (CI) context
- Review Apps
- Smoke Tests
- Testing best practices
- Testing levels
- Testing Rails migrations at GitLab
- Testing Rake tasks
- End-to-end Testing
- Beginner's guide to writing end-to-end tests
- End-to-end testing Best Practices
- Dynamic Element Validation
- Flows in GitLab QA
- Page objects in GitLab QA
- Resource class in GitLab QA
- Style guide for writing end-to-end tests
- Testing with feature flags
- Translate GitLab to your language
- Internationalization for GitLab
- Translating GitLab
- Proofread Translations
- Merging translations from CrowdIn
- Value Stream Analytics development guide
- GitLab subscription
- Activate GitLab EE with a license